Infrastructure monitoring for SAP Systems #
SAP
This guide provides detailed information about how to install and customize SUSE Linux Enterprise Server for SAP applications to monitor hardware-related metrics to provide insights that can help increase uptime of critical SAP applications. It is based on SUSE Linux Enterprise Server for SAP applications 15 SP3. The concept however can also be used starting with SUSE Linux Enterprise Server for SAP applications 15 SP1.
Disclaimer: Documents published as part of the SUSE Best Practices series have been contributed voluntarily by SUSE employees and third parties. They are meant to serve as examples of how particular actions can be performed. They have been compiled with utmost attention to detail. However, this does not guarantee complete accuracy. SUSE cannot verify that actions described in these documents do what is claimed or whether actions described have unintended consequences. SUSE LLC, its affiliates, the authors, and the translators may not be held liable for possible errors or the consequences thereof.
1 Introduction #
Many customers deploy SAP systems such as SAP S/4HANA for their global operations, to support mission-critical business functions. This means the need for maximized system availability becomes crucial. Accordingly, IT departments are faced with very demanding SLAs: many companies now require 24x7 reliability for their SAP systems.
The base for every SAP system is a solid infrastructure supporting it.
- Operating System
SUSE Linux Enterprise Server for SAP applications is the leading Linux platform for SAP HANA, SAP NetWeaver and SAP S/4HANA solutions. It helps reduce downtime with the flexibility to configure and deploy a choice of multiple HA/DR scenarios for SAP HANA and NetWeaver-based applications. System data monitoring enables proactive problem avoidance.
- Hardware
Most modern hardware platforms running SAP systems rely on Intel’s system architecture. The combination of SUSE Linux Enterprise Server on the latest generation Intel Xeon Scalable processors and Intel Optane DC persistent memory help deliver fast, innovative, and secure IT services and to provide resilient enterprise S/4HANA platforms. The Intel platform allows to monitor deep into the hardware, to gain insights in what the system is doing on a hardware level. Monitoring on a hardware level can help reduce downtime for SAP systems in several ways:
- Failure prediction
Identifying any hardware failure in advance allows customers to react early and in an scheduled manner. This reduces the risk of errors that usually occur on operations executed during system outages.
- Failure remediation
Having hardware metrics at hand when looking for the root cause of an issue can help speed up the analysis and therefore reduce the time until the system(s) return into operation. It can also reduce the reaction time, providing more precise information about problems. This holds especially true for enterprise customers that usually have operations outsourced to many service providers and do not control the environment directly.
This paper describes a monitoring solution for SAP systems that allows to use metrics to be analyzed in an SAP context.
2 Monitoring for SAP systems overview #
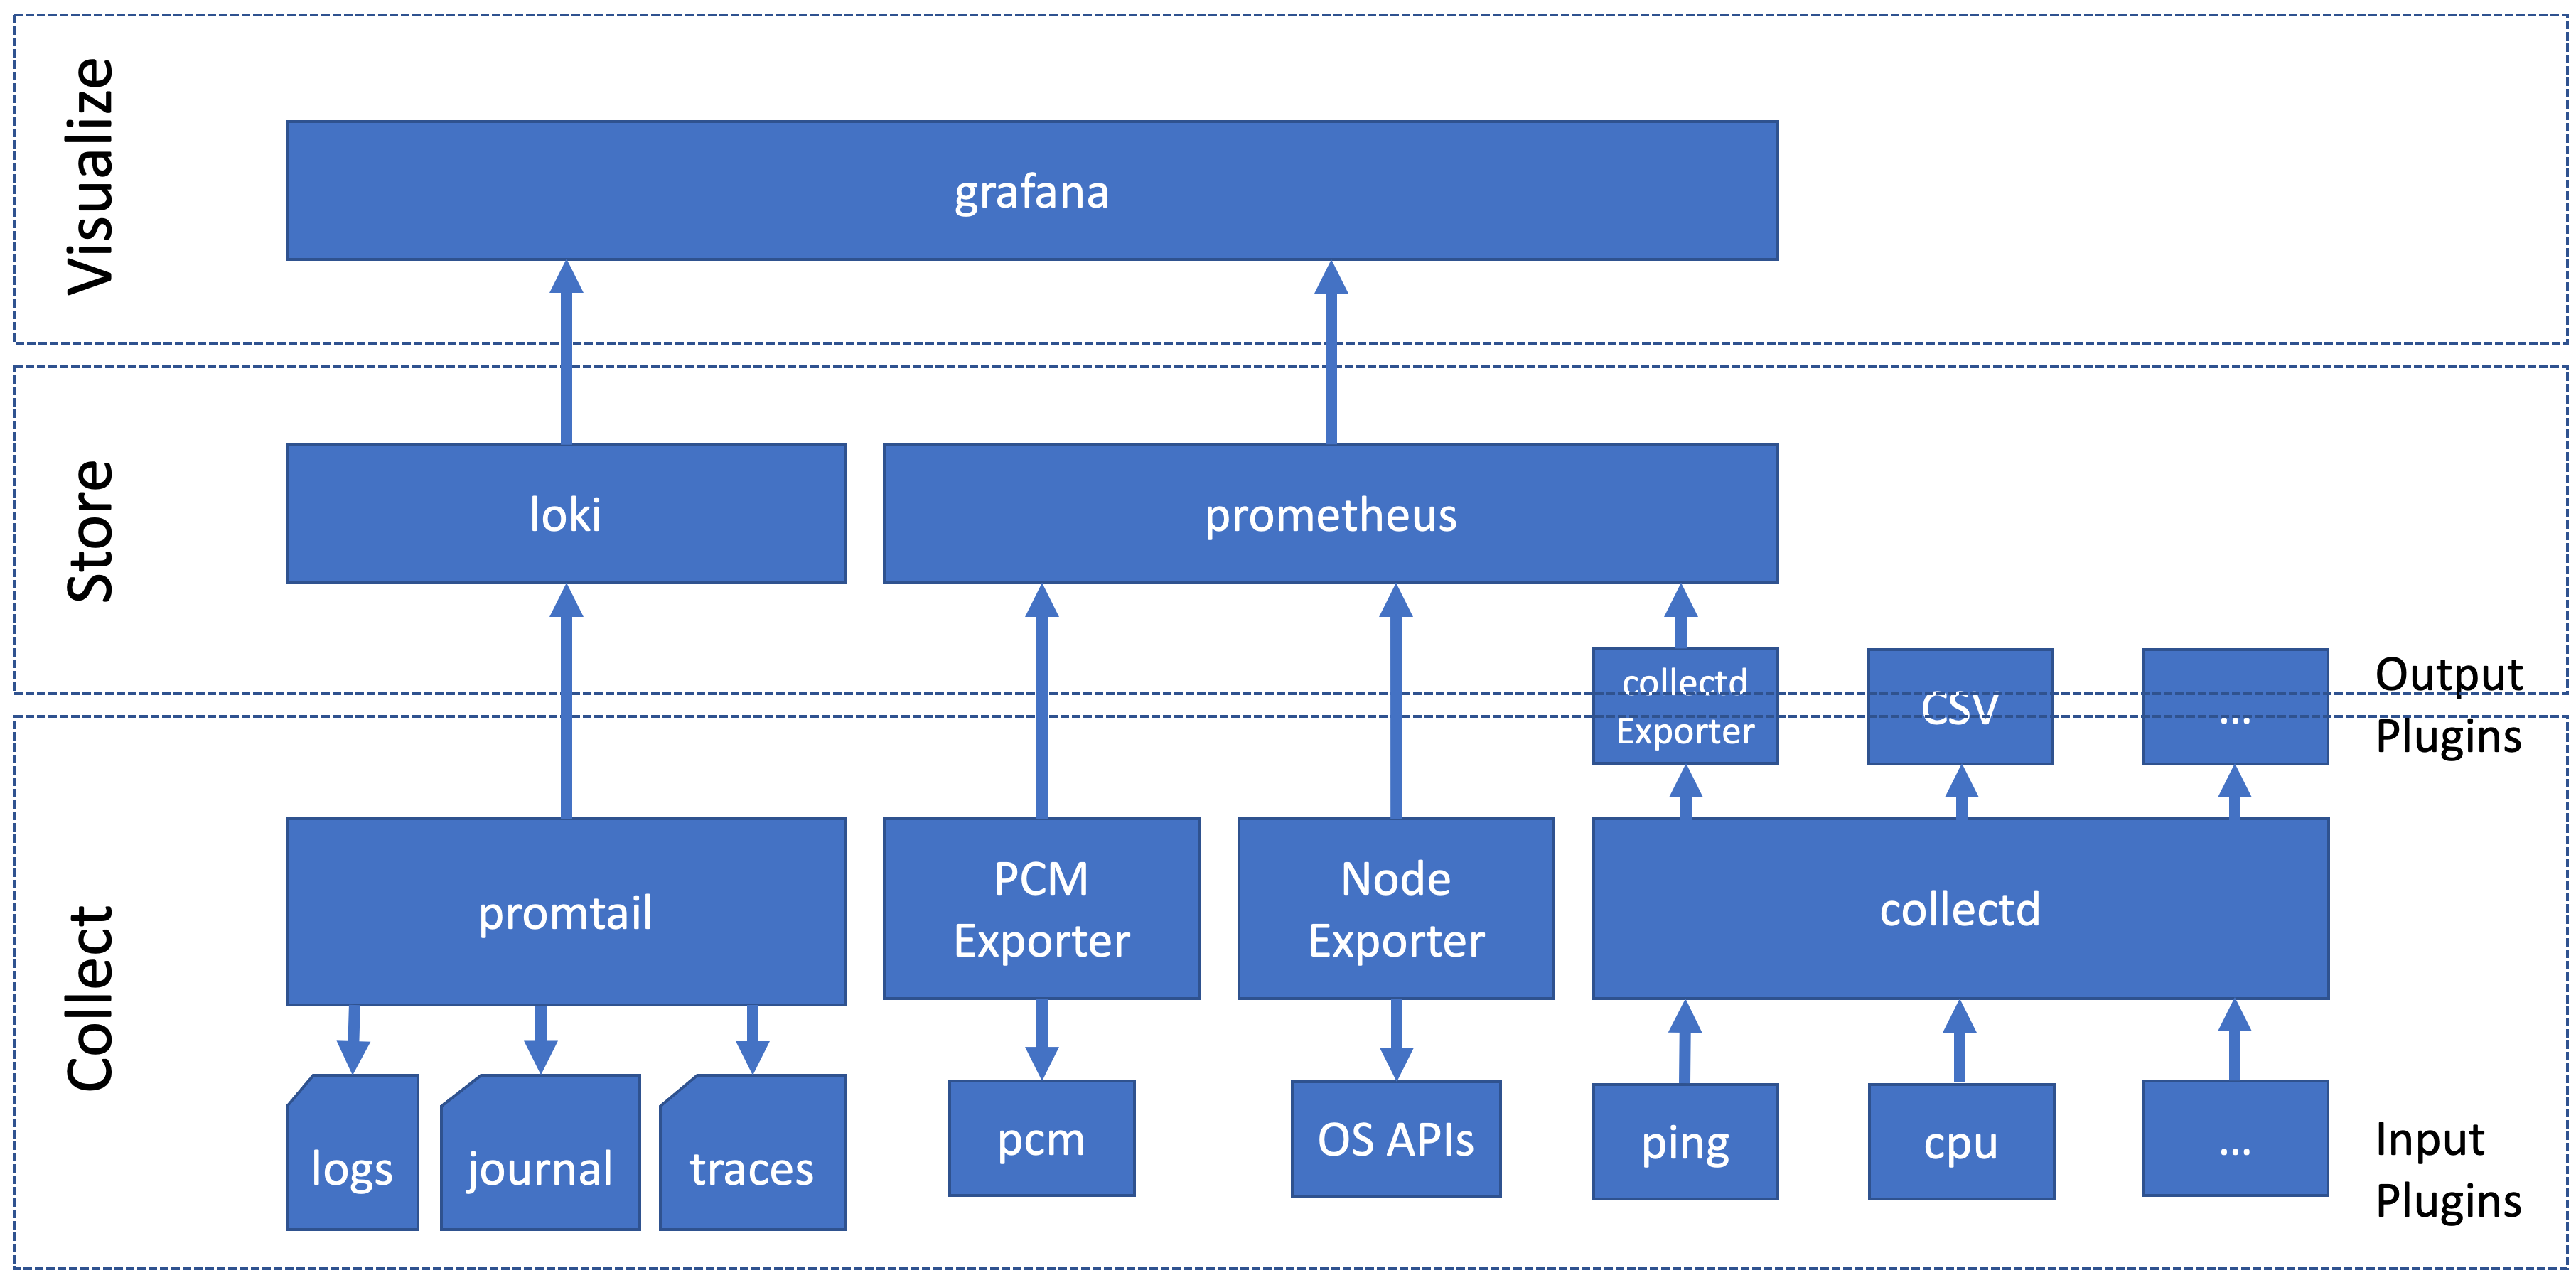
The solution presented in this document consists of several open source tools that are combined to collect logs and metrics from server systems, store them in a queryable database, and present them in a visual and easy-to-consume way. In the following sections, we will give an overview of the components and how they work together.
2.1 Components #
The monitoring solution proposed in this document consists of several components.
These components can be categorized by their use:
- Data Sources
Components that simplify the collection of monitoring data, providing measurements or collected data in a way that the data storage components can pick them up.
- Data Storage
Components that store the data coming from the data sources, and provide a mechanism to query the data.
- Data Visualization and Notification
Components that allow a visual representation (and notification) of the data stored in the data storage components, to make the (possibly aggregated) data easy to understand and analyze.
The following sections describe these components.
2.1.1 Data sources #
The data source components collect data from the operating system or hardware interfaces, and provide them to the data storage layer.
2.1.1.1 Processor Counter Monitor (PCM) #
Processor Counter Monitor (PCM) is an application programming interface (API) and a set of tools based on the API to monitor performance and energy metrics of Intel® Core™, Xeon®, Atom™ and Xeon Phi™ processors. PCM works on Linux, Windows, macOS X, FreeBSD and DragonFlyBSD operating systems.
2.1.1.2 collectd - System information collection daemon #
collectd is a small daemon which collects system information periodically and provides mechanisms to store and monitor the values in a variety of ways.
2.1.1.3 Prometheus Node Exporter #
The Prometheus Node Exporter is an exporter for hardware and OS metrics exposed by *NIX kernels. It is written in Go with pluggable metric collectors.
2.1.1.4 Prometheus IPMI Exporter #
The Prometheus IPMI Exporter supports both
the regular /metrics endpoint for Prometheus, exposing metrics from the host that the exporter is running on,
and an /ipmi endpoint that supports IPMI over RMCP.
One exporter instance running on one host can be used to monitor a large number of IPMI interfaces by passing the target parameter to a scrape.
2.1.1.5 Promtail #
Promtail is a Loki agent responsible for shipping the contents of local logs to a Loki instance. It is usually deployed to every machine that needed to be monitored.
2.1.2 Data collection #
On the data collection layer, we use two tools, covering different kinds of data: metrics and logs.
2.1.2.1 Prometheus #
Prometheus is an open source systems monitoring and alerting toolkit. It is storing time series data like metrics locally and runs rules over this data to aggregate and record new time series from existing data. Prometheus it also able to generate alerts. The project has a very active developer and user community. It is now a stand-alone open source project and maintained independently of any company. This makes it very attractive for SUSE as open source company and fits into our culture. To emphasize this, and to clarify the project’s governance structure, Prometheus joined the Cloud Native Computing Foundation 5 years ago (2016). Prometheus works well for recording any purely numeric time series.
Prometheus is designed for reliability. It is the system to go to during an outage as it allows you to quickly analyze a situation. Each Prometheus server is a stand-alone server, not depending on network storage or other remote services. You can rely on it when other parts of your infrastructure are broken, and you do not need to set up extensive infrastructure to use it.
2.1.2.2 Loki #
Loki is a log aggregation system, inspired by Prometheus and designed to be cost effective and easy to operate. Unlike other logging systems, Loki is built around the idea of only indexing a set of metadata (labels) for logs and leaving the original log message unindexed. Log data itself is then compressed and stored in chunks in object stores, for example locally on the file system. A small index and highly compressed chunks simplify the operation and significantly lower the cost of Loki.
2.1.3 Data visualization and notification #
With the wealth of data collected in the previous steps, tooling is needed to make the data accessible. Through aggregation and visualization data becomes meaningful and consumable information.
2.1.3.1 Grafana #
Grafana is an open source visualization and analytics platform. Grafana’s plug-in architecture allows interaction with a variety of data sources without creating data copies. Its graphical browser-based user interface visualizes the data through highly customizable views, providing an interactive diagnostic workspace.
Grafana can display metrics data from Prometheus and log data from Loki side-by-side, correlating events from log files with metrics. This can provide helpful insights when trying to identify the cause for an issue. Also, Grafana can trigger alerts based on metrics or log entries, and thus help identify potential issues early.
2.1.3.2 Alertmanager #
The Alertmanager handles alerts sent by client applications such as the Prometheus or Loki server. It takes care of deduplicating, grouping, and routing them to the correct receiver integration such as email or PagerDuty. It also takes care of silencing and inhibition of alerts.
3 Implementing monitoring for SAP systems #
The following sections show how to set up a monitoring solution based on the tools that have been introduced in the solution overview.
3.1 Node exporter #
The prometheus-node_exporter can be installed directly from the SUSE repository.
It is part of SUSE Linux Enterprise Server and all derived products.
# zypper -n in golang-github-prometheus-node_exporter
Start and enable the node exporter for automatic start at system boot.
# systemctl enable --now prometheus-node_exporter
To check if the exporter is running, you can use the following commands:
# systemctl status prometheus-node_exporter
# ss -tulpan |grep exporter
Configure the node exporter depending on your needs. Arguments to be passed to prometheus-node_exporter can be provided in the configuration file /etc/sysconfig/prometheus-node_exporter, for example to modify which metrics the node_exporter will collect and expose.
...
ARGS="--collector.systemd --no-collector.mdadm --collector.ksmd --no-collector.rapl --collector.meminfo_numa --no-collector.zfs --no-collector.udp_queues --no-collector.softnet --no-collector.sockstat --no-collector.nfsd --no-collector.netdev --no-collector.infiniband --no-collector.arp"
...
By default, the node exporter is listening for incoming connections on port 9100.
3.2 collectd #
The collectd packages can be installed from the SUSE repositories as well. For the example at hand, we have used a newer version from the openSUSE repository.
Create a file /etc/zypp/repos.d/server_monitoring.repo and add the following content to it:
[server_monitoring]
name=Server Monitoring Software (SLE_15_SP3)
type=rpm-md
baseurl=https://download.opensuse.org/repositories/server:/monitoring/SLE_15_SP3/
gpgcheck=1
gpgkey=https://download.opensuse.org/repositories/server:/monitoring/SLE_15_SP3/repodata/repomd.xml.key
enabled=1
Afterward refresh the repository metadata and install collectd and its plugins.
# zypper ref
# zypper in collectd collectd-plugins-all
Now the collectd must be adapted to collect the information you want to get and export it in the format you need.
For example, when looking for network latency, use the ping plugin and expose the data in a Prometheus format.
...
LoadPlugin ping
...
<Plugin ping>
        Host "10.162.63.254"
        Interval 1.0
        Timeout 0.9
        TTL 255
#       SourceAddress "1.2.3.4"
#       AddressFamily "any"
        Device "eth0"
        MaxMissed -1
</Plugin>
...
LoadPlugin write_prometheus
...
<Plugin write_prometheus>
        Port "9103"
</Plugin>
...
Uncomment the LoadPlugin line and check the <Plugin ping> section in the file.
Modify the systemd unit that collectd works as expected. First, create a copy from the system-provided service file.
# cp /usr/lib/systemd/system/collectd.service /etc/systemd/system/collectd.service
Second, adapt this local copy.
Add the required CapabilityBoundingSet parameters in our local copy /etc/systemd/system/collectd.service.
...
# Here's a (incomplete) list of the plugins known capability requirements:
#   ping            CAP_NET_RAW
CapabilityBoundingSet=CAP_NET_RAW
...
Activate the changes and start the collectd function.
# systemctl daemon-reload
# systemctl enable --now collectd
All collectd metrics are accessible at port 9103.
With a quick test, you can see if the metrics can be scraped.
# curl localhost:9103/metrics
3.3 Processor Counter Monitor (PCM) #
Processor Counter Monitor (PCM) can be installed from its GitHub project pages.
Make sure the required tools are installed for building.
# zypper in -y git cmake gcc-c++
Clone the Git repository and build the tool using the following commands.
# git clone https://github.com/opcm/pcm.git
# cd pcm
# mkdir build
# cd build
# cmake ..
# cmake --build .
# cd bin
Starting with SLES4SAP SP5 the PCM package is included.
To start PCM on the observed host, first start a new screen session, and then start PCM.[1]
# screen -S pcm
# ./pcm-sensor-server -d
The PCM sensor server binary pcm-sensor-server has been started in a screen session which can be detached (type Ctrl+a d).
This lets the PCM sensor server continue running in the background.
3.3.1 PCM Systemd Service File #
A more convenient and secure way to start pcm-sensor-server is using a systemd service. To do so a service unit file has to be created under /etc/systemd/system/:
cp pcm-sensor-server /usr/local/bin/
# cat /etc/systemd/system/pcm.service
[Unit]
Description=
Documentation=/usr/share/doc/PCM
[Service]
Type=simple
Restart=no
ExecStart=/usr/local/bin/pcm-sensor-server
[Install]
WantedBy=multi-user.target
The "systemd" needs to be informed about the new unit:
# systemctl daemon-reload
And finally enabled and started:
# systemctl enable --now pcm.service
The PCM metrics can be queried from port 9738.
3.4 Prometheus IPMI Exporter #
The IPMI exporter can be used to scrape information like temperature, power supply information and fan information.
Create a directory, download and extract the IPMI exporter.
# mkdir ipmi_exporter
# cd ipmi_exporter
# curl -OL https://github.com/prometheus-community/ipmi_exporter/releases/download/v1.4.0/ipmi_exporter-1.4.0.linux-amd64.tar.gz
# tar xzvf ipmi_exporter-1.4.0.linux-amd64.tar.gz
We have been using the version 1.4.0 of the IPMI exporter. For a different release, the URL used in the curl command above needs to be adapted.
Current releases can be found at the IPMI exporter GitHub repository.
Some additional packages are required and need to be installed.
# zypper in freeipmi libipmimonitoring6 monitoring-plugins-ipmi-sensor1
To start the IPMI exporter on the observed host, first start a new screen session, and then start the exporter.[2]
screen -S ipmi
# cd ipmi_exporter-1.4.0.linux-amd64
# ./ipmi_exporter
The IPMI exporter binary ipmi_exporter has been started in a screen session which can be detached (type Ctrl+a d).
This lets the exporter continue running in the background.
3.4.1 IPMI Exporter Systemd Service File #
A more convenient and secure way to start the IPMI exporter is using a systemd service. To do so a service unit file has to be created under /etc/systemd/system/:
cp ipmi_exporter-1.4.0.linux-amd64 /usr/local/bin/
# cat /etc/systemd/system/ipmi-exporter.service
[Unit]
Description=IPMI exporter
Documentation=
[Service]
Type=simple
Restart=no
ExecStart=/usr/local/bin/ipmi_exporter-1.4.0.linux-amd64
[Install]
WantedBy=multi-user.target
The "systemd" needs to be informed about the new unit:
# systemctl daemon-reload
And finally enabled and started:
# systemctl enable --now ipmi-exporter.service
The metrics of the ipmi_exporter are accessible port 9290.
3.5 Prometheus Installation #
The Prometheus RPM packages can be found in the PackageHub repository.
This repository needs to be activated via the SUSEConnect command first.
PackageHub#
# SUSEConnect --product PackageHub/15.3/x86_64
Prometheus can then easily be installed using the zypper command:
# zypper ref
# zypper in golang-github-prometheus-prometheus
Prometheus Configuration#
There are at least two configuration files which are important:
Prometheus systemd options
/etc/sysconfig/prometheusPrometheus server configuration
/etc/prometheus/prometheus.yml
Systemd arguments#
In the /etc/sysconfig/prometheus we added the following arguments to extend the data retention,
the storage location and the enable the configuration reload via web api.
# vi /etc/sysconfig/prometheus

...
ARGS="--storage.tsdb.retention.time=90d --storage.tsdb.path /var/lib/prometheus/ --web.enable-lifecycle"
...
Prometheus storage#
The storage in this example has a dedicated storage volume. In case changing the storage location to a different one or after the installation of Prometheus you must take care for the filesystem permissions.
# ls -ld /var/lib/promethe*

drwx------ 9 prometheus prometheus 199 Nov 18 18:00 /var/lib/prometheus
Prometheus configuration prometheus.yml#
Edit the Prometheus configuration file /etc/prometheus/prometheus.yml to include the scrape job configurations you want to add.
In our example we have defined multiple job for different exporters. This would simplify the
Grafana dashboard creation later and the Prometheus Alertmanager rule definition.
  - job_name: node-export
    static_configs:
      - targets:
- monint1:9100 - job_name: intel-collectd
static_configs:
- targets:
- monint2:9103
- monint1:9103 - job_name: intel-pcm
scrape_interval: 2s
static_configs:
- targets:
- monint1:9738 - job_name: ipmi
scrape_interval: 1m
scrape_timeout: 30s
metrics_path: /metrics
scheme: http
static_configs:
- targets:
- monint1:9290
- monint2:9290Finally start and enable the Prometheus service:
# systemctl enable --now prometheus.service
Defining Prometheus rules are done in a separate file. The metrics defined in such a file will trigger an alert as soon as the condition is met.
3.5.1 Prometheus alerts #
Prometheus alerting is based on rules. Alerting rules allow you to define alert conditions based on Prometheus expression language. The Prometheus Alertmanager will then send notifications about firing alerts to an external service (receiver).
To activate alerting the Prometheus config needs the following components:
alerting:
  alertmanagers:
  - static_configs:
    - targets:
        - alertmanager:9093

rule_files:
  - /etc/prometheus/rules.yml
Depending on the rule_files path the rules have to be store in the given file. The example rule below will trigger an alert if an exporter (see prometheus.yaml - targets)
is not up. The labels instance and job gives more information about hostnames and type of exporter.
groups:

  - alert: exporter-down
    expr: up{job=~".+"} == 0
    for: 1m
    labels:
    annotations:
      title: Exporter {{ $labels.instance }} is down
      description: Failed to scrape {{ $labels.job }} on {{ $labels.instance }} for more than 1 minutes. Exporter seams down.
3.6 Loki #
The Loki RPM packages can be found in the PackageHub repository. The repository needs to be activated via the SUSEConnect command first, unless you have activated it in the previous steps already.
# SUSEConnect --product PackageHub/15.3/x86_64
Loki can then be installed via the zypper command:
# zypper in loki
Edit the Loki configuration file /etc/loki/loki.yaml and change the following lines:
chunk_store_config:
  max_look_back_period: 240h

table_manager:
  retention_deletes_enabled: true
  retention_period: 240h
Start and enable Loki service:
# systemctl enable --now loki.service
3.6.1 Loki alerts #
Loki supports Prometheus-compatible alerting rules. They are following the same syntax, except they use LogQL for their expressions. To activate alerting the loki config needs a component called ruler:
# Loki defaults to running in multi-tenant mode.
# Multi-tenant mode is set in the configuration with:
# auth_enabled: false
# When configured with "auth_enabled: false", Loki uses a single tenant.
# The single tenant ID will be the string fake.
auth_enabled: false
[...]

ruler:
  wal:
    dir: /loki/ruler-wal
  storage:
    type: local
    local:
      directory: /etc/loki/rules
  rule_path: /tmp/loki-rules-scratch
  alertmanager_url: http://alertmanager:9093
  enable_alertmanager_v2: true
Depending on the given directory path in our example above, the rule file has to be stored under:
/etc/loki/rules/fake/rules.yml
We are using auth_enabled: false and therefore the default tenant ID is fake which needs to be add
to the path the rules are stored.
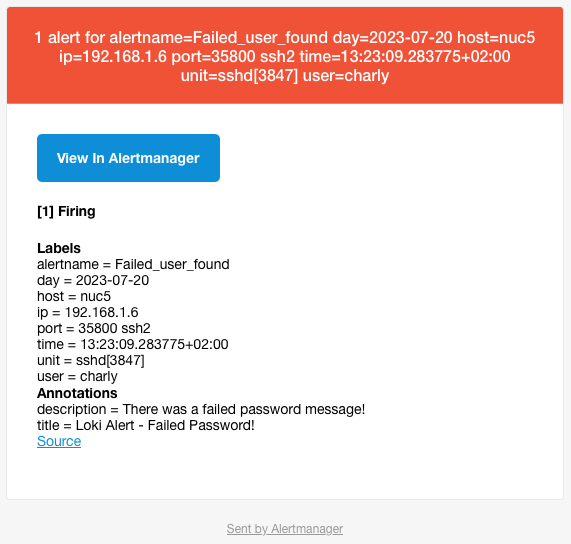
The example rule below will trigger a mail (vial alertmanager configuration) if the password failed after accessing via ssh. The log line looks like the following:
2023-07-19T10:41:38.076428+02:00 nuc5 sshd[16723]: Failed password for invalid user charly from 192.168.1.201 port 58831 ssh2
groups:
    - name: accessLog
      rules:
        - alert: Failed_user_found
          expr: 'sum(
                   count_over_time(
                     {filename="/var/log/messages" }
                       |= "Failed password for"
                       | pattern `<day>T<time> <host> <unit>: <_> <_> <_> <_> <_> <user> <_> <ip> <_> <port>`
                       [10m]
                   )
                 ) by (day, time, host, unit, user, ip, port)'
          for: 1m
          labels:
            alertname: AccessFailed
          annotations:
            description: "There was a failed password message!"
title: "Loki Alert - Failed Password!"3.7 Promtail (Loki agent) #
The Promtail RPM packages can be found in the PackageHub repository.
The repository has to be activated via the SUSEConnect command first, unless you have activated it in the previous steps already.
# SUSEConnect --product PackageHub/15.3/x86_64
Promtail can then be installed via the zypper command.
# zypper in promtail
Edit the Promtail configuration file /etc/loki/promtail.yaml to include the scrape configurations you want to add.
  - job_name: journal
    journal:
      max_age: 12h
      labels:
        job: systemd-journal
    relabel_configs:
      - source_labels: ['__journal__systemd_unit']
target_label: 'unit'If you are using systemd-journal, do not forget to add the loki user to the systemd-journal group: usermod -G systemd-journal -a loki
  - job_name: HANA
    static_configs:
    - targets:
        - localhost
      labels:
        job: hana-trace
        host: monint1
__path__: /usr/sap/IN1/HDB11/monint1/trace/*_alert_monint1.trcIf you are using SAP logs like the HANA traces, do not forget to add the loki user to the sapsys group: usermod -G sapsys -a loki
Start and enable the Promtail service:
# systemctl enable --now promtail.service
3.8 Grafana #
The Grafana RPM packages can be found in the PackageHub repository.
The repository has to be activated via the SUSEConnect command first, unless you have activated it in the previous steps already.
# SUSEConnect --product PackageHub/15.3/x86_64
Grafana can then be installed via zypper command:
# zypper in grafana
Start and enable the Grafana server service:
# systemctl enable --now grafana-server.service
Now connect from a browser to your Grafana instance and log in:
3.8.1 Grafana data sources #
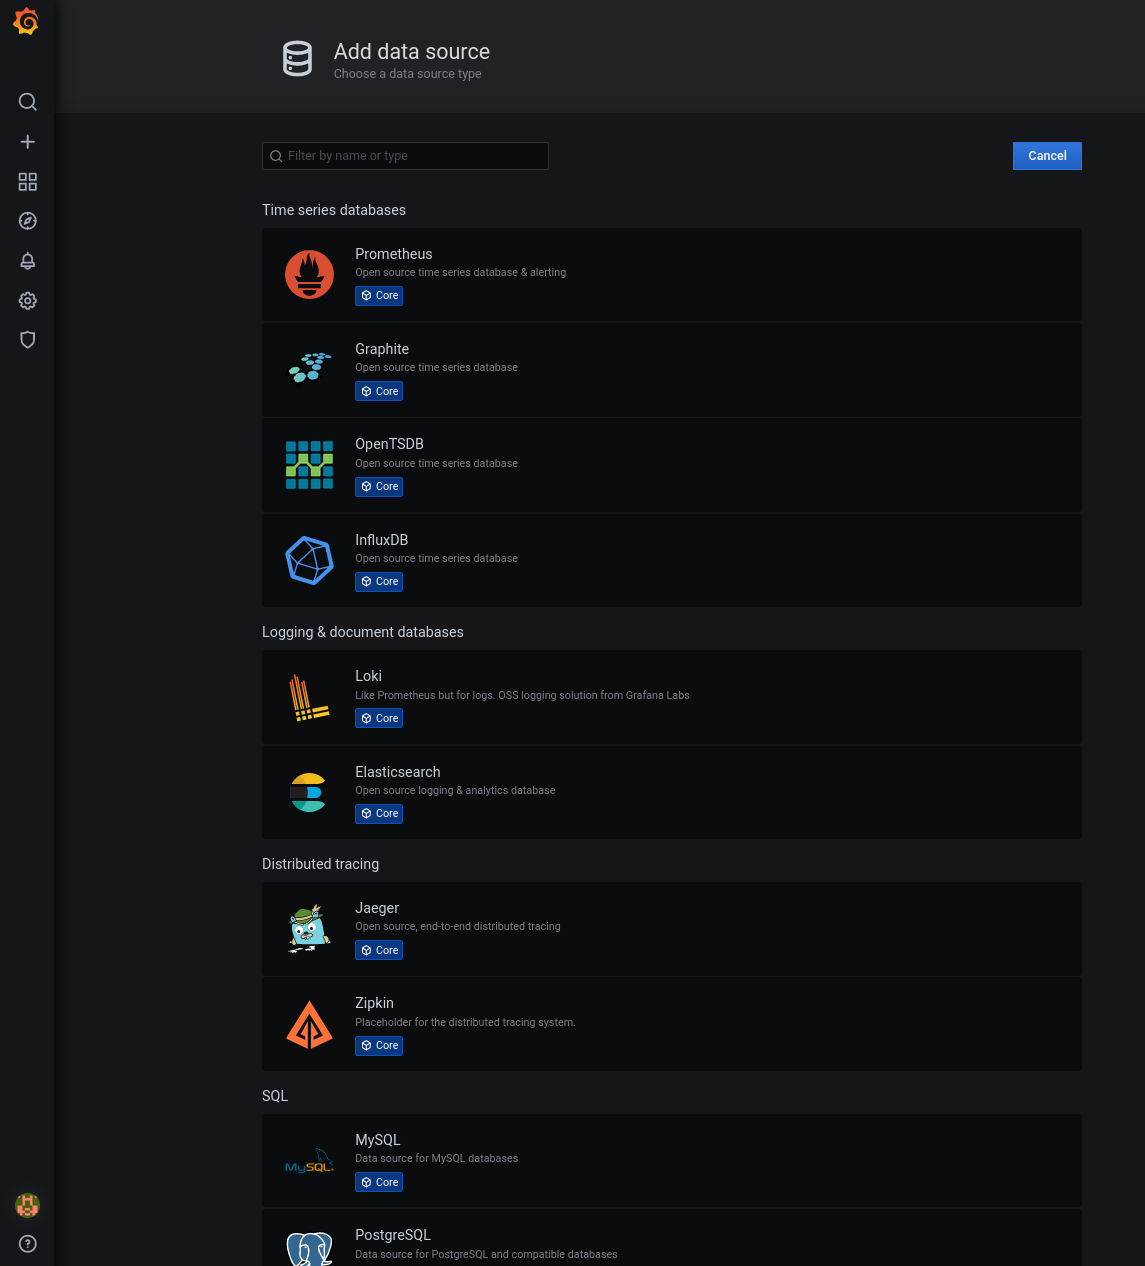
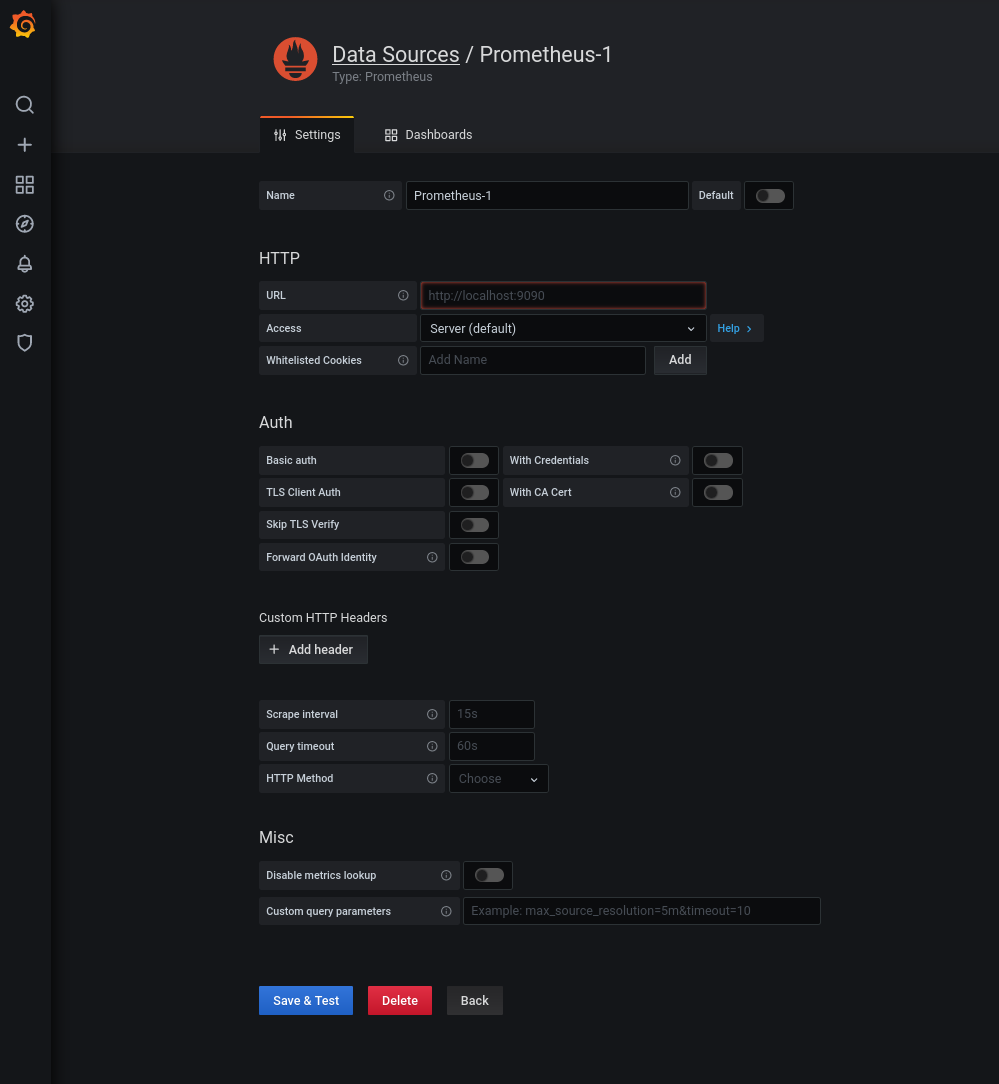
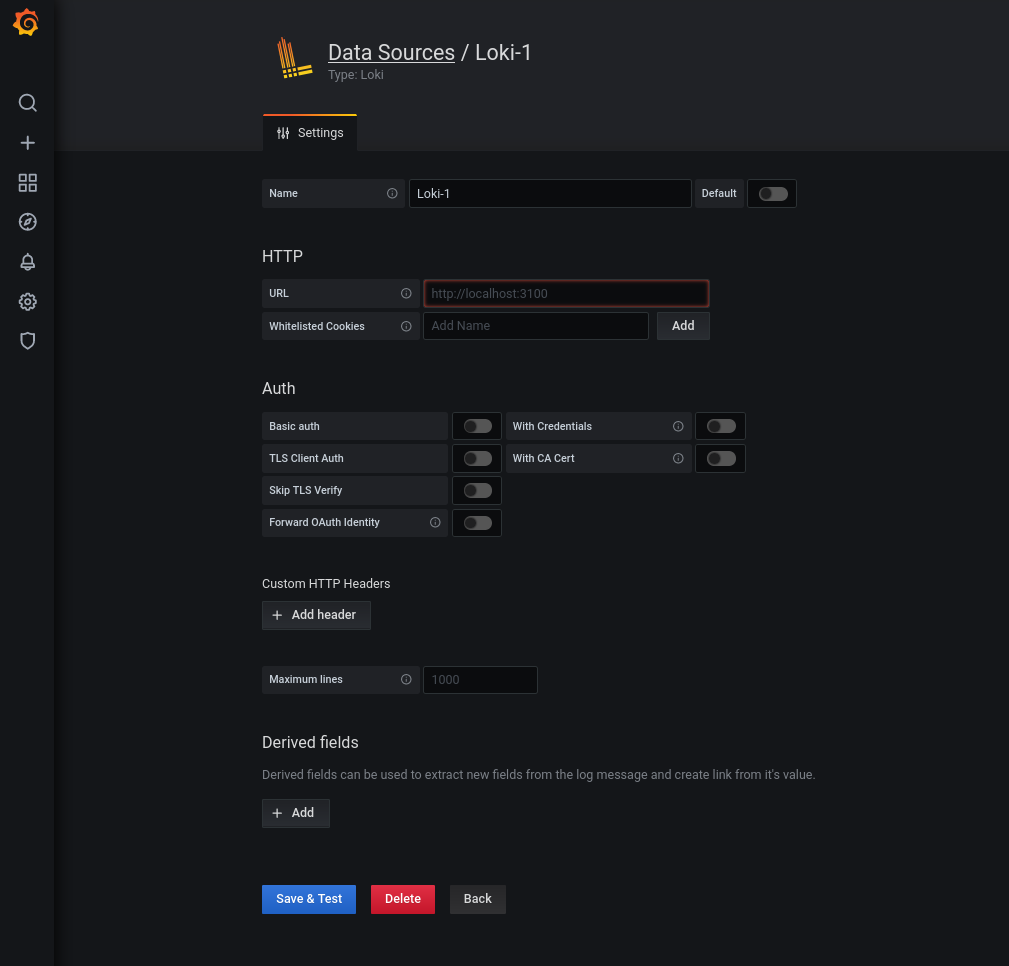
After the login, the data source must be added. On the right hand there is a wheel where a new data source can be added.
Add a data source for the Prometheus service.
Also add a data source for Loki.
Now Grafana can access both the metrics stored in Prometheus and the log data collected by Loki, to visualize them.
3.8.2 Grafana dashboards #
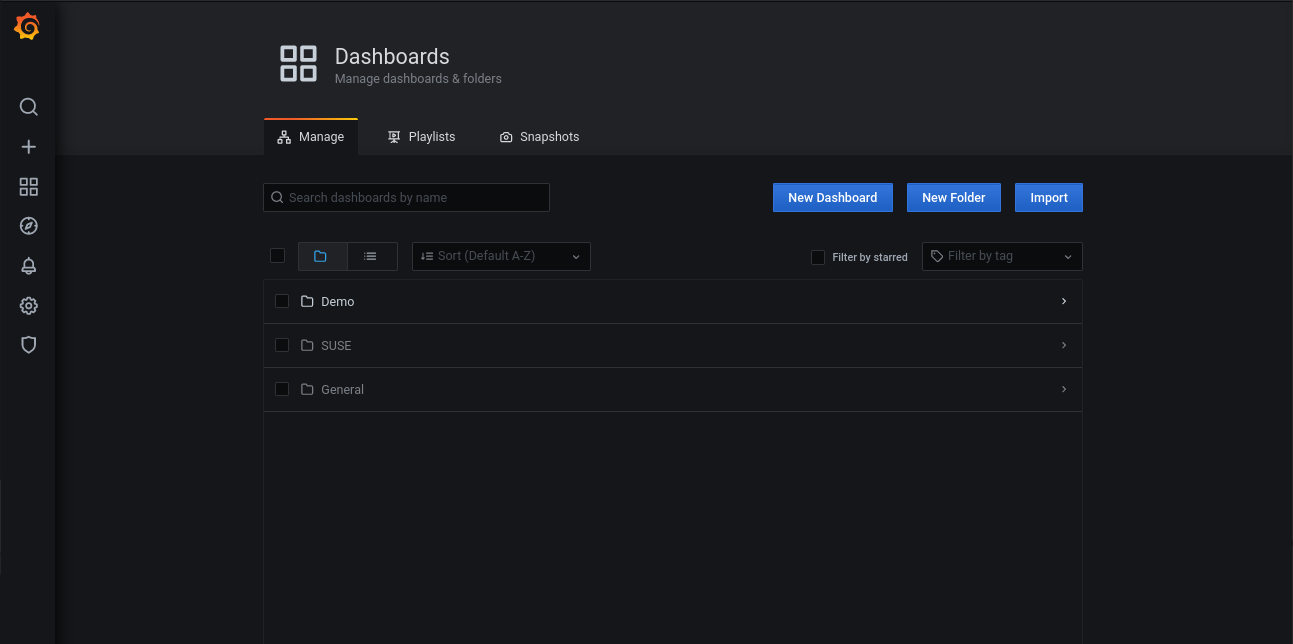
Dashboards are how Grafana presents information to the user. Prepared dashboards can be downloaded from https://grafana.com/dashboards, or imported using the Grafana ID.
The dashboards can also be created from scratch. Information from all data sources can be merged into one dashboard.
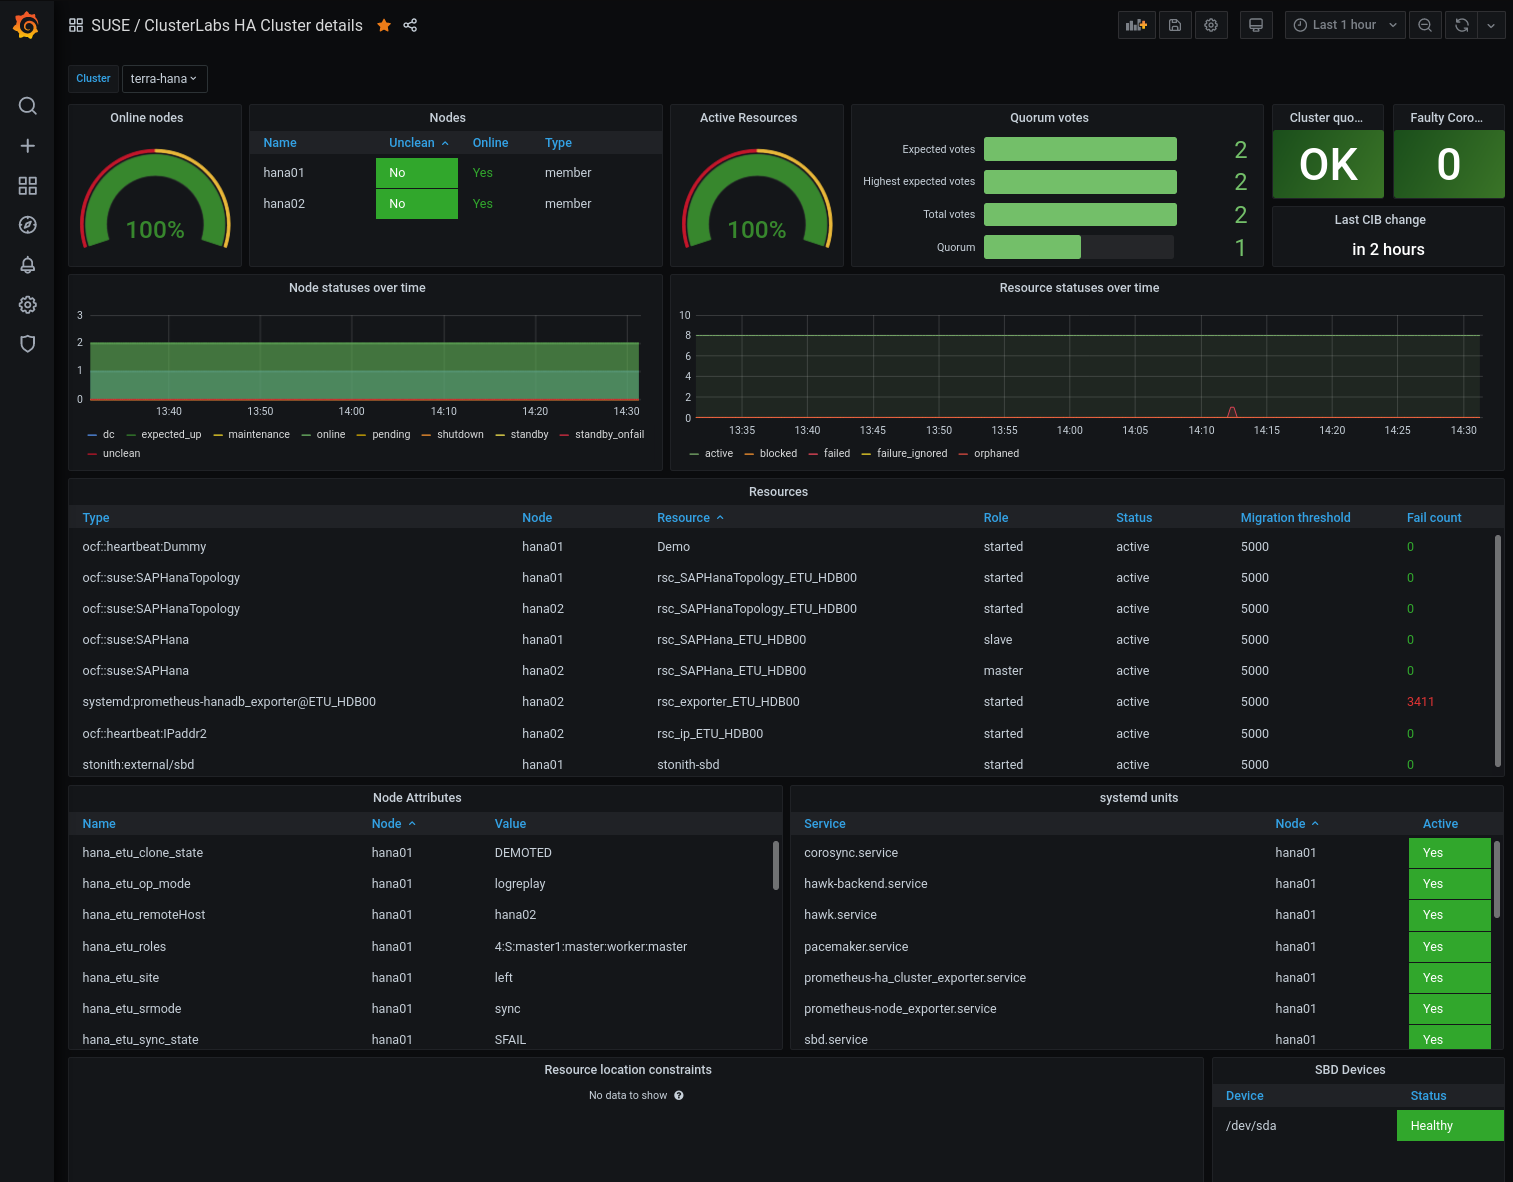
3.8.3 Putting it all together #
The picture below shows a dashboard displaying detailed information about the SAP HANA cluster, orchestrated by pacemaker.
3.9 Alertmanager #
The Alertmanager package can be found in the PackageHub repository. The repository needs to be activated via the SUSEConnect command first, unless you have activated it in the previous steps already.
SUSEConnect --product PackageHub/15.3/x86_64
Alertmanager can then be installed via the zypper command:
zypper in golang-github-prometheus-alertmanager
Notification can be done to different receivers. A receivers can be simply be an email, chat systems, webhooks and more.
(for a complete list please take a look at the Alertmanager documentation)
The example configuration below is using email for notification (receiver).
Edit the Alertmanager configuration file /etc/alertmanager/config.yml like below:
global:
  resolve_timeout: 5m
  smtp_smarthost: '<mailserver>'
  smtp_from: '<mail-address>'
  smtp_auth_username: '<username>'
  smtp_auth_password: '<passwd>'
  smtp_require_tls: true

route:
  group_by: ['...']
  group_wait: 10s
  group_interval: 5m
  repeat_interval: 4h
  receiver: 'email'

receivers:
  - name: 'email'
    email_configs:
      - send_resolved: true
        to: '<target mail-address>'
        from: 'mail-address>'
        headers:
          From: <mail-address>
          Subject: '{{ template "email.default.subject" . }}'
          html: '{{ template "email.default.html" . }}'
Start and enable the alertmanager service:
systemctl enable --now prometheus-alertmanager.service
4 Practical use cases #
The following sections describe some practical use cases of the tooling set up in the previous chapter.
4.1 CPU #
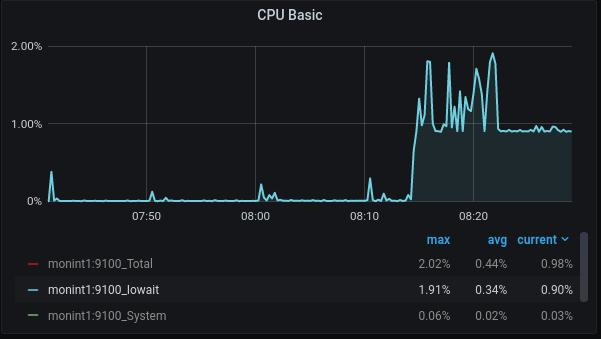
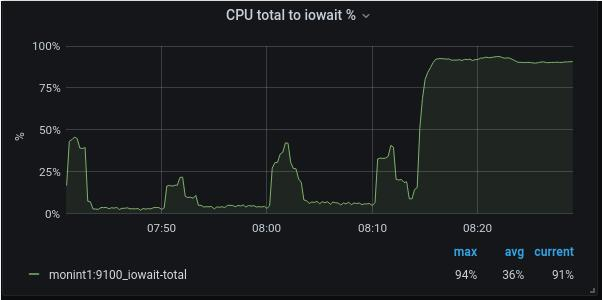
I/O performance is very important on SAP systems. By looking for the iowait metric in command line tools like top or sar, you can only see a single
value without any relation. The picture below is showing such a value in a certain timeframe.
An iowait of 2% might not show any problem at first glance. But if you look at iowait as part of the whole CPU load, the picture is completely different to what you saw before. The reason is that the total CPU load in the example is only a little higher then iowait.
In our example, you now see an iowait value of about 90% of the total CPU load.
To get the percent of iowait of the total CPU load, use the following formula:
100 / (1-CPU_IDLE) * CPU_IOWAIT
The metrics used are:
node_cpu_seconds_total{mode="idle"}node_cpu_seconds_total{mode="iowait"}- Conclusion
A high iowait in relation to the overall CPU load is indicating a low throughput. As a result, the IO performance might be very bad. An alert could be triggert by setting a proper threshold if the iowait is going through a certain value.
4.2 Memory #
Memory performance in modern servers is not only influenced by its speed, but mainly by the way it is accessed. The Non-Uniform Memory Access (NUMA) architecture used in modern systems is a way of building very large multi-processor systems so that every CPU (that is a group of CPU cores) has a certain amount of memory directly attached to it. Multiple CPUs (multiple groups of processors cores) are then connected together using special bus systems (for example UPI) to provide processor data coherency. Memory that is "local" to a CPU can be accessed with maximum performance and minimal latency. If a process running on a CPU core needs to access memory that is attached to another CPU, it can do so. However, this comes at the price of added latency, because it needs to go through the bus system connecting the CPUs.
4.2.1 Non-Uniform Memory Access (NUMA) example #
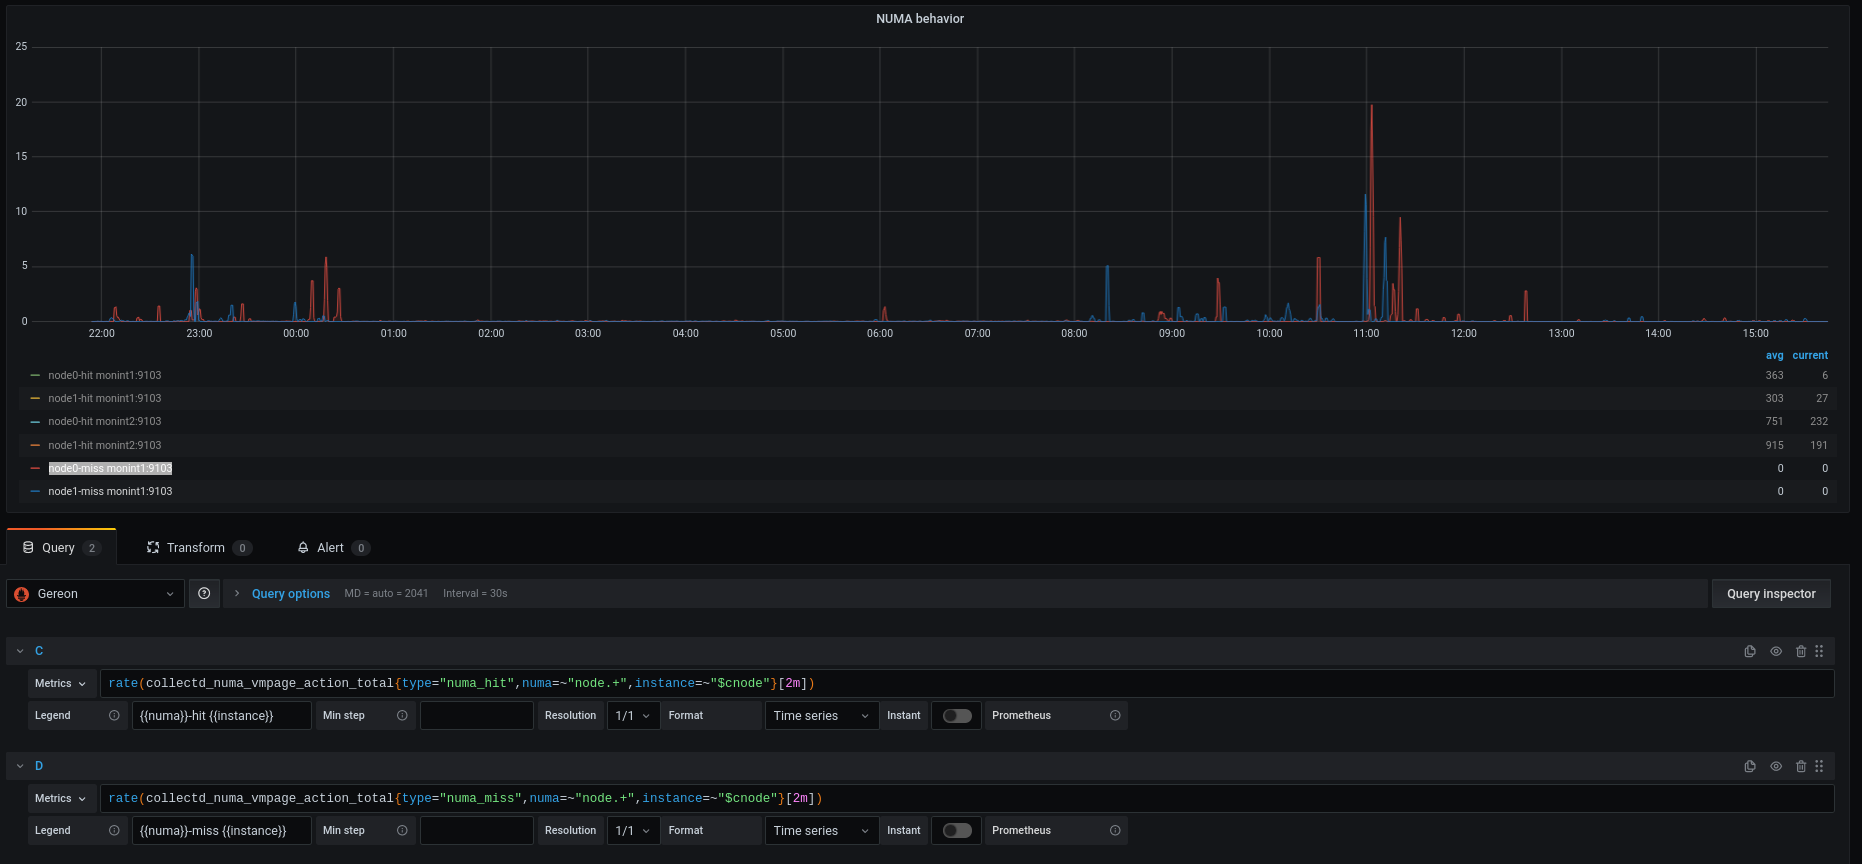
There are two exporters at hand which can help to provide the metrics data. The node_exporter has an option --collector.meminfo_numa
which must be enabled in the configuration file /etc/sysconfig/prometheus-node_exporter. In the example below the collectd plugin numa was used.
We are focusing on two metrics:
numa_hit: A process wanted to allocate memory attached to a certain NUMA node (mostly the one it is running on), and succeeded.
numa_miss: A process wanted to allocate memory attached to a certain NUMA node, but ended up with memory attached to a different NUMA node.
The metric used is collectd_numa_vmpage_action_total.
- Conclusion
If a process attempts to get a page from its local node, but this node is out of free pages, the
numa_missof that node will be incremented (indicating that the node is out of memory) and another node will accommodate the process’s request. To know which nodes are "lending memory" to the out-of-memory node, you need to look atnuma_foreign. Having a high value fornuma_foreignfor a particular node indicates that this node’s memory is underutilized so the node is frequently accommodating memory allocation requests that failed on other nodes. A high amount ofnuma_missindicates a performance degradation for memory based applications like SAP HANA.
4.2.2 Memory module observation #
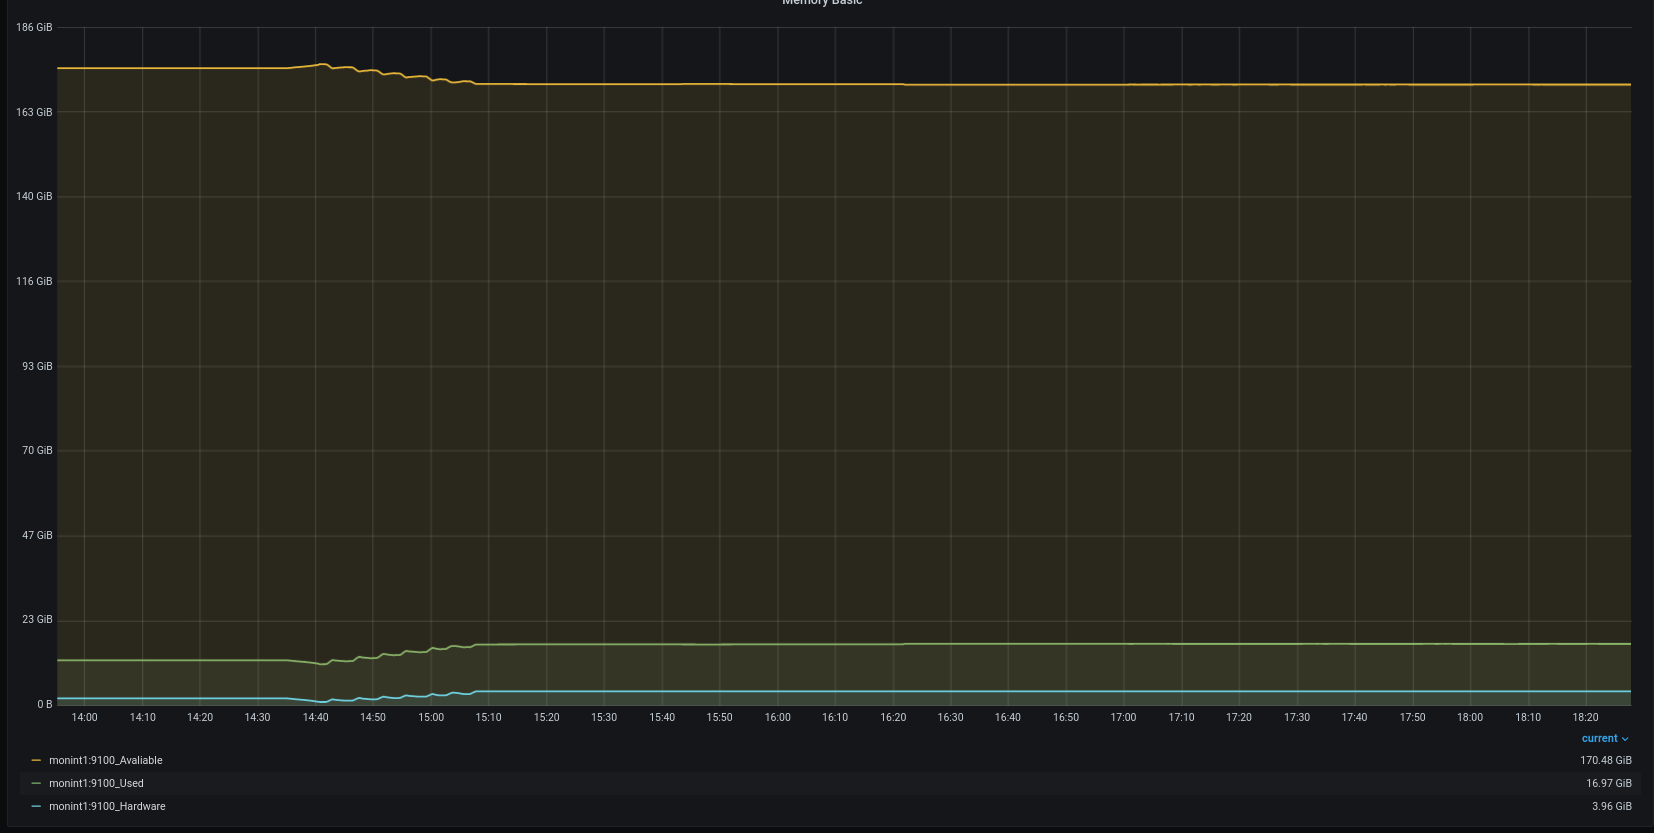
Today more and more application data are hold in the main memory. Examples are Dynamic random access memory (DRAM) or Persistent memory PMEM. The observation of this component became quite important. This is because systems with a high amount of main memory, for example multiple terabytes, are populated with a corresponding number of modules. The example below represents a memory hardware failure which was not effecting the system with a downtime, but a maintenance window should now be scheduled to replace faulty modules.
The example shows a reduction of available space at the same time as the hardware count is increasing.
The metric used here is node_memory_HardwareCorrupted_bytes.
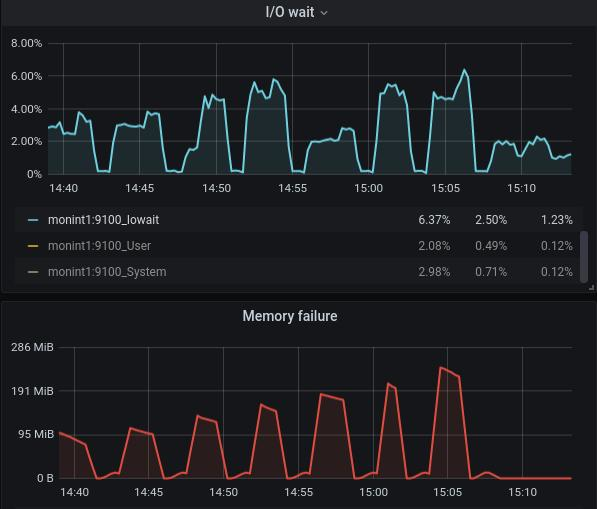
Memory errors (correctable) also correlate with the CPU performance as shown in the example below. For each of the captured memory failure event, an increase of the CPU I/O is shown.
- Conclusion
The risk that one of the modules becomes faulty increases with the total amount of modules per system. The observation of memory correctable errors and uncorrectable errors is essential. Features like Intel RAS can help to avoid application downtime if the failure could be handled by the hardware.
4.3 Network #
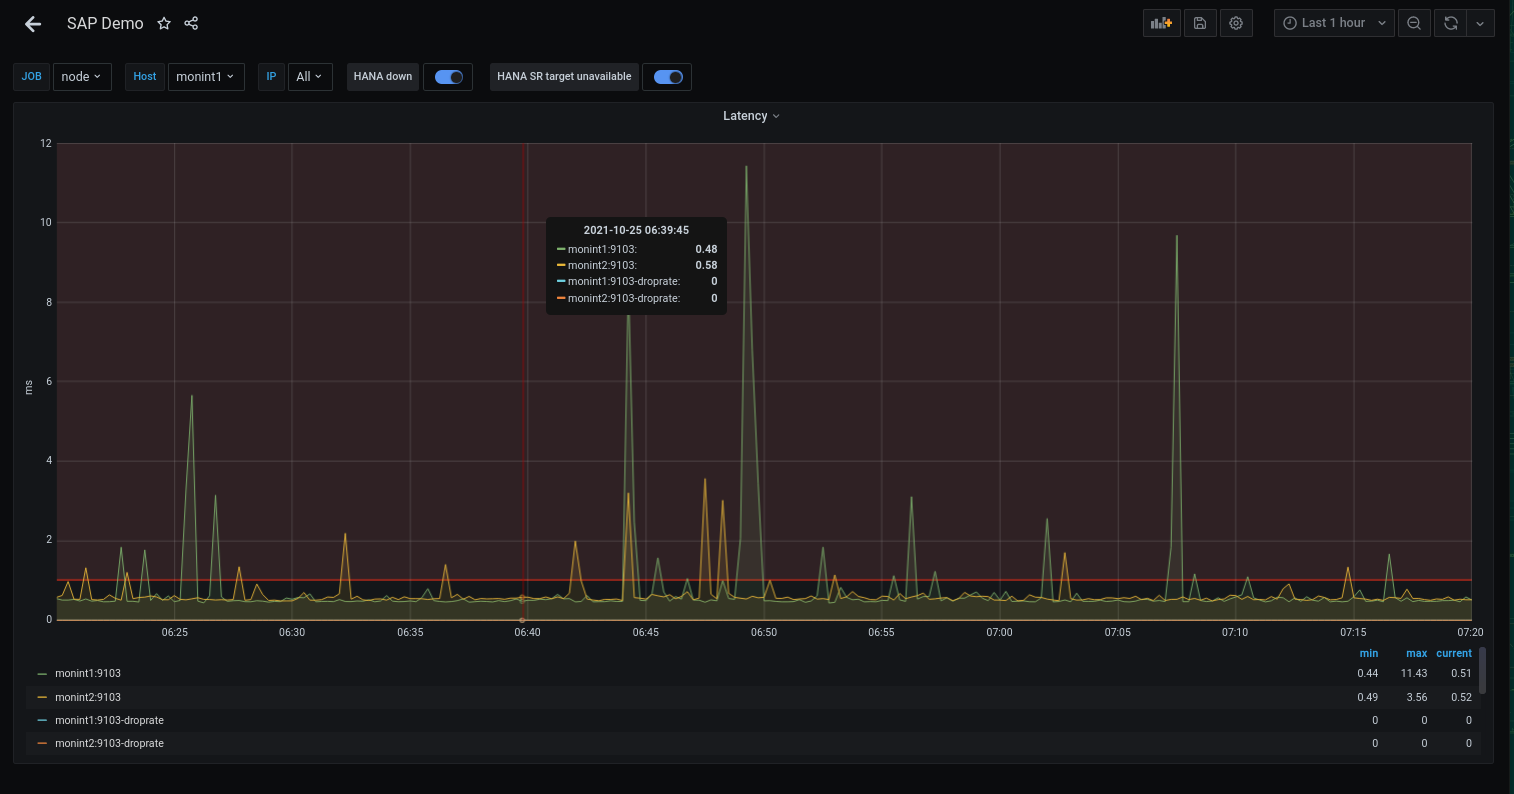
Beside the fact that the network work must be available and the throughput must be fit, the network latency is very important, too.
For cluster setups and applications which are working in a sync mode, like SAP HANA with HANA system replication, the network latency becomes even more relevant.
The collectd plugin ping can help here to observe the network latency over time.
The Grafana dashboard below visualizes the network latency over the past one hour.
The red line is a threshold which can be used to trigger an alert.
The metrics used here are collectd_ping and collectd_ping_ping_droprate.
- Conclusion
A high value or peak over a long period (multiple time stamps) indicates network response time issues at least to the ping destination. An increasing amount of the
ping_dropratepoints to some issues with the ping destination in regards to responding to the ping request.
4.4 Storage #
4.4.1 Storage capacity #
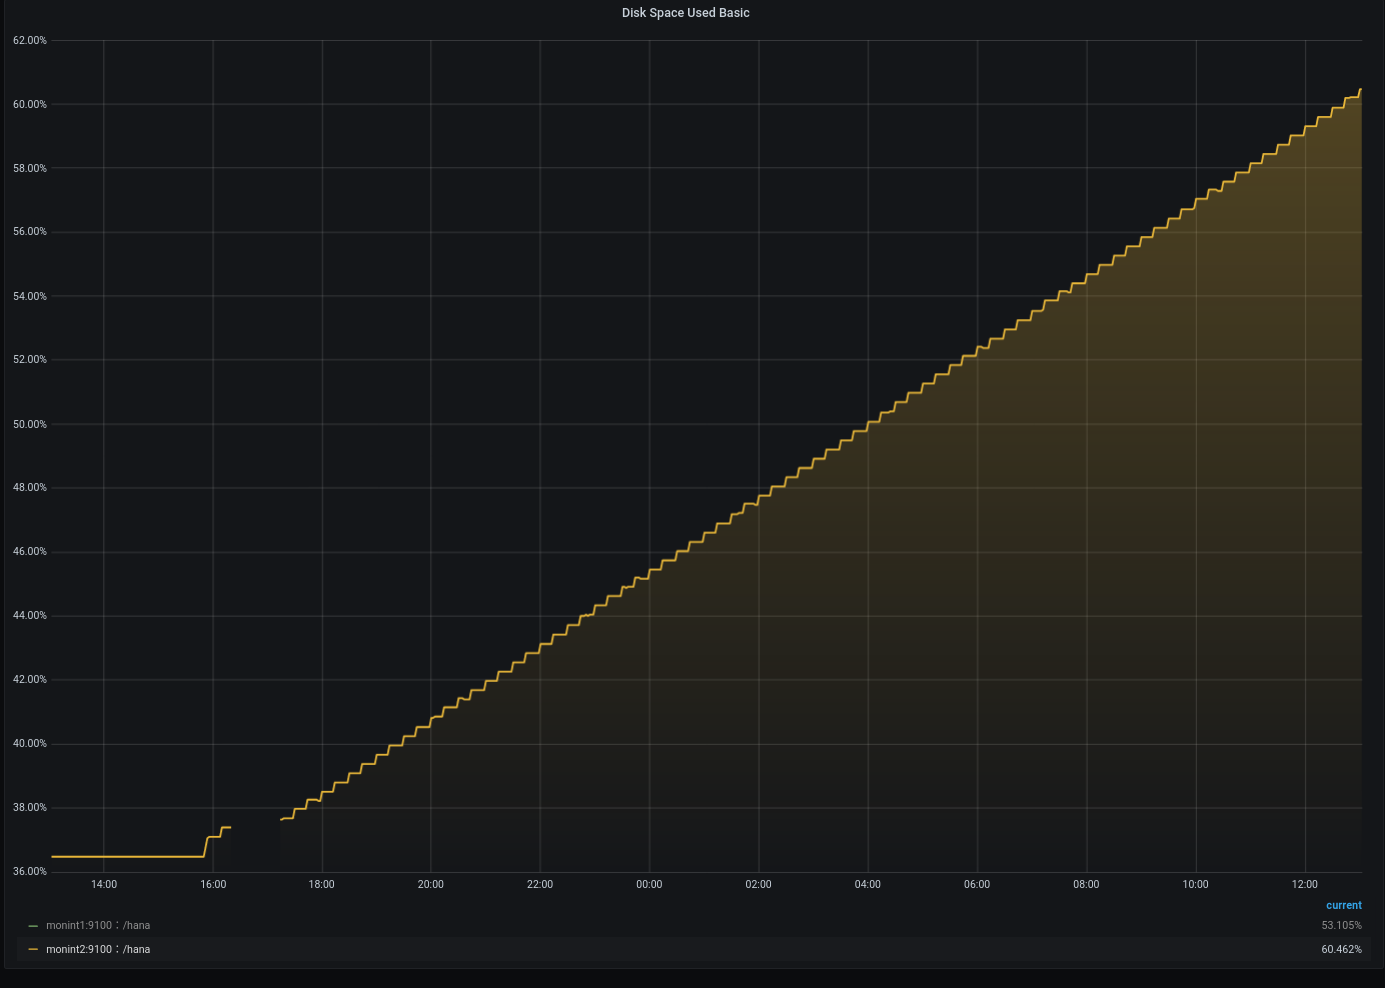
Monitoring disk space utilization of the server is critical and important for maximizing application availability. Detecting and monitoring - unexpected or expected - growth of data on the disk will help preventing disk full situations, and therefore application unavailability.
The example above represents a continuously growing file system.
The metrics used are node_filesystem_free_bytes and node_filesystem_size_bytes.
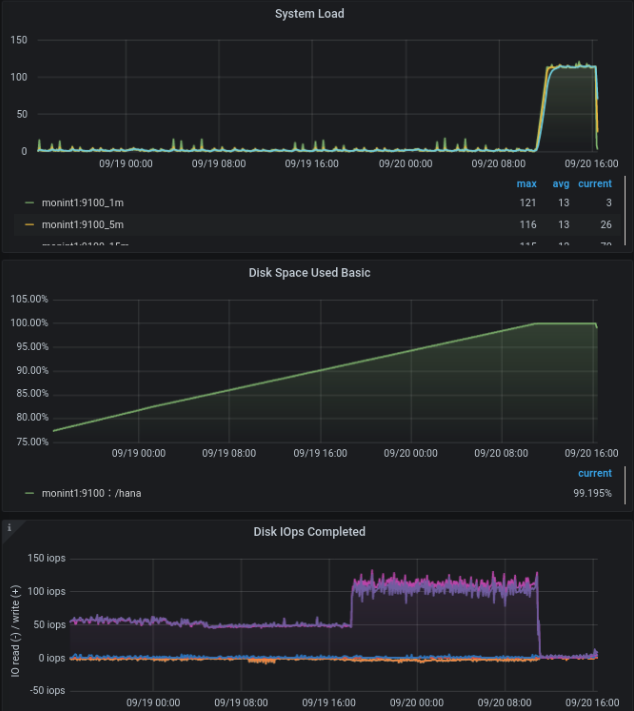
After a disk full situation many side effects are shown:
System load is going high
Disk IOps dropping down
- Conclusion
Predictive alerting can avoid a situation where the file system runs out of space and the system becomes unavailable. Setting up a simple alerting is a great way to help ensure that you do not encounter any surprises.
4.4.2 Extend Prometheus node_exporter function area #
Use the collector.textfile option from the node_exporter#
The textfile.collector functionality of the Prometheus node_exporter is already activated by default.
https://github.com/prometheus/node_exporter#textfile-collector
The option must be activated in the node_exporter configuration file by add the path where the node_exporter has to look for *.prom files. The option is called --collector.textfile.directory=”<path>”.
The content in this files have to be formatted in a node_exporter consumable way.
These information sources helped:
# cat /etc/sysconfig/prometheus-node_exporter

## Path: Network/Monitors/Prometheus/node_exporter
## Description: Prometheus node exporter startup parameters
## Type: string
## Default: ''
ARGS="--collector.systemd --no-collector.mdadm  --collector.textfile.directory="/var/lib/node_exporter/" --collector.meminfo_numa"
Finally, the node_exporter needs to be informed about the configuration changes and the directory must be created.
# systemctl restart prometheus-node_exporter.service
# mdir -p /var/lib/node_exporter
Example for disk information behind the RAID controller#
Information from the disks that are connected to the RAID controller are missing. All the important pieces of information like error counters or the status of the logical volumes are not accessible from the OS by default.
The RAID controller provides the hard disks as a logical device in two parts. The logical volumes of the RAID controller are on the one hand a RAID1 volume for the operating system and a RAID6 volume
for the data on the other hand. In SLES a /dev/sda and a /dev/sdb is shown. Perhaps due to the age of the hardware, it was not possible to read SMART data or query the status of the logical devices with native tools provided by the OS.
The tool amCLI can exactly display the information we are looking for: detailed data about the RAID controller and all associated devices, at runtime. This tool is provided by the hardware vendor.
# # overview
# amCLI -l
...
 32/7: SAS Backplane
 32/11: Disk, 'TOSHIBA MBF2300RC (0)', 285568MB
 32/10: Disk, 'TOSHIBA MBF2300RC (1)', 285568MB
 32/9: Disk, 'TOSHIBA MBF2300RC (2)', 285568MB
 32/8: Disk, 'TOSHIBA MBF2300RC (3)', 285568MB
 32/15: Disk, 'TOSHIBA MBF2300RC (4)', 285568MB
 32/14: Disk, 'TOSHIBA MBF2300RC (5)', 285568MB
 32/13: Disk, 'TOSHIBA MBF2300RC (6)', 285568MB
 32/12: Disk, 'TOSHIBA MBF2300RC (7)', 285568MB
 32/2: Logical drive 0, 'LogicalDrive_0', RAID-1, 285568MB
 32/3: Logical drive 1, 'storage', RAID-6, 1142272MB
 ...

# # detailed view
# amCLI -l 32/11
32/11: Disk, 'TOSHIBA MBF2300RC (0)', 285568MB
 Parents: 1
 Children: -
 Properties:
 Port number: 3
 Name: TOSHIBA MBF2300RC (0)
 Vendor: TOSHIBA
 Product: MBF2300RC
 Type: SAS
 Firmware version: 5208
 Serial number: EB07PC305JS2
 Transfer speed: 600 MB/s
 Transfer width: 1 bit(s)
 Rotational speed: 10 Krpm
 Device number: 7
 Slot: 0
 SAS address 00: 0x50000393E8216D5E
 Physical size: 286102 MB
 Config. size: 285568 MB
 Status: Operational
...
The output of the amCLI must be written in a file so that the node_exporter can collect it. Later, the raw data can be process in the Prometheus server.
The tool amCLI provides a different level of detail of the data depending on the options set, as shown above.
The output must be prepared to be used later in Prometheus. Think about and decide what information wanted to use later and how it should be presented. In this example, two things has influenced the decision:
The first one a label set
The second one values that changes, like an error counter.
The example picked values out of the amCLI output and defined them either as labels or as processable values. For queries where the labels were important, the output of a 0 or 1 as a value is defined.
For the second case, it returns the value that the output provides.
Using awk helped preparing the output of the amCLI in such a way that it end up with a metric that has a custom name on it (amcli_disk_information_summary).
The script is called amcli.sh and it is recommended to put this under /usr/local/bin. The file what is created should located at /var/lib/node_exporter. This directory must be created.
#!/bin/bash

TEXTFILE_COLLECTOR_DIR=/var/lib/node_exporter/
FILE=$TEXTFILE_COLLECTOR_DIR/amcli.prom
TS=$(date +%s)

{
	diskinfo=amcli_disk_information_summary
	echo "# HELP $diskinfo Physical Disk properties."
	echo "# TYPE $diskinfo gauge"

	PHYDisks=$(amCLI --list |sed -ne '/Disk,/{s/^\s*//;s/:.*$//;p}')
	for disk in $PHYDisks; do
		output=$(amCLI -l $disk \
			| awk -v name=$disk -v ts=$TS 'BEGIN {
				slot    = "";
				vendor  = "";
				product = "";
				status  = "";
				power_status  = "";
				port_number   = "";
				rotational_speed = "";
			}{
				if ($1 == "Vendor:")    { vendor  = $2; }
				if ($1 == "Product:")   { product = $2; }
				if ($1 == "Port" && $2 == "number:")       { port_number = $3; }
				if ($1 == "Rotational") { rotational_speed = $3 $4; }
				if ($1 == "Power" && $2 == "status:")      { power_status = $3; }
				if ($1 == "Status:")    { status       = $2 $3 $4 $5; }
				if ($1 == "Slot:")      { slot         = $2; }
			} END {
				printf ("amcli_disk_information_summary{name=\"%s\", vendor=\"%s\", product=\"%s\", port_number=\"%s\", rotational_speed=\"%s\", power_status=\"%s\", slot=\"%s\", status=\"%s\", ts=\"%s\" }\n",
					name, vendor, product, port_number, rotational_speed, power_status, slot, status, ts);
			}')
		rc=$?
		if [ $rc = 0 ]; then
			stat=1
		else
			stat=0
		fi
		echo "$output $stat"
	done

} > "$FILE.$$"
mv $FILE.$$ $FILE

exit 0
# End
Once the script was executed the content of the file with the name “amcli.prom” looked like this:
# cat amcli.prom

# HELP amcli_disk_information_summary Physical Disk properties.
# TYPE amcli_disk_information_summary gauge
amcli_disk_information_summary{name="32/11", vendor="TOSHIBA", product="MBF2300RC", port_number="3", rotational_speed="10Krpm", power_status="Active", slot="0", status="Operational", ts="1646052400" } 1
amcli_disk_information_summary{name="32/10", vendor="TOSHIBA", product="MBF2300RC", port_number="2", rotational_speed="10Krpm", power_status="Active", slot="1", status="Operational", ts="1646052400" } 1
amcli_disk_information_summary{name="32/9", vendor="TOSHIBA", product="MBF2300RC", port_number="1", rotational_speed="10Krpm", power_status="Active", slot="2", status="Operational", ts="1646052400" } 1
amcli_disk_information_summary{name="32/8", vendor="TOSHIBA", product="MBF2300RC", port_number="0", rotational_speed="10Krpm", power_status="Active", slot="3", status="Operational", ts="1646052400" } 1
amcli_disk_information_summary{name="32/15", vendor="TOSHIBA", product="MBF2300RC", port_number="7", rotational_speed="10Krpm", power_status="Active", slot="4", status="Operational", ts="1646052400" } 1
amcli_disk_information_summary{name="32/14", vendor="TOSHIBA", product="MBF2300RC", port_number="6", rotational_speed="10Krpm", power_status="Active", slot="5", status="Operational", ts="1646052400" } 1
amcli_disk_information_summary{name="32/13", vendor="TOSHIBA", product="MBF2300RC", port_number="5", rotational_speed="10Krpm", power_status="Active", slot="6", status="Operational", ts="1646052400" } 1
amcli_disk_information_summary{name="32/12", vendor="TOSHIBA", product="MBF2300RC", port_number="4", rotational_speed="10Krpm", power_status="Active", slot="7", status="Operational", ts="1646052400" } 1
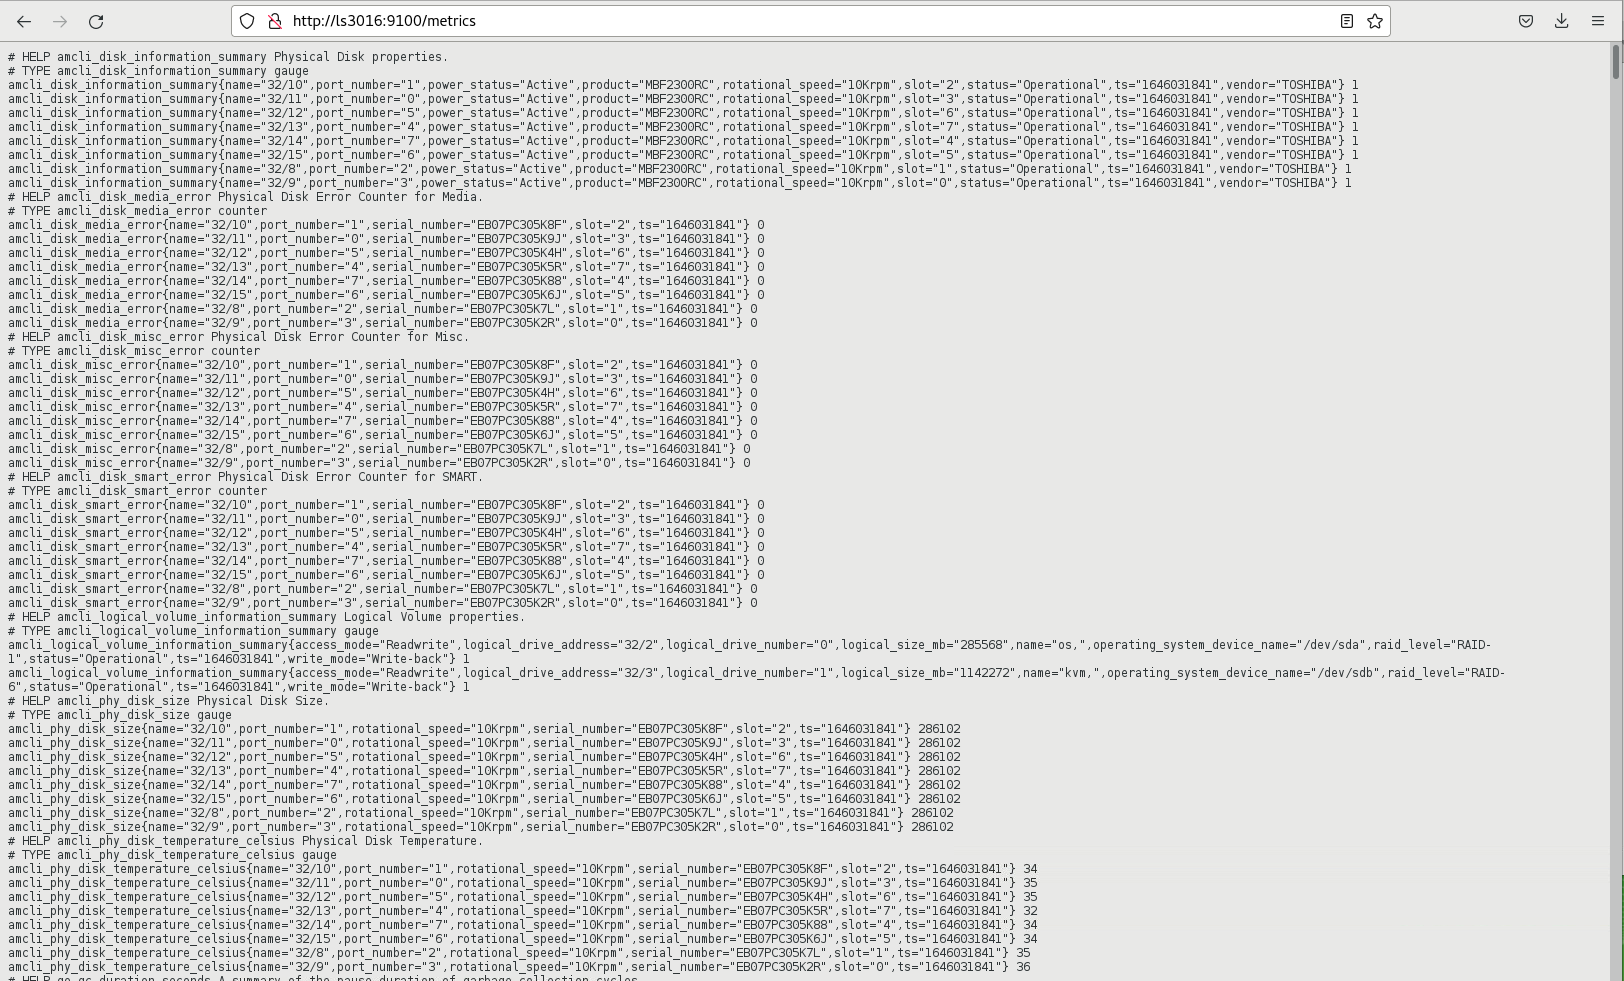
And the view from the node_exporter WebUI:
For the second case reused already existing labels from the disk information section. This help to be able to implement a mapping later. Therefore extended the script by a section like this:
...
	diskmedia=amcli_disk_media_error
	echo "# HELP $diskmedia Physical Disk Error Counter for Media."
	echo "# TYPE $diskmedia counter"

	diskmisc=amcli_disk_misc_error
	echo "# HELP $diskmisc Physical Disk Error Counter for Misc."
	echo "# TYPE $diskmisc counter"

	disksmart=amcli_disk_smart_error
	echo "# HELP $disksmart Physical Disk Error Counter for SMART."
	echo "# TYPE $disksmart counter"

	for disk in $(amCLI --list |sed -ne '/Disk,/{s/^\s*//;s/:.*$//;p}'); do
		DISKmedia=$(amCLI -l $disk \
			| awk -v name=$disk -v ts=$TS 'BEGIN {
				slot = "";
				port_number   = "";
				serial_number = "";
		}{
		 if ($1 == "Port")       { port_number = $3; }
		 if ($1 == "Status:")    { status = $2 $3 $4; }
		 if ($1 == "Slot:")      { slot = $2; }
		 if ($1 == "Media" && $2 == "errors:")  { media_error = $3; }
		 if ($1 == "Misc" && $2 == "errors:")   { misc_error = $3; }
		 if ($1 == "SMART" && $2 == "errors:")  { smart_error = $3; }
		 if ($1 == "Serial" && $2 == "number:") { serial_number = $3; }
		} END {
			printf ("amcli_disk_media_error{name=\"%s\", port_number=\"%s\", serial_number=\"%s\", slot=\"%s\", ts=\"%s\" } %s\n",
				name, port_number, serial_number, slot, ts, media_error);
			printf ("amcli_disk_misc_error{name=\"%s\", port_number=\"%s\", serial_number=\"%s\", slot=\"%s\", ts=\"%s\" } %s\n",
				name, port_number, serial_number, slot, ts, misc_error);
			printf ("amcli_disk_smart_error{name=\"%s\", port_number=\"%s\", serial_number=\"%s\", slot=\"%s\", ts=\"%s\" } %s\n",
				name, port_number, serial_number, slot, ts, smart_error);
		}')
		echo "$DISKmedia"
	done
...
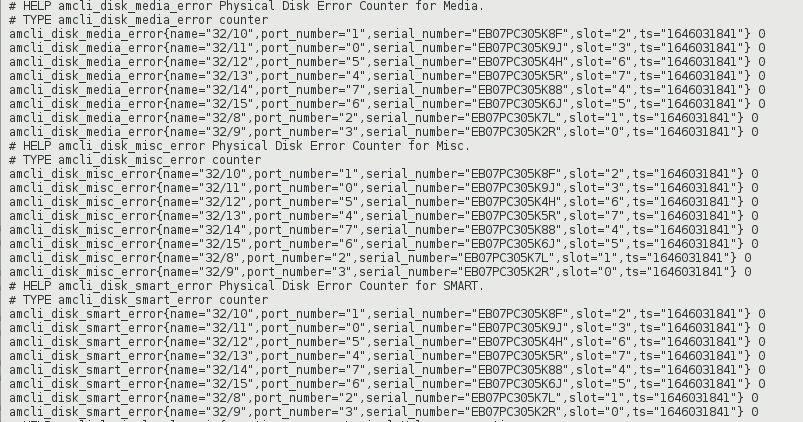
After the script was executed again the contents of the file looked now like this:
# cat amcli.prom

# HELP amcli_disk_information_summary Physical Disk properties.
# TYPE amcli_disk_information_summary gauge
amcli_disk_information_summary{name="32/11", vendor="TOSHIBA", product="MBF2300RC", port_number="3", rotational_speed="10Krpm", power_status="Active", slot="0", status="Operational", ts="1646054157" } 1
amcli_disk_information_summary{name="32/10", vendor="TOSHIBA", product="MBF2300RC", port_number="2", rotational_speed="10Krpm", power_status="Active", slot="1", status="Operational", ts="1646054157" } 1
amcli_disk_information_summary{name="32/9", vendor="TOSHIBA", product="MBF2300RC", port_number="1", rotational_speed="10Krpm", power_status="Active", slot="2", status="Operational", ts="1646054157" } 1
amcli_disk_information_summary{name="32/8", vendor="TOSHIBA", product="MBF2300RC", port_number="0", rotational_speed="10Krpm", power_status="Active", slot="3", status="Operational", ts="1646054157" } 1
amcli_disk_information_summary{name="32/15", vendor="TOSHIBA", product="MBF2300RC", port_number="7", rotational_speed="10Krpm", power_status="Active", slot="4", status="Operational", ts="1646054157" } 1
amcli_disk_information_summary{name="32/14", vendor="TOSHIBA", product="MBF2300RC", port_number="6", rotational_speed="10Krpm", power_status="Active", slot="5", status="Operational", ts="1646054157" } 1
amcli_disk_information_summary{name="32/13", vendor="TOSHIBA", product="MBF2300RC", port_number="5", rotational_speed="10Krpm", power_status="Active", slot="6", status="Operational", ts="1646054157" } 1
amcli_disk_information_summary{name="32/12", vendor="TOSHIBA", product="MBF2300RC", port_number="4", rotational_speed="10Krpm", power_status="Active", slot="7", status="Operational", ts="1646054157" } 1
# HELP amcli_disk_media_error Physical Disk Error Counter for Media.
# TYPE amcli_disk_media_error counter
# HELP amcli_disk_misc_error Physical Disk Error Counter for Misc.
# TYPE amcli_disk_misc_error counter
# HELP amcli_disk_smart_error Physical Disk Error Counter for SMART.
# TYPE amcli_disk_smart_error counter
amcli_disk_media_error{name="32/11", port_number="3", serial_number="EB07PC305JS2", slot="0", ts="1646054157" } 0
amcli_disk_misc_error{name="32/11", port_number="3", serial_number="EB07PC305JS2", slot="0", ts="1646054157" } 0
amcli_disk_smart_error{name="32/11", port_number="3", serial_number="EB07PC305JS2", slot="0", ts="1646054157" } 0
amcli_disk_media_error{name="32/10", port_number="2", serial_number="EB07PC305JUV", slot="1", ts="1646054157" } 0
amcli_disk_misc_error{name="32/10", port_number="2", serial_number="EB07PC305JUV", slot="1", ts="1646054157" } 0
amcli_disk_smart_error{name="32/10", port_number="2", serial_number="EB07PC305JUV", slot="1", ts="1646054157" } 0
amcli_disk_media_error{name="32/9", port_number="1", serial_number="EB07PC305K2W", slot="2", ts="1646054157" } 0
amcli_disk_misc_error{name="32/9", port_number="1", serial_number="EB07PC305K2W", slot="2", ts="1646054157" } 0
amcli_disk_smart_error{name="32/9", port_number="1", serial_number="EB07PC305K2W", slot="2", ts="1646054157" } 0
amcli_disk_media_error{name="32/8", port_number="0", serial_number="EB07PC305K5J", slot="3", ts="1646054157" } 0
amcli_disk_misc_error{name="32/8", port_number="0", serial_number="EB07PC305K5J", slot="3", ts="1646054157" } 0
amcli_disk_smart_error{name="32/8", port_number="0", serial_number="EB07PC305K5J", slot="3", ts="1646054157" } 0
amcli_disk_media_error{name="32/15", port_number="7", serial_number="EB07PC305K96", slot="4", ts="1646054157" } 0
amcli_disk_misc_error{name="32/15", port_number="7", serial_number="EB07PC305K96", slot="4", ts="1646054157" } 0
amcli_disk_smart_error{name="32/15", port_number="7", serial_number="EB07PC305K96", slot="4", ts="1646054157" } 0
amcli_disk_media_error{name="32/14", port_number="6", serial_number="EB07PC305JNS", slot="5", ts="1646054157" } 0
amcli_disk_misc_error{name="32/14", port_number="6", serial_number="EB07PC305JNS", slot="5", ts="1646054157" } 0
amcli_disk_smart_error{name="32/14", port_number="6", serial_number="EB07PC305JNS", slot="5", ts="1646054157" } 0
amcli_disk_media_error{name="32/13", port_number="5", serial_number="EB07PC305JSC", slot="6", ts="1646054157" } 0
amcli_disk_misc_error{name="32/13", port_number="5", serial_number="EB07PC305JSC", slot="6", ts="1646054157" } 0
amcli_disk_smart_error{name="32/13", port_number="5", serial_number="EB07PC305JSC", slot="6", ts="1646054157" } 0
amcli_disk_media_error{name="32/12", port_number="4", serial_number="EB07PC305JR7", slot="7", ts="1646054157" } 0
amcli_disk_misc_error{name="32/12", port_number="4", serial_number="EB07PC305JR7", slot="7", ts="1646054157" } 0
amcli_disk_smart_error{name="32/12", port_number="4", serial_number="EB07PC305JR7", slot="7", ts="1646054157" } 0
The view in the browser looks as expected:
Gathering everything that seems important, by using this method and extending the script. With the texfile.collector option of prometheus-node_exporter it is possible to gather all the information that where not accessible before.
Regular update of the file content#
For this task, “systemd.service” and “systemd.timer” can be used. Alternatively, this could also be realized by means of “cron”. The script needs executable permissions for this.
# chmod 750 amcli.sh
In “/etc/systemd/system/” create the timer and the service unit. The example will start with a timer calling the service every minute. With the 15sec scrap interval, the information in Prometheus is only updated every 4th interval.
# cat /etc/systemd/system/prometheus_amcli.timer

 [Unit]
 Description=Collecting RAID controller information
 Documentation=man:amCLI

[Timer]
 OnCalendar=--* ::00
 Persistent=true
 Unit=prometheus_amcli.service

[Install]
 WantedBy=multi-user.target
# cat /etc/systemd/system/prometheus_amcli.service

[Unit]
Description=Collecting RAID controller information
Documentation=man:amCLI

[Service]
Type=simple
Restart=no
ExecStartPre=/usr/bin/rm -f /var/lib/node_exporter/amcli.prom
ExecStart=/usr/local/bin/amcli.sh
Nice=19

[Install]
WantedBy=multi-user.target
The “systemd” needs to be informed about the new units:
# systemctl daemon-reload
Enable and start the monitoring extension for the node_exporter:
# systemctl enable prometheus_amcli.timer

Created symlink /etc/systemd/system/multi-user.target.wants/prometheus_amcli.timer → /etc/systemd/system/prometheus_amcli.timer

# systemctl enable --now prometheus_amcli.timer
Check the status again briefly:
# systemctl status prometheus_amcli

● prometheus_amcli.service - Collecting RAID controller information
 Loaded: loaded (/etc/systemd/system/prometheus_amcli.service; disabled; vendor preset: disabled)
 Active: inactive (dead) since Mon 2022-02-28 07:52:07 CET; 2s ago
 Docs: man:amCLI
 Process: 4824 ExecStart=/usr/local/bin/amcli.sh (code=exited, status=0/SUCCESS)
 Main PID: 4824 (code=exited, status=0/SUCCESS)

Feb 28 07:52:03 fscs99 systemd[1]: Started Collecting RAID controller information.
# systemctl status prometheus_amcli.timer

● prometheus_amcli.timer - Collecting RAID controller information
 Loaded: loaded (/etc/systemd/system/prometheus_amcli.timer; enabled; vendor preset: disabled)
 Active: active (waiting) since Mon 2022-02-28 07:30:24 CET; 21min ago
 Trigger: Mon 2022-02-28 07:53:00 CET; 44s left
 Docs: man:amCLI

Feb 28 07:30:24 fscs99 systemd[1]: Stopping Collecting RAID controller information.
Feb 28 07:30:24 fscs99 systemd[1]: Started Collecting RAID controller information.
The data is now retrieved every minute with the script amcli.sh and the output is redirected to a file amcli.prom that the Prometheus node_exporter can process.
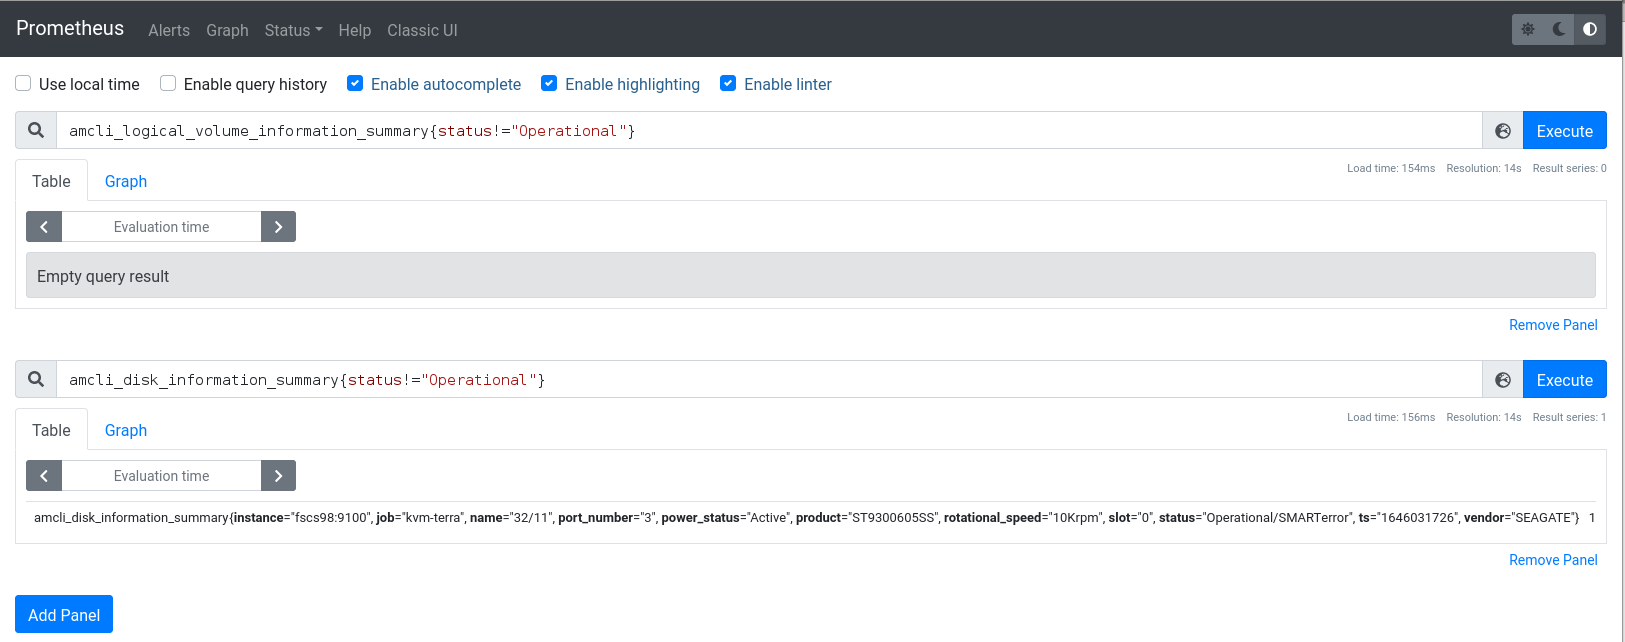
The result of our work now looks like this:
Query the data from Prometheus#
With the metrics accessible from Prometheus, a rule can be built to set up an alert trigger. Starting with built the metrics using the Prometheus Web UI.
Once the query is complete and provides the desired result, include these metrics in our Prometheus rule file.
5 Miscellaneous #
5.1 Prometheus maintenance #
Start, Stop and Reload Prometheus#
The installation of Prometheus is providing a systemd unit. The Prometheus server can easily started and stopped with systemctl command.
Start Prometheus
systemctl start prometheus.serviceStop Prometheus
systemctl stop prometheus.serviceRestart Prometheus
systemctl restart prometheus.serviceReload Prometheus configuration
systemctl reload prometheus.service
In case the --web.enable-lifecycle option is set for Prometheus the configuration can be reloaded via curl.
# curl -X POST http://<hostname or IP>:9090/-/reload
Validating Prometheus configuration and rules#
With the installation of Prometheus a check tool is installed. The promtool can check the rules and the
configuration of Prometheus before the system is running into failure due to wrong formatting or settings.
promtool check config /etc/prometheus/<..>.yml
promtool check rule /etc/prometheus/<..>.yml
# promtool check config /etc/prometheus/prometheus.yml

Checking /etc/prometheus/prometheus.yml
  SUCCESS: 1 rule files found

Checking /etc/prometheus/rules.yml
  SUCCESS: 43 rules found
5.2 Promtail #
Promtail is not only able to collecting and passing logs to Loki. Promtail can do much more. By using the pipeline section it can be include several stages to add and transform logs, labels and timestamp. Below are some examples of common and useful stages.
5.2.1 Template #
The template stage are mostly used to manipulate text, convert it to upper or lower cases, etc. The below example will manipulate the timestamp to fit into the correct RFC:
- job_name: services
  static_configs:
  - targets:
      - localhost
    labels:
      job: service-available
      dataSource: Fullsysteminfodump
      __path__: /logs/fu/HDB*/*/trace/system_availability_*.trc

  pipeline_stages:

  - match:
      selector: '{job="service-available"}'
      stages:

      # Separate timestamp and messages for further process
      - regex:
          expression: '^0;(?P<time>.*?\..{6});(?P<message>.*$)'

      # Correct  and create loki compatible timestamp
      - template:
          source: time
          template: '{{ Replace .Value " " "T" -1 }}000+00:00'
      - timestamp:
          source: time
          format: RFC3339Nano
          action_on_failure: fudge
5.2.2 Labels for log content #
Labels are used a lot in Grafana products. The example below already contain labels like "job" and host". It is however also possible to create labels depending on the log content by using regex.
scrape_configs:
- job_name: system
  static_configs:
   - targets:
      - localhost
     labels:
      job: messages
      loghost: logserver01
      __path__: /var/log/messages

  pipeline_stages:
  - match:
      selector: '{job="systemlogs"}'
      stages:
      - regex:
          expression: '^.* .* (?P<Unit>.*?)\[.*\]: .*$'
      - labels:
          Unit:
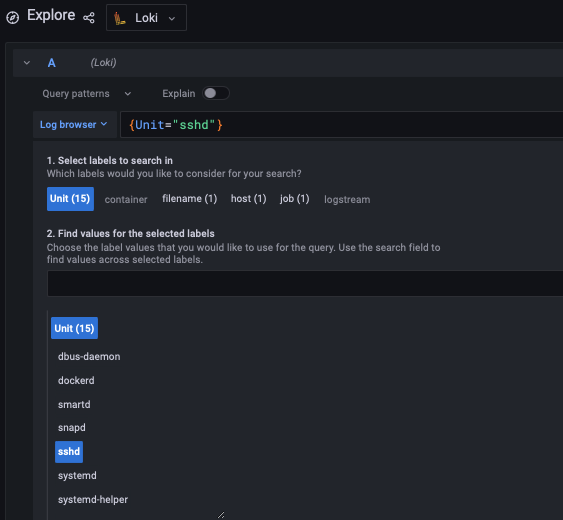
With the above config the label Unit can be used to show all messages with a specific unit:
5.2.3 Drop log entries #
Sometimes an application is constantly writing annoying messages in the log you want to get rid of.
The stage drop can exactly do that by using, for example, the parameter expression.
- job_name: messages
  static_configs:
  - targets:
      - localhost
    labels:
      job: systemlogs
      host: nuc5
      __path__: /logs/messages

  pipeline_stages:
  - drop:
      expression: ".*annoying messages.*"
6 Summary #
With SAP systems such as SAP S/4HANA supporting mission-critical business functions, the need for maximized system availability becomes crucial. The solution described in this document provides the tooling necessary to enable detection and potentially prevention of causes for downtime of those systems. We have also provided some practical use cases highlighting how this tooling can be used to detect and prevent some common issues that are usually hard to detect.
7 Legal notice #
Copyright © 2006-2026 SUSE LLC and contributors. All rights reserved.
Permission is granted to copy, distribute and/or modify this document under the terms of the GNU Free Documentation License, Version 1.2 or (at your option) version 1.3; with the Invariant Section being this copyright notice and license. A copy of the license version 1.2 is included in the section entitled "GNU Free Documentation License".
SUSE, the SUSE logo and YaST are registered trademarks of SUSE LLC in the United States and other countries. For SUSE trademarks, see https://www.suse.com/company/legal/.
Linux is a registered trademark of Linus Torvalds. All other names or trademarks mentioned in this document may be trademarks or registered trademarks of their respective owners.
Documents published as part of the SUSE Best Practices series have been contributed voluntarily by SUSE employees and third parties. They are meant to serve as examples of how particular actions can be performed. They have been compiled with utmost attention to detail. However, this does not guarantee complete accuracy. SUSE cannot verify that actions described in these documents do what is claimed or whether actions described have unintended consequences. SUSE LLC, its affiliates, the authors, and the translators may not be held liable for possible errors or the consequences thereof.
Below we draw your attention to the license under which the articles are published.
8 GNU Free Documentation License #
Copyright © 2000, 2001, 2002 Free Software Foundation, Inc. 51 Franklin St, Fifth Floor, Boston, MA 02110-1301 USA. Everyone is permitted to copy and distribute verbatim copies of this license document, but changing it is not allowed.
0. PREAMBLE#
The purpose of this License is to make a manual, textbook, or other functional and useful document "free" in the sense of freedom: to assure everyone the effective freedom to copy and redistribute it, with or without modifying it, either commercially or noncommercially. Secondarily, this License preserves for the author and publisher a way to get credit for their work, while not being considered responsible for modifications made by others.
This License is a kind of "copyleft", which means that derivative works of the document must themselves be free in the same sense. It complements the GNU General Public License, which is a copyleft license designed for free software.
We have designed this License in order to use it for manuals for free software, because free software needs free documentation: a free program should come with manuals providing the same freedoms that the software does. But this License is not limited to software manuals; it can be used for any textual work, regardless of subject matter or whether it is published as a printed book. We recommend this License principally for works whose purpose is instruction or reference.
1. APPLICABILITY AND DEFINITIONS#
This License applies to any manual or other work, in any medium, that contains a notice placed by the copyright holder saying it can be distributed under the terms of this License. Such a notice grants a world-wide, royalty-free license, unlimited in duration, to use that work under the conditions stated herein. The "Document", below, refers to any such manual or work. Any member of the public is a licensee, and is addressed as "you". You accept the license if you copy, modify or distribute the work in a way requiring permission under copyright law.
A "Modified Version" of the Document means any work containing the Document or a portion of it, either copied verbatim, or with modifications and/or translated into another language.
A "Secondary Section" is a named appendix or a front-matter section of the Document that deals exclusively with the relationship of the publishers or authors of the Document to the Document’s overall subject (or to related matters) and contains nothing that could fall directly within that overall subject. (Thus, if the Document is in part a textbook of mathematics, a Secondary Section may not explain any mathematics.) The relationship could be a matter of historical connection with the subject or with related matters, or of legal, commercial, philosophical, ethical or political position regarding them.
The "Invariant Sections" are certain Secondary Sections whose titles are designated, as being those of Invariant Sections, in the notice that says that the Document is released under this License. If a section does not fit the above definition of Secondary then it is not allowed to be designated as Invariant. The Document may contain zero Invariant Sections. If the Document does not identify any Invariant Sections then there are none.
The "Cover Texts" are certain short passages of text that are listed, as Front-Cover Texts or Back-Cover Texts, in the notice that says that the Document is released under this License. A Front-Cover Text may be at most 5 words, and a Back-Cover Text may be at most 25 words.
A "Transparent" copy of the Document means a machine-readable copy, represented in a format whose specification is available to the general public, that is suitable for revising the document straightforwardly with generic text editors or (for images composed of pixels) generic paint programs or (for drawings) some widely available drawing editor, and that is suitable for input to text formatters or for automatic translation to a variety of formats suitable for input to text formatters. A copy made in an otherwise Transparent file format whose markup, or absence of markup, has been arranged to thwart or discourage subsequent modification by readers is not Transparent. An image format is not Transparent if used for any substantial amount of text. A copy that is not "Transparent" is called "Opaque".
Examples of suitable formats for Transparent copies include plain ASCII without markup, Texinfo input format, LaTeX input format, SGML or XML using a publicly available DTD, and standard-conforming simple HTML, PostScript or PDF designed for human modification. Examples of transparent image formats include PNG, XCF and JPG. Opaque formats include proprietary formats that can be read and edited only by proprietary word processors, SGML or XML for which the DTD and/or processing tools are not generally available, and the machine-generated HTML, PostScript or PDF produced by some word processors for output purposes only.
The "Title Page" means, for a printed book, the title page itself, plus such following pages as are needed to hold, legibly, the material this License requires to appear in the title page. For works in formats which do not have any title page as such, "Title Page" means the text near the most prominent appearance of the work’s title, preceding the beginning of the body of the text.
A section "Entitled XYZ" means a named subunit of the Document whose title either is precisely XYZ or contains XYZ in parentheses following text that translates XYZ in another language. (Here XYZ stands for a specific section name mentioned below, such as "Acknowledgements", "Dedications", "Endorsements", or "History".) To "Preserve the Title" of such a section when you modify the Document means that it remains a section "Entitled XYZ" according to this definition.
The Document may include Warranty Disclaimers next to the notice which states that this License applies to the Document. These Warranty Disclaimers are considered to be included by reference in this License, but only as regards disclaiming warranties: any other implication that these Warranty Disclaimers may have is void and has no effect on the meaning of this License.
2. VERBATIM COPYING#
You may copy and distribute the Document in any medium, either commercially or noncommercially, provided that this License, the copyright notices, and the license notice saying this License applies to the Document are reproduced in all copies, and that you add no other conditions whatsoever to those of this License. You may not use technical measures to obstruct or control the reading or further copying of the copies you make or distribute. However, you may accept compensation in exchange for copies. If you distribute a large enough number of copies you must also follow the conditions in section 3.
You may also lend copies, under the same conditions stated above, and you may publicly display copies.
3. COPYING IN QUANTITY#
If you publish printed copies (or copies in media that commonly have printed covers) of the Document, numbering more than 100, and the Document’s license notice requires Cover Texts, you must enclose the copies in covers that carry, clearly and legibly, all these Cover Texts: Front-Cover Texts on the front cover, and Back-Cover Texts on the back cover. Both covers must also clearly and legibly identify you as the publisher of these copies. The front cover must present the full title with all words of the title equally prominent and visible. You may add other material on the covers in addition. Copying with changes limited to the covers, as long as they preserve the title of the Document and satisfy these conditions, can be treated as verbatim copying in other respects.
If the required texts for either cover are too voluminous to fit legibly, you should put the first ones listed (as many as fit reasonably) on the actual cover, and continue the rest onto adjacent pages.
If you publish or distribute Opaque copies of the Document numbering more than 100, you must either include a machine-readable Transparent copy along with each Opaque copy, or state in or with each Opaque copy a computer-network location from which the general network-using public has access to download using public-standard network protocols a complete Transparent copy of the Document, free of added material. If you use the latter option, you must take reasonably prudent steps, when you begin distribution of Opaque copies in quantity, to ensure that this Transparent copy will remain thus accessible at the stated location until at least one year after the last time you distribute an Opaque copy (directly or through your agents or retailers) of that edition to the public.
It is requested, but not required, that you contact the authors of the Document well before redistributing any large number of copies, to give them a chance to provide you with an updated version of the Document.
4. MODIFICATIONS#
You may copy and distribute a Modified Version of the Document under the conditions of sections 2 and 3 above, provided that you release the Modified Version under precisely this License, with the Modified Version filling the role of the Document, thus licensing distribution and modification of the Modified Version to whoever possesses a copy of it. In addition, you must do these things in the Modified Version:
Use in the Title Page (and on the covers, if any) a title distinct from that of the Document, and from those of previous versions (which should, if there were any, be listed in the History section of the Document). You may use the same title as a previous version if the original publisher of that version gives permission.
List on the Title Page, as authors, one or more persons or entities responsible for authorship of the modifications in the Modified Version, together with at least five of the principal authors of the Document (all of its principal authors, if it has fewer than five), unless they release you from this requirement.
State on the Title page the name of the publisher of the Modified Version, as the publisher.
Preserve all the copyright notices of the Document.
Add an appropriate copyright notice for your modifications adjacent to the other copyright notices.
Include, immediately after the copyright notices, a license notice giving the public permission to use the Modified Version under the terms of this License, in the form shown in the Addendum below.
Preserve in that license notice the full lists of Invariant Sections and required Cover Texts given in the Document’s license notice.
Include an unaltered copy of this License.
Preserve the section Entitled "History", Preserve its Title, and add to it an item stating at least the title, year, new authors, and publisher of the Modified Version as given on the Title Page. If there is no section Entitled "History" in the Document, create one stating the title, year, authors, and publisher of the Document as given on its Title Page, then add an item describing the Modified Version as stated in the previous sentence.
Preserve the network location, if any, given in the Document for public access to a Transparent copy of the Document, and likewise the network locations given in the Document for previous versions it was based on. These may be placed in the "History" section. You may omit a network location for a work that was published at least four years before the Document itself, or if the original publisher of the version it refers to gives permission.
For any section Entitled "Acknowledgements" or "Dedications", Preserve the Title of the section, and preserve in the section all the substance and tone of each of the contributor acknowledgements and/or dedications given therein.
Preserve all the Invariant Sections of the Document, unaltered in their text and in their titles. Section numbers or the equivalent are not considered part of the section titles.
Delete any section Entitled "Endorsements". Such a section may not be included in the Modified Version.
Do not retitle any existing section to be Entitled "Endorsements" or to conflict in title with any Invariant Section.
Preserve any Warranty Disclaimers.
If the Modified Version includes new front-matter sections or appendices that qualify as Secondary Sections and contain no material copied from the Document, you may at your option designate some or all of these sections as invariant. To do this, add their titles to the list of Invariant Sections in the Modified Version’s license notice. These titles must be distinct from any other section titles.
You may add a section Entitled "Endorsements", provided it contains nothing but endorsements of your Modified Version by various parties—for example, statements of peer review or that the text has been approved by an organization as the authoritative definition of a standard.
You may add a passage of up to five words as a Front-Cover Text, and a passage of up to 25 words as a Back-Cover Text, to the end of the list of Cover Texts in the Modified Version. Only one passage of Front-Cover Text and one of Back-Cover Text may be added by (or through arrangements made by) any one entity. If the Document already includes a cover text for the same cover, previously added by you or by arrangement made by the same entity you are acting on behalf of, you may not add another; but you may replace the old one, on explicit permission from the previous publisher that added the old one.
The author(s) and publisher(s) of the Document do not by this License give permission to use their names for publicity for or to assert or imply endorsement of any Modified Version.
5. COMBINING DOCUMENTS#
You may combine the Document with other documents released under this License, under the terms defined in section 4 above for modified versions, provided that you include in the combination all of the Invariant Sections of all of the original documents, unmodified, and list them all as Invariant Sections of your combined work in its license notice, and that you preserve all their Warranty Disclaimers.
The combined work need only contain one copy of this License, and multiple identical Invariant Sections may be replaced with a single copy. If there are multiple Invariant Sections with the same name but different contents, make the title of each such section unique by adding at the end of it, in parentheses, the name of the original author or publisher of that section if known, or else a unique number. Make the same adjustment to the section titles in the list of Invariant Sections in the license notice of the combined work.
In the combination, you must combine any sections Entitled "History" in the various original documents, forming one section Entitled "History"; likewise combine any sections Entitled "Acknowledgements", and any sections Entitled "Dedications". You must delete all sections Entitled "Endorsements".
6. COLLECTIONS OF DOCUMENTS#
You may make a collection consisting of the Document and other documents released under this License, and replace the individual copies of this License in the various documents with a single copy that is included in the collection, provided that you follow the rules of this License for verbatim copying of each of the documents in all other respects.
You may extract a single document from such a collection, and distribute it individually under this License, provided you insert a copy of this License into the extracted document, and follow this License in all other respects regarding verbatim copying of that document.
7. AGGREGATION WITH INDEPENDENT WORKS#
A compilation of the Document or its derivatives with other separate and independent documents or works, in or on a volume of a storage or distribution medium, is called an "aggregate" if the copyright resulting from the compilation is not used to limit the legal rights of the compilation’s users beyond what the individual works permit. When the Document is included in an aggregate, this License does not apply to the other works in the aggregate which are not themselves derivative works of the Document.
If the Cover Text requirement of section 3 is applicable to these copies of the Document, then if the Document is less than one half of the entire aggregate, the Document’s Cover Texts may be placed on covers that bracket the Document within the aggregate, or the electronic equivalent of covers if the Document is in electronic form. Otherwise they must appear on printed covers that bracket the whole aggregate.
8. TRANSLATION#
Translation is considered a kind of modification, so you may distribute translations of the Document under the terms of section 4. Replacing Invariant Sections with translations requires special permission from their copyright holders, but you may include translations of some or all Invariant Sections in addition to the original versions of these Invariant Sections. You may include a translation of this License, and all the license notices in the Document, and any Warranty Disclaimers, provided that you also include the original English version of this License and the original versions of those notices and disclaimers. In case of a disagreement between the translation and the original version of this License or a notice or disclaimer, the original version will prevail.
If a section in the Document is Entitled "Acknowledgements", "Dedications", or "History", the requirement (section 4) to Preserve its Title (section 1) will typically require changing the actual title.
9. TERMINATION#
You may not copy, modify, sublicense, or distribute the Document except as expressly provided for under this License. Any other attempt to copy, modify, sublicense or distribute the Document is void, and will automatically terminate your rights under this License. However, parties who have received copies, or rights, from you under this License will not have their licenses terminated so long as such parties remain in full compliance.
10. FUTURE REVISIONS OF THIS LICENSE#
The Free Software Foundation may publish new, revised versions of the GNU Free Documentation License from time to time. Such new versions will be similar in spirit to the present version, but may differ in detail to address new problems or concerns. See http://www.gnu.org/copyleft/.
Each version of the License is given a distinguishing version number. If the Document specifies that a particular numbered version of this License "or any later version" applies to it, you have the option of following the terms and conditions either of that specified version or of any later version that has been published (not as a draft) by the Free Software Foundation. If the Document does not specify a version number of this License, you may choose any version ever published (not as a draft) by the Free Software Foundation.
ADDENDUM: How to use this License for your documents#
Copyright (c) YEAR YOUR NAME.
   Permission is granted to copy, distribute and/or modify this document
   under the terms of the GNU Free Documentation License, Version 1.2
   or any later version published by the Free Software Foundation;
   with no Invariant Sections, no Front-Cover Texts, and no Back-Cover Texts.
   A copy of the license is included in the section entitled “GNU
   Free Documentation License”.
If you have Invariant Sections, Front-Cover Texts and Back-Cover Texts, replace the “ with…Texts.” line with this:
with the Invariant Sections being LIST THEIR TITLES, with the
   Front-Cover Texts being LIST, and with the Back-Cover Texts being LIST.
If you have Invariant Sections without Cover Texts, or some other combination of the three, merge those two alternatives to suit the situation.
If your document contains nontrivial examples of program code, we recommend releasing these examples in parallel under your choice of free software license, such as the GNU General Public License, to permit their use in free software.
