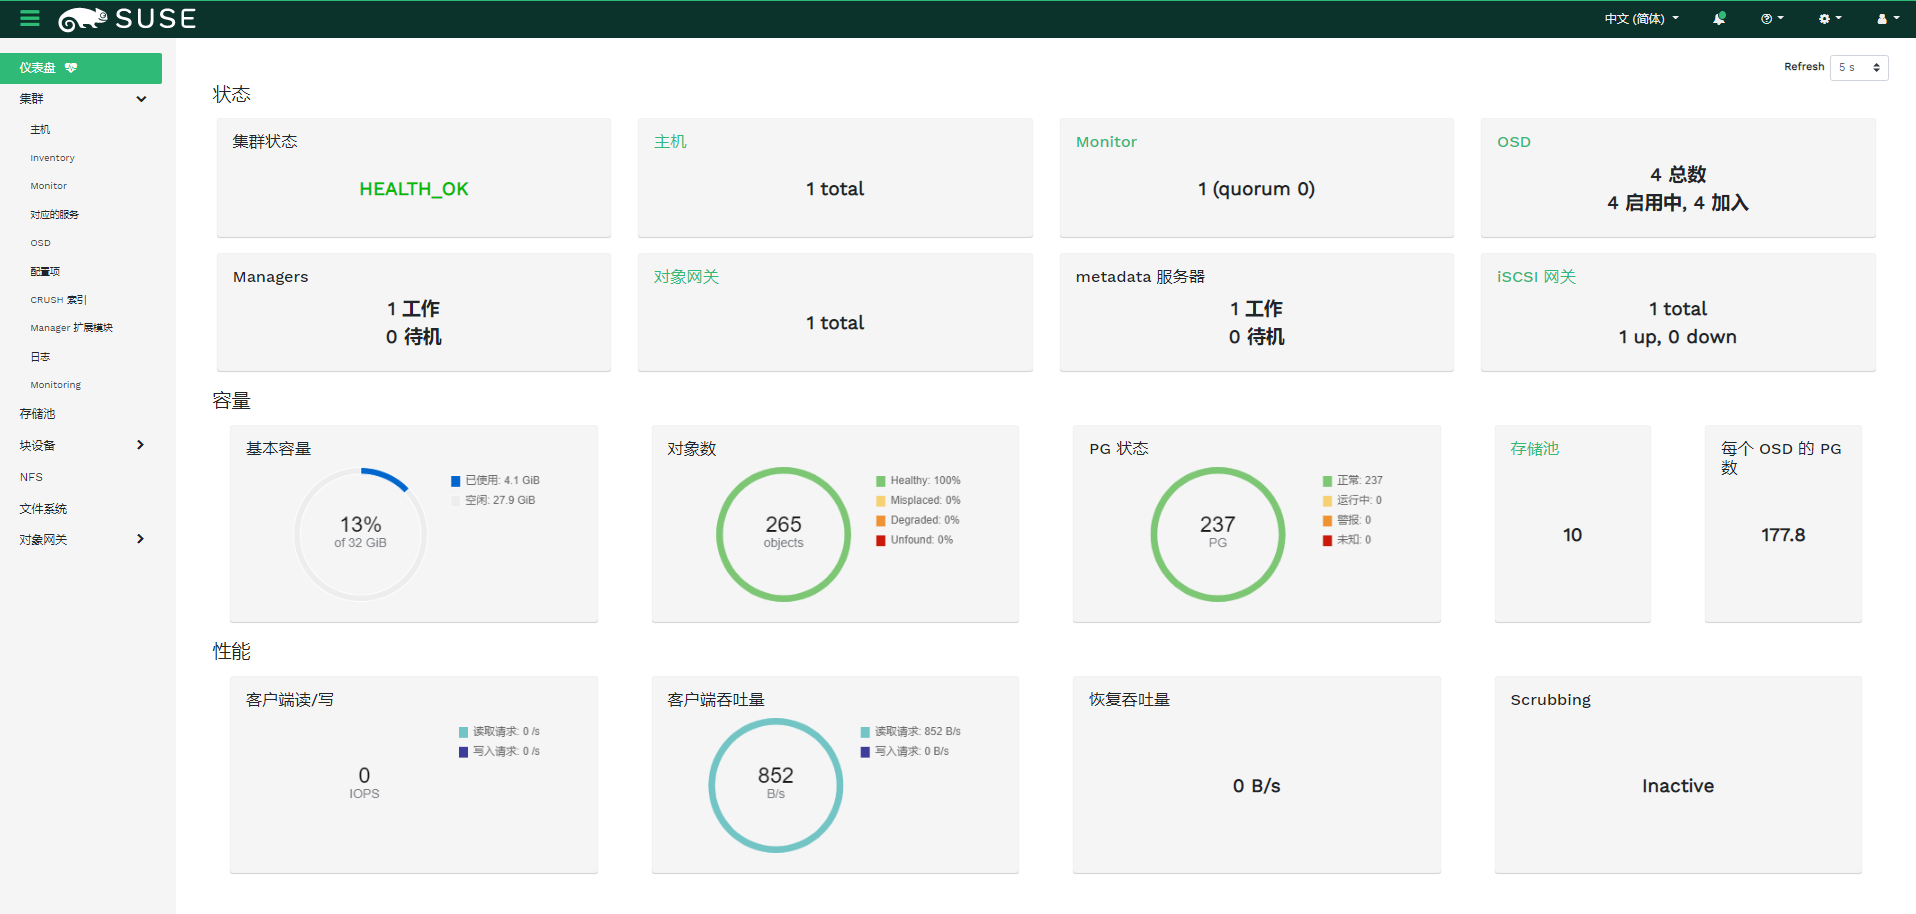
14 Ceph Dashboard #
14.1 Ceph Dashboard #
The Ceph Dashboard is a helpful tool to give you an overview of the status of your Ceph cluster, including overall health, status of the MOPN quorum, status of the MGR, OSD, and other Ceph daemons, view pools and PG status, show logs for the daemons, and more. Rook makes it simple to enable the dashboard.
14.1.1 Enabling the Ceph Dashboard #
The
dashboard
can be enabled with settings in the CephCluster CRD. The CephCluster CRD
must have the dashboard enabled setting set to
true. This is the default setting in the example
manifests.
  spec:
    dashboard:
      enabled: true
The Rook operator will enable the ceph-mgr dashboard
module. A service object will be created to expose that port inside the
Kubernetes cluster. Rook will enable port 8443 for HTTPS access.
This example shows that port 8443 was configured:
kubectl@adm > kubectl -n rook-ceph get service
NAME                         TYPE        CLUSTER-IP       EXTERNAL-IP   PORT(S)          AGE
rook-ceph-mgr                ClusterIP   10.108.111.192   <none>        9283/TCP         3h
rook-ceph-mgr-dashboard      ClusterIP   10.110.113.240   <none>        8443/TCP         3h
The first service is for reporting the Prometheus metrics, while the
latter service is for the dashboard. If you are on a node in the cluster,
you will be able to connect to the dashboard by using either the DNS name
of the service at
https://rook-ceph-mgr-dashboard-https:8443 or by
connecting to the cluster IP, in this example at
https://10.110.113.240:8443.
The dashboard will only be enabled for the first Ceph object store created by Rook.
14.1.1.1 Creating login credentials #
After you connect to the dashboard, you will need to login for secure
access. Rook creates a default user named admin and
generates a secret called
rook-ceph-dashboard-admin-password in the namespace
where the Rook-Ceph cluster is running. To retrieve the generated
password, you can run the following:
kubectl@adm > kubectl -n rook-ceph get secret rook-ceph-dashboard-password \
 -o jsonpath="{['data']['password']}" | base64 --decode && echo
14.1.2 Configuring the Ceph Dashboard #
The following dashboard configuration settings are supported:
  spec:
    dashboard:
      urlPrefix: /ceph-dashboard
      port: 8443
ssl: trueurlPrefixIf you are accessing the dashboard via a reverse proxy, you may wish to serve it under a URL prefix. To get the dashboard to use hyperlinks that include your prefix, you can set theurlPrefixsetting.portThe port that the dashboard is served on may be changed from the default using theportsetting. The corresponding K8s service exposing the port will automatically be updated.sslThe dashboard may be served without SSL by setting thessloption to false.
14.1.3 Viewing the Ceph Dashboard external to the cluster #
Commonly, you will want to view the dashboard from outside the cluster. For example, on a development machine with the cluster running inside minikube, you will want to access the dashboard from the host.
There are several ways to expose a service, which will depend on the environment you are running in. You can use an Ingress Controller or other methods for exposing services such as NodePort, LoadBalancer, or ExternalIPs.
14.1.3.1 Node port #
The simplest way to expose the service in minikube or similar environments
is using the NodePort to open a port on the VM that can be accessed by the
host. To create a service with the NodePort, save this YAML file as
dashboard-external-https.yaml.
  apiVersion: v1
  kind: Service
  metadata:
    name: rook-ceph-mgr-dashboard-external-https
    namespace: rook-ceph
    labels:
      app: rook-ceph-mgr
      rook_cluster: rook-ceph
  spec:
    ports:
    - name: dashboard
      port: 8443
      protocol: TCP
      targetPort: 8443
    selector:
      app: rook-ceph-mgr
      rook_cluster: rook-ceph
    sessionAffinity: None
    type: NodePort
Now create the service:
kubectl@adm > kubectl create -f dashboard-external-https.yaml
You will see the new service
rook-ceph-mgr-dashboard-external-https created:
kubectl@adm > kubectl -n rook-ceph get service
NAME                                    TYPE        CLUSTER-IP       EXTERNAL-IP   PORT(S)          AGE
rook-ceph-mgr                           ClusterIP   10.108.111.192   <none>        9283/TCP         4h
rook-ceph-mgr-dashboard                 ClusterIP   10.110.113.240   <none>        8443/TCP         4h
rook-ceph-mgr-dashboard-external-https  NodePort    10.101.209.6     <none>        8443:31176/TCP   4h
In this example, port 31176 will be opened to expose
port 8443 from the ceph-mgr pod. Find the IP address of
the VM. If using minikube, you can run minikube ip to
find the IP address. Now you can enter the URL in your browser such as
https://192.168.99.110:31176 and the dashboard will
appear.
14.1.3.2 Creating the load balancer service #
If you have a cluster on a cloud provider that supports load balancers,
you can create a service that is provisioned with a public hostname. The
yaml is the same as dashboard-external-https.yaml
except for the following property:
  spec:
  [...]
    type: LoadBalancer
Now create the service:
kubectl@adm > kubectl create -f dashboard-loadbalancer.yaml
You will see the new service
rook-ceph-mgr-dashboard-loadbalancer created:
kubectl@adm > kubectl -n rook-ceph get service
NAME                                     TYPE           CLUSTER-IP       EXTERNAL-IP                                                               PORT(S)             AGE
rook-ceph-mgr                            ClusterIP      172.30.11.40     <none>                                                                    9283/TCP      4h
rook-ceph-mgr-dashboard                  ClusterIP      172.30.203.185   <none>                                                                    8443/TCP      4h
rook-ceph-mgr-dashboard-loadbalancer     LoadBalancer   172.30.27.242    a7f23e8e2839511e9b7a5122b08f2038-1251669398.us-east-1.elb.amazonaws.com   8443:32747/TCP      4h
Now you can enter the URL in your browser such as
https://a7f23e8e2839511e9b7a5122b08f2038-1251669398.us-east-1.elb.amazonaws.com:8443
and the dashboard will appear.
14.1.3.3 Ingress controller #
If you have a cluster with an Nginx Ingress Controller and a certificate manager, then you can create an ingress like the one below. This example achieves four things:
Exposes the dashboard on the Internet (using an reverse proxy).
Issues an valid TLS Certificate for the specified domain name.
Tells the reverse proxy that the dashboard itself uses HTTPS.
Tells the reverse proxy that the dashboard itself does not have a valid certificate (it is self-signed).
  apiVersion: extensions/v1beta1
  kind: Ingress
  metadata:
    name: rook-ceph-mgr-dashboard
    namespace: rook-ceph
    annotations:
      kubernetes.io/ingress.class: "nginx"
      kubernetes.io/tls-acme: "true"
      nginx.ingress.kubernetes.io/backend-protocol: "HTTPS"
      nginx.ingress.kubernetes.io/server-snippet: |
        proxy_ssl_verify off;
  spec:
    tls:
     - hosts:
       - rook-ceph.example.com
       secretName: rook-ceph.example.com
    rules:
    - host: rook-ceph.example.com
      http:
        paths:
        - path: /
          backend:
            serviceName: rook-ceph-mgr-dashboard
            servicePort: https-dashboard
Customise the ingress resource to match your cluster. Replace the example
domain name rook-ceph.example.com with a domain name
that will resolve to your Ingress Controller (creating the DNS entry if
required).
Now create the ingress:
kubectl@adm > kubectl create -f dashboard-ingress-https.yaml
You will see the new ingress rook-ceph-mgr-dashboard
created:
kubectl@adm > kubectl -n rook-ceph get ingress
NAME                      HOSTS                      ADDRESS   PORTS     AGE
rook-ceph-mgr-dashboard   rook-ceph.example.com      80, 443   5m
And the new secret for the TLS certificate:
kubectl@adm > kubectl -n rook-ceph get secret rook-ceph.example.com
NAME                       TYPE                DATA      AGE
rook-ceph.example.com      kubernetes.io/tls   2         4m
You can now browse to https://rook-ceph.example.com/ to
log into the dashboard.
