Tracing
Tracing allows collection of fine-grained details about policy evaluations. It’s a useful tool for debugging issues in your SUSE® Admission Policy Manager deployment and policies.
SUSE® Admission Policy Manager uses Jaeger to receive, store, and visualize trace events.
Policy tracing logs
Prerequisites
You need Cert-Manager and OpenTelemetry. Follow these instructions to install Cert Manager and the OpenTelemetry Operator.
Install Jaeger
Apply the installation steps from the tracing quickstart.
Once the Jaeger operator creates all the resources, there is a Service under
my-open-telemetry-collector.jaeger.svc.cluster.local.
The Jaeger Query UI is reachable at the following address:
https://<CLUSTER_IP>/api/v1/namespaces/jaeger/services/http:my-open-telemetry-query:16686/proxy/searchThis endpoint may be unique depending on your configuration. You can find the endpoint listed for your Jaeger resource under the Services page.
Update rancher-kubewarden-controller with Jaeger endpoint
You’ll need to edit the rancher-kubewarden-controller resource to add the Jaeger endpoint "my-open-telemetry-collector.jaeger.svc.cluster.local:4317".
For instance:
telemetry:
  tracing: true
  mode: sidecar
  sidecar:
    tracing:
      jaeger:
        endpoint: my-open-telemetry-collector.jaeger.svc.cluster.local:4317
        tls:
          insecure: true
The installation of the service, my-open-telemetry-collector, is under the
jaeger namespace.
|
For simplicity, we’re not encrypting the communication between the OpenTelemetry collector and the Jaeger endpoint. This is unsuitable for production deployment. You should you read Jaeger’s documentation. |
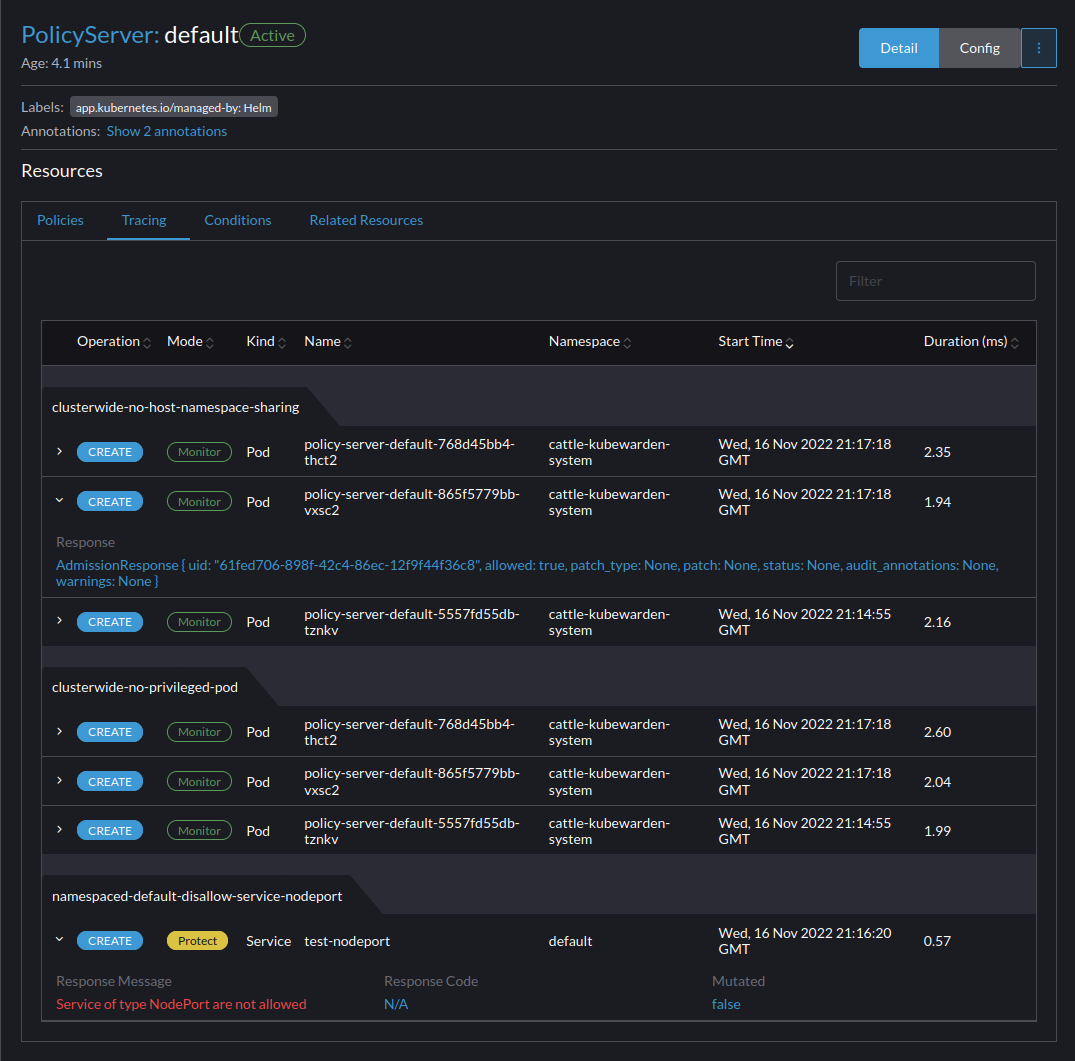
You should now be able to view any failed requests for policies tied to a specific Policy Server. You can also see the detail view for any given policy. You can get a more in-depth view of the traces by using the Jaeger UI.