|
This is unreleased documentation for Vulnerability Scanner 0.13.0-dev. |
Dashboard
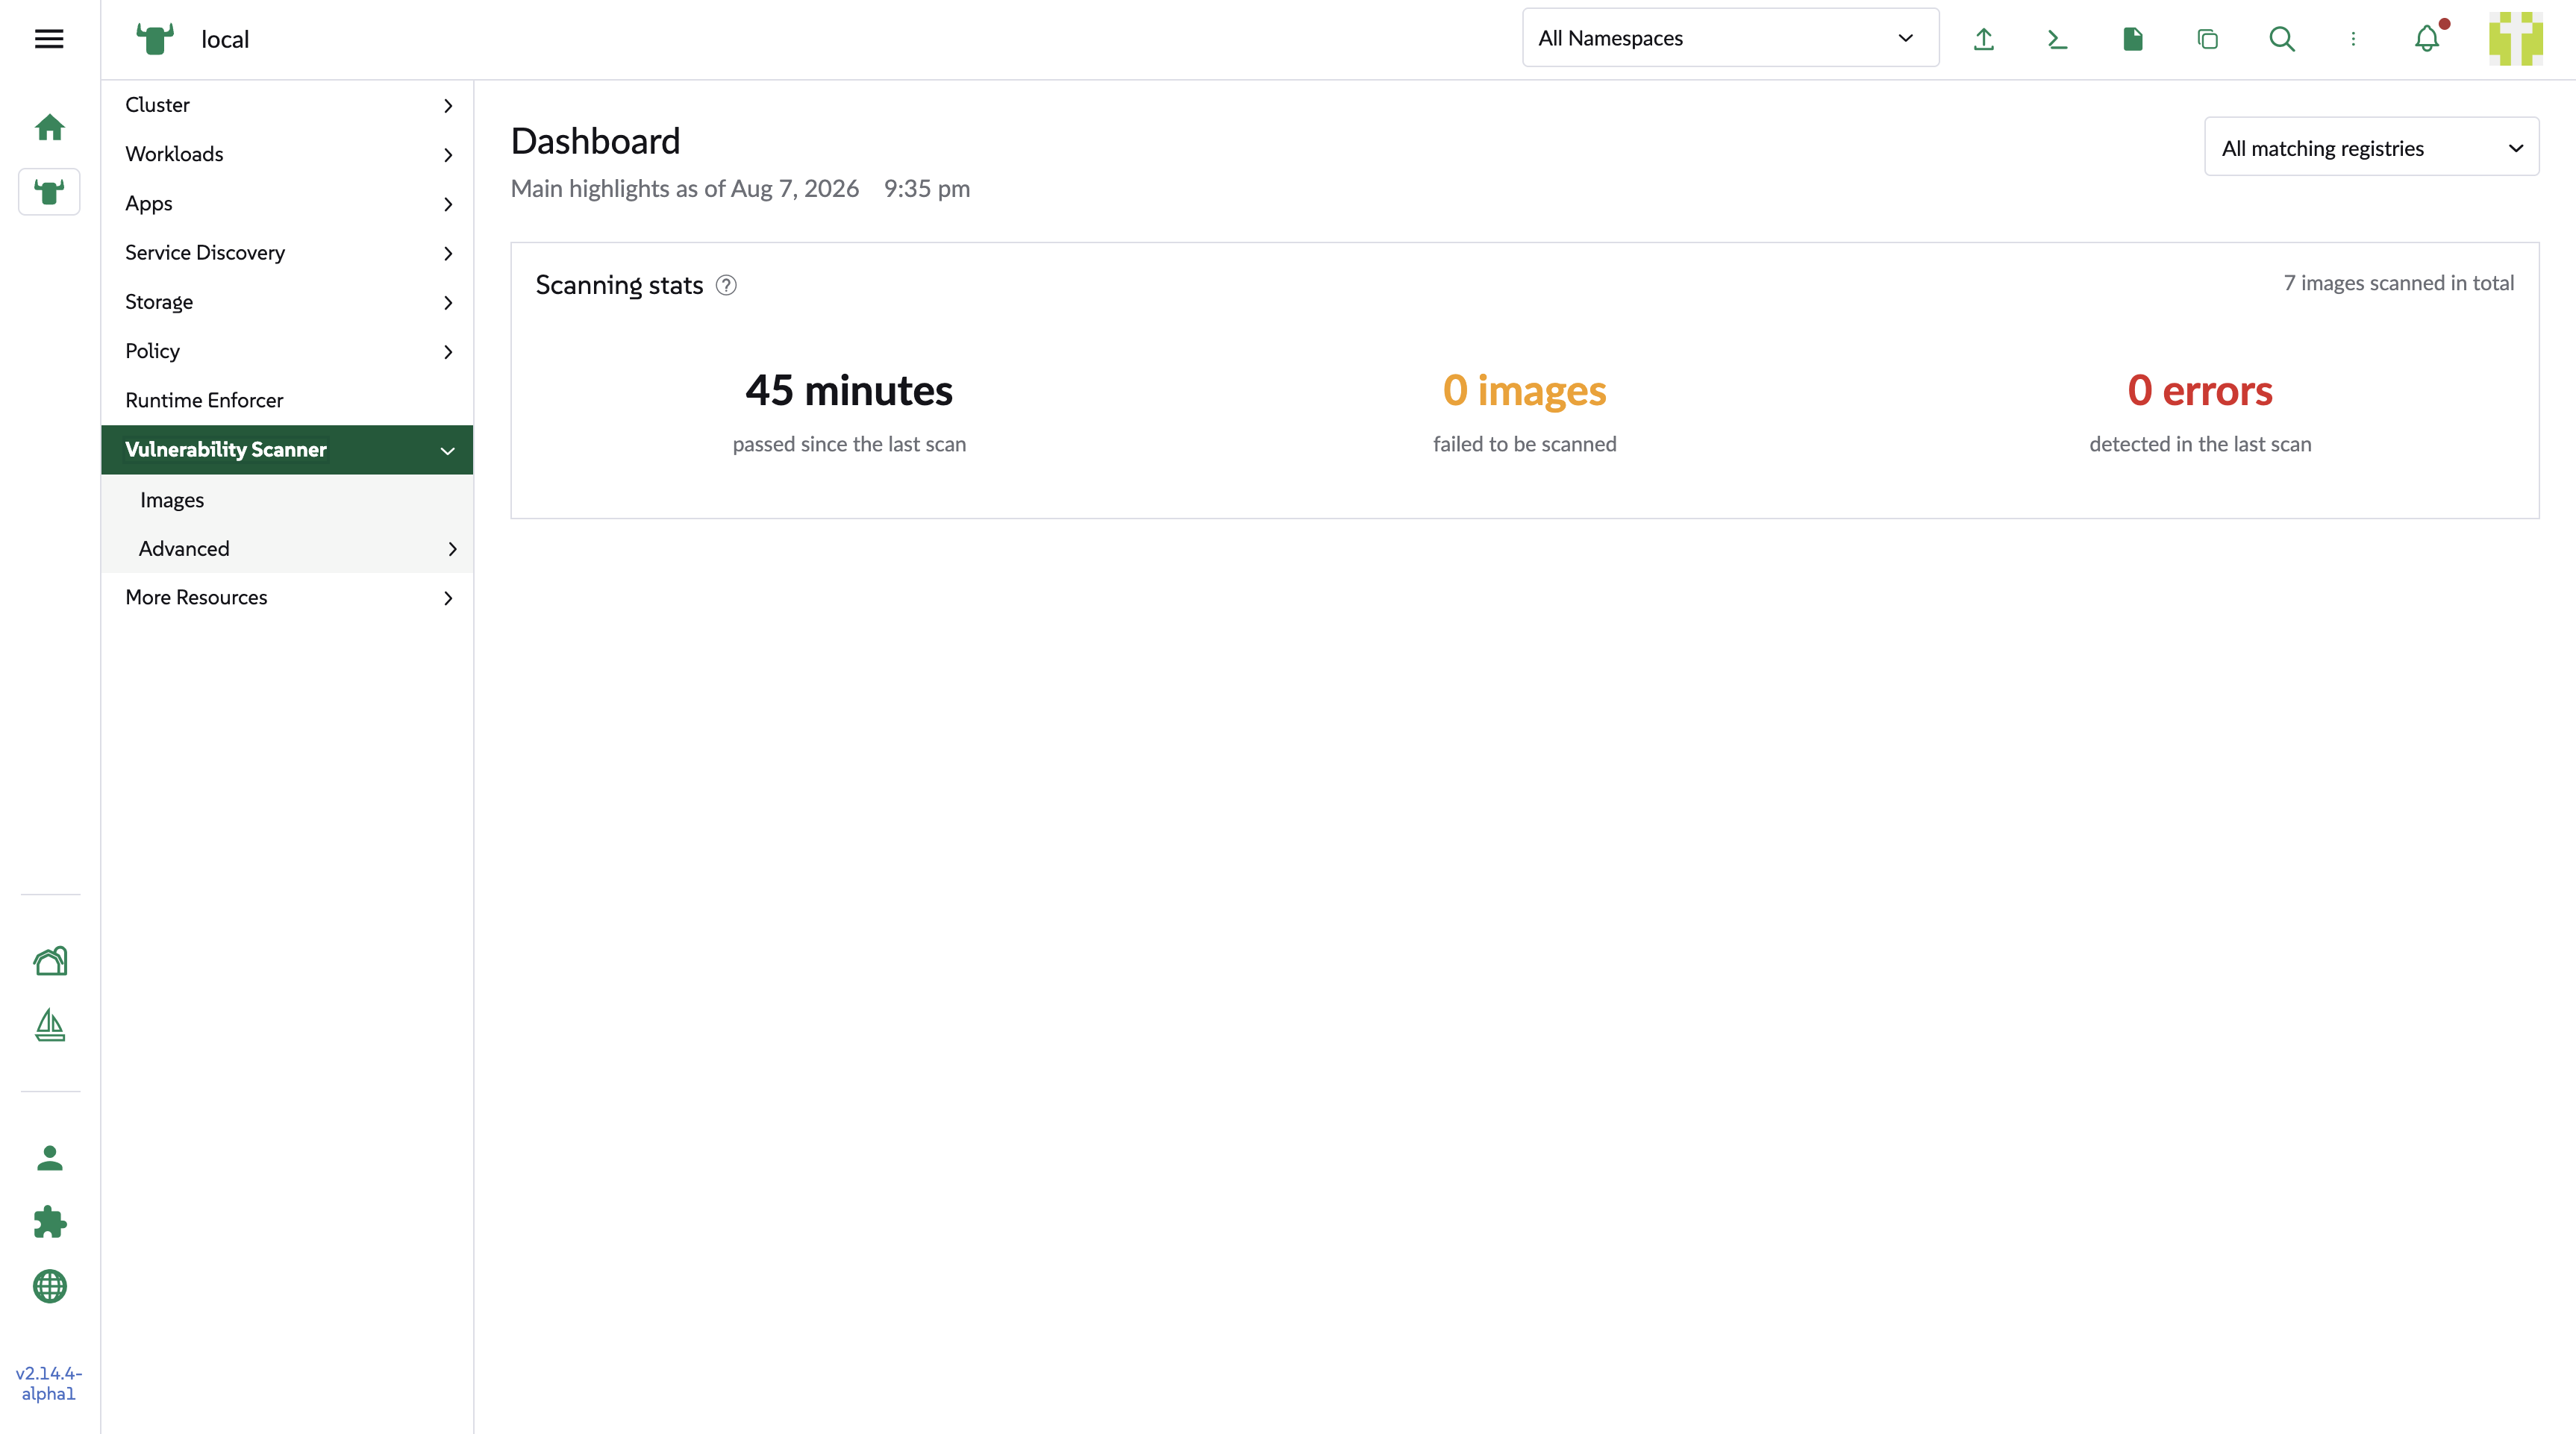
The main menu entry for the SUSE Security Vulnerability Scanner UI extension opens the dashboard. Use the registry filter to restrict the view to the scanning statistics of a single registry.
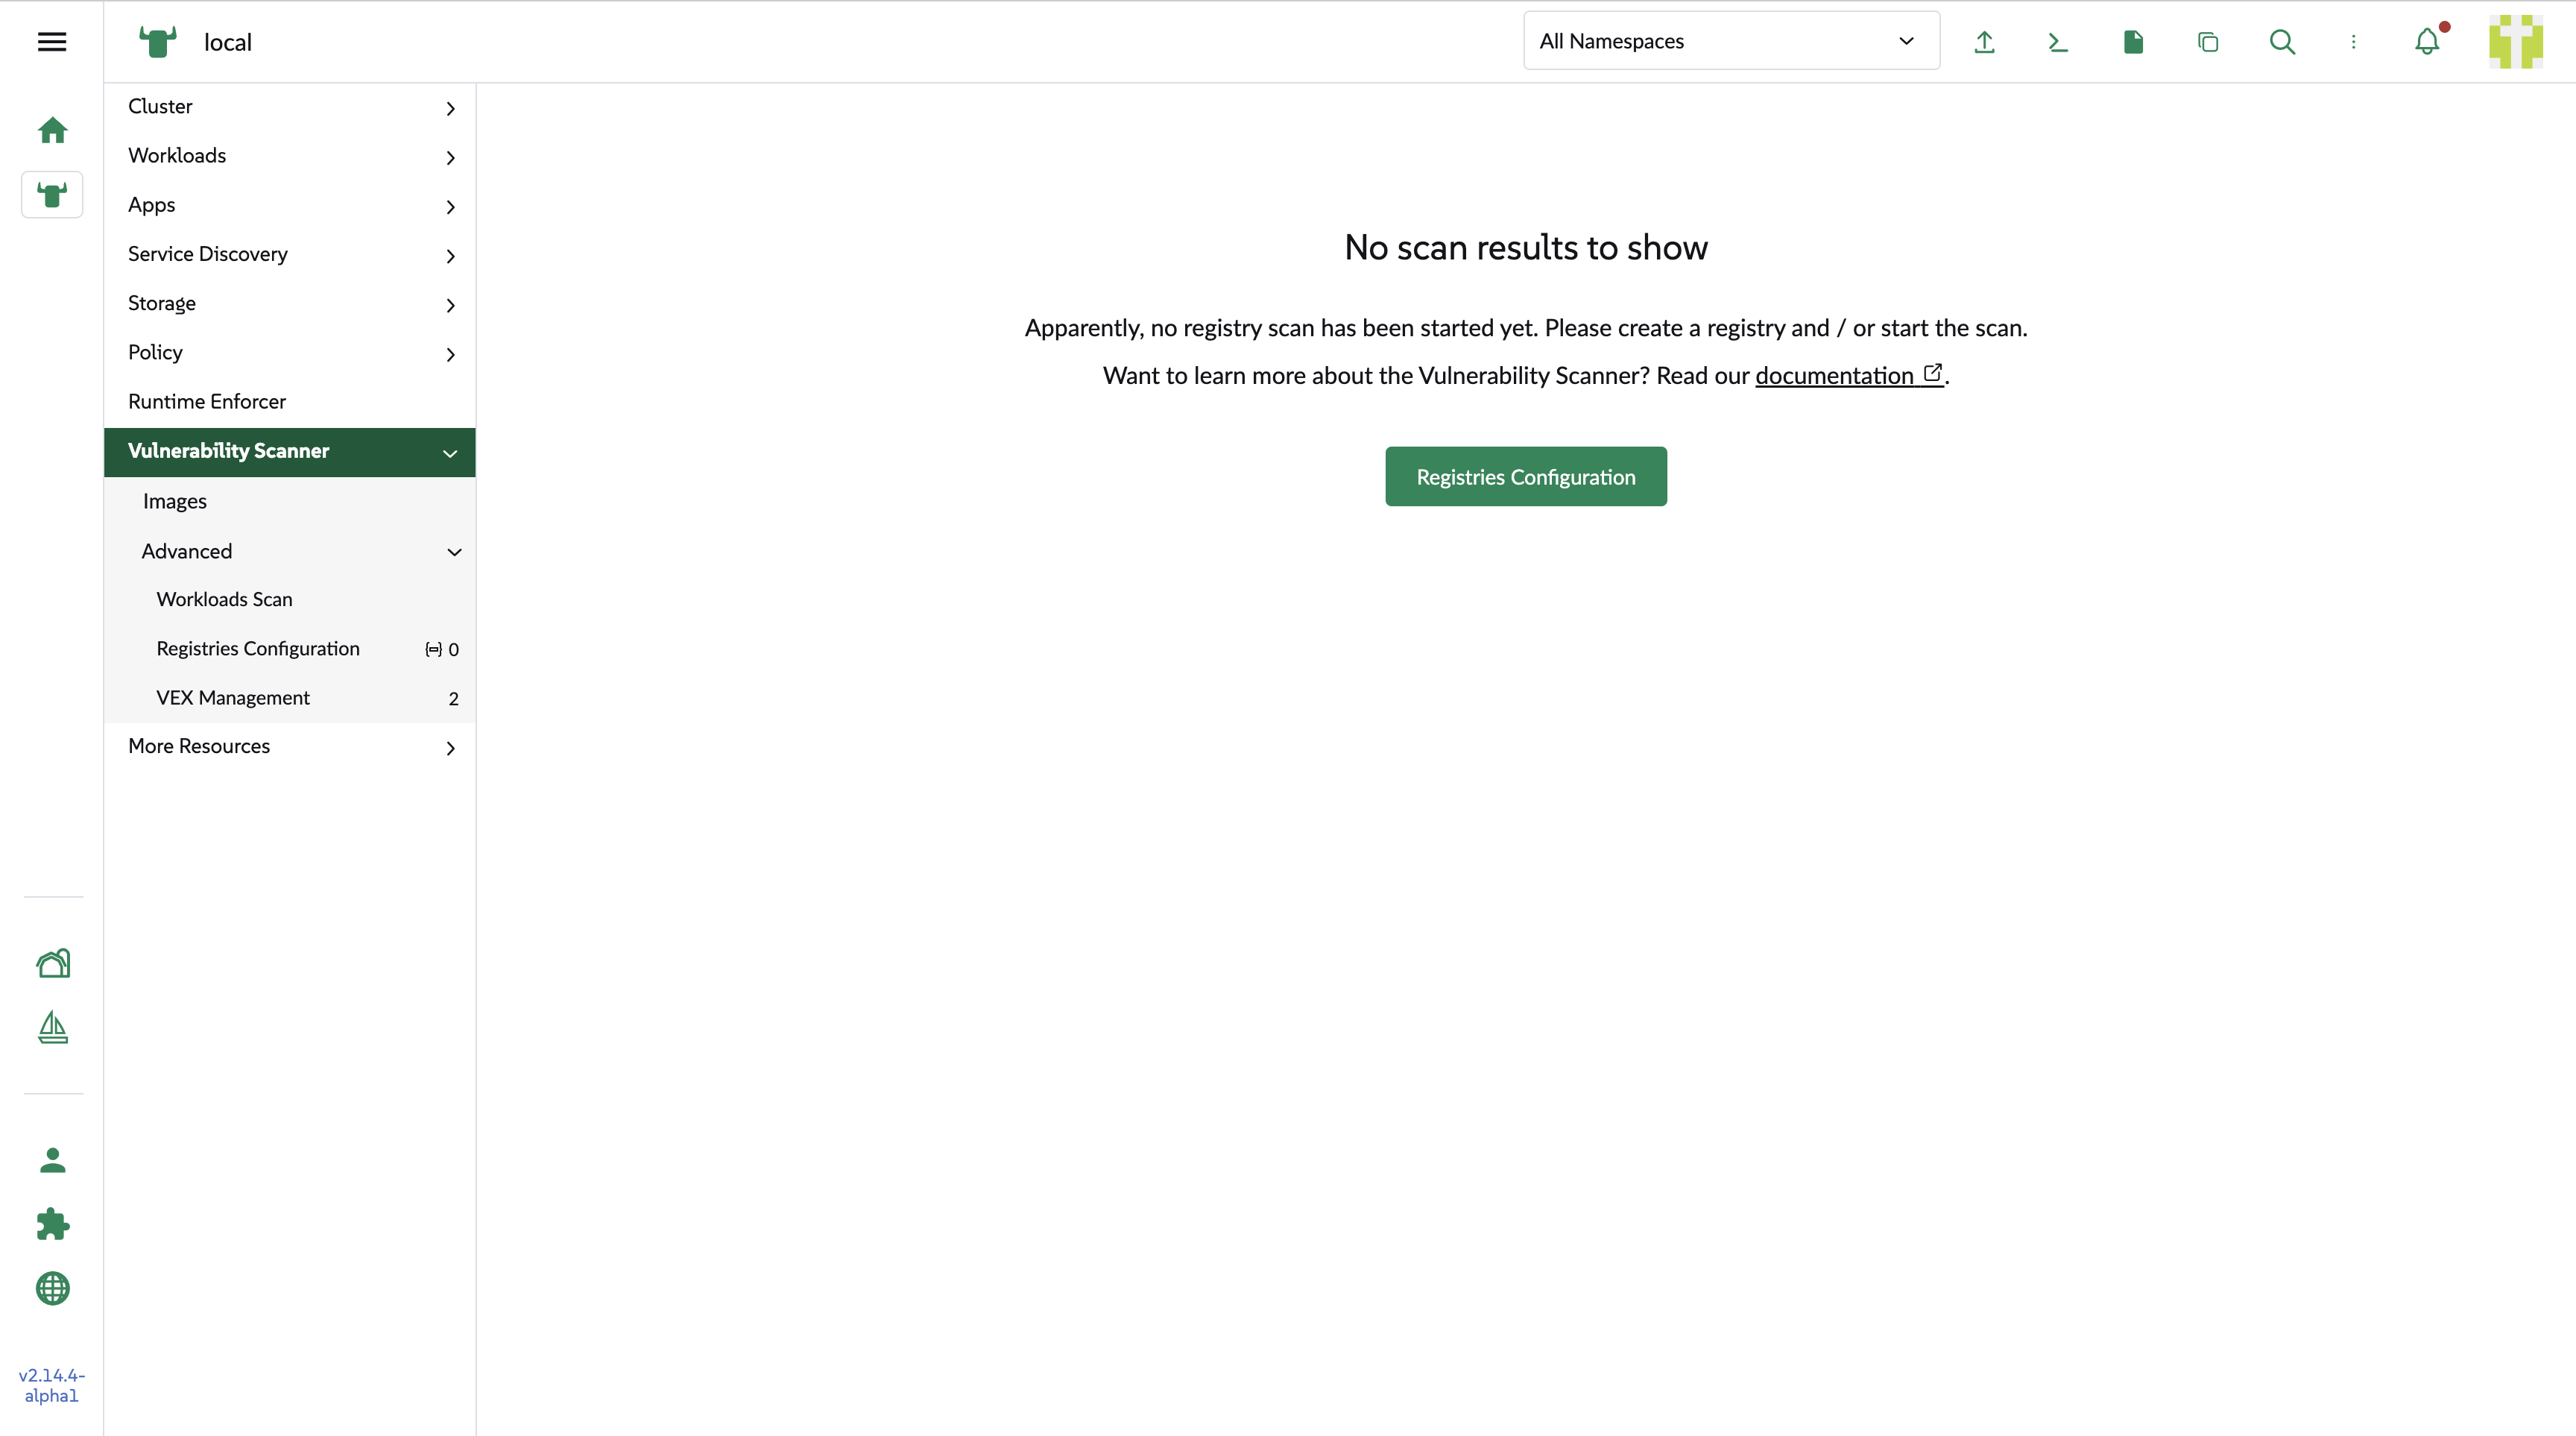
Initial view
Before you configure a registry, the dashboard has no data to display. It shows a button that takes you to the registry configuration page, where you can create your first registry.
Scanning statistics
Once at least one scan has completed, the dashboard shows three statistics, from left to right:
-
How long ago the last scan ran.
-
How many images failed to scan.
-
How many errors occurred across the scan history.
These figures are based on registry scan results only. Workload scan results aren’t included in this panel.
|
To review workload results, use the workload views described in Workload Scan Registries and Workload Interaction. |