11 Central Dashboard
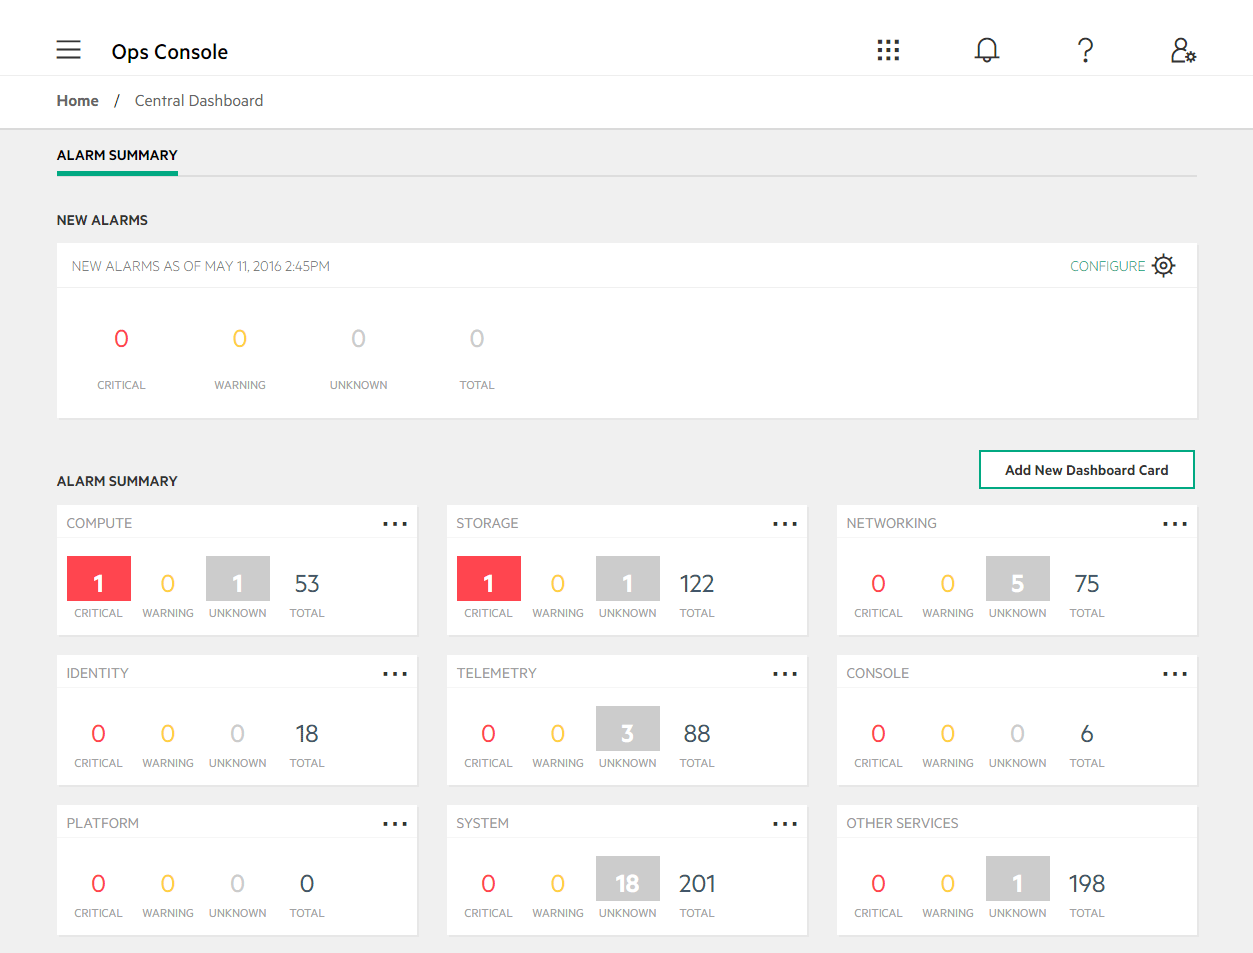
This page displays a high level overview of all cloud resources and their alarm status.
11.1 Central Dashboard #
11.2 New Alarms #
The New Alarms section shows you the alarms that have triggered since the timeframe indicated. You can select the timeframe using the control with options ranging from the Last Minute to Last 30 Days. This section refreshes every 60 seconds.
The new alarms will be separated into the following categories:
- Open alarms, identified by red indicator.
- Open alarms, identified by yellow indicator.
- Open alarms, identified by gray indicator. Unknown will be the status of an alarm that has stopped receiving a metric. This can be caused by the following conditions:
An alarm exists for a service or component that is not installed in the environment.
An alarm exists for a virtual machine or node that previously existed but has been removed without the corresponding alarms being removed.
There is a gap between the last reported metric and the next metric.
- Complete list of open alarms.
- Complete list of alarms, may include Acknowledged and Resolved alarms.
11.3 Alarm Summary #
Each service or group of services have a dedicated card displaying related alarms.
- Open alarms, identified by red indicator.
- Open alarms, identified by yellow indicator.
- Open alarms, identified by gray indicator. Unknown will be the status of an alarm that has stopped receiving a metric. This can be caused by the following conditions:
An alarm exists for a service or component that is not installed in the environment.
An alarm exists for a virtual machine or node that previously existed but has been removed without the corresponding alarms being removed.
There is a gap between the last reported metric and the next metric.
- Complete list of open alarms.
- Complete list of alarms, may include Acknowledged and Resolved alarms.

