Cockpit Guide #
This guide describes the administration of SUSE Linux Enterprise Micro using Cockpit.
1 About Cockpit #
Cockpit is a web-based graphical interface that enables you to manage most of the administration tasks from one place by using plugins. You do not need to create credentials for Cockpit as, by default, Cockpit uses the same credentials that you use to log in to your server. Cockpit uses APIs that already exist on the system without adding a layer to the system.
Cockpit enables you to perform the following tasks:
download container images and run containers
update the server
manage the server storage
inspect and change network settings
manage user accounts
view system logs
create and administer virtual machines
inspect and interact with
systemdservicesswitch between SELinux modes
use a terminal on a remote server in your web browser
2 Getting Cockpit #
Cockpit is included in the delivered pre-built images, or can be installed if you are installing your own instances manually. For details regarding the manual installation, refer to 第 12.9.2 节 “软件”.
Though Cockpit is present in the pre-built images by default, the plugin for
administration of virtual machines needs to be installed manually. You can
do so by installing the microos-cockpit pattern as
described below. You can also use the following command in case Cockpit is not
installed on your system.
# transactional-update pkg install -t pattern microos-cockpitReboot your machine to switch to the latest snapshot.
microos-cockpit pattern may differ according to technologies installed on your system
The plugin Podman containers is installed only if the
Containers Runtime for non-clustered systems patterns
are installed on your system. Similarly, the Virtual
Machines plugin is installed only if the KVM
Virtualization Host pattern is installed on your system.
If the Cockpit instance is intended to serve as a primary one, you need to
enable the Cockpit socket in systemd by running:
# systemctl enable --now cockpit.socket
After running the command, the server will expose the default
9090 port. systemd will start the
cockpit-ws service that listens on the 9090 port.
In case you have enabled the firewall, you must also open the firewall for Cockpit as follows:
# firewall-cmd --permanent --zone=public --add-service=cockpitAnd then reload the firewall configuration by running:
# firewall-cmd --reloadNow you can access the Cockpit web interface by opening the following address in your web browser:
https://IP_ADDRESS_OF_MACHINE:9090
3 Cockpit authentication #
3.1 Authentication #
Cockpit enables you to log in directly to each machine that can expose the 9090 port. If the port cannot be accessed on the particular machine, you can still use Cockpit to administer the machine by using it as a secondary server. For a procedure of adding a server as secondary, refer to Section 3.1.1, “Adding secondary servers”.
The number of secondary servers that you can administer from one primary server is limited to 20. If you need to administer more servers, add other primary servers or use another tool for cluster administration.
To log in to the primary server, enter your credentials on the Cockpit login page. To log in to secondary servers, there are two options. You can access secondary machines after logging in to the primary server, or you can access a secondary machine using the field on the login page.
3.1.1 Adding secondary servers #
To add a server as secondary, proceed as follows:
Log in to the primary server using the account with the system administrator role.
Click on the USERNAME@HOSTNAME in the upper-left corner.
Click .
Fill in the host identification and optionally user name that will be used to log in to the server. You can assign a color to the machine. When the details are complete, click .
Verify a fingerprint on the server you want to add. If the fingerprint matches or if you have not set up the SSH connection, click to proceed.
Fill in the password and, if needed, check . Cockpit will generate a new SSH key for the user and next time you will be logged in automatically.
3.1.2 Logging into secondary servers directly #
You can log in to any secondary server without logging in to the primary server first. This solution can be useful when you do not have credentials for the primary server. The primary server will be used as a bridge, and you will be connected to the secondary server using SSH.
To connect to the secondary server, expand on the login screen of the primary server. Fill in you user name, password and the IP address of the secondary server. If you are trying to log in for the first time, you are asked to verify the fingerprint. After this, click .
4 System overview #
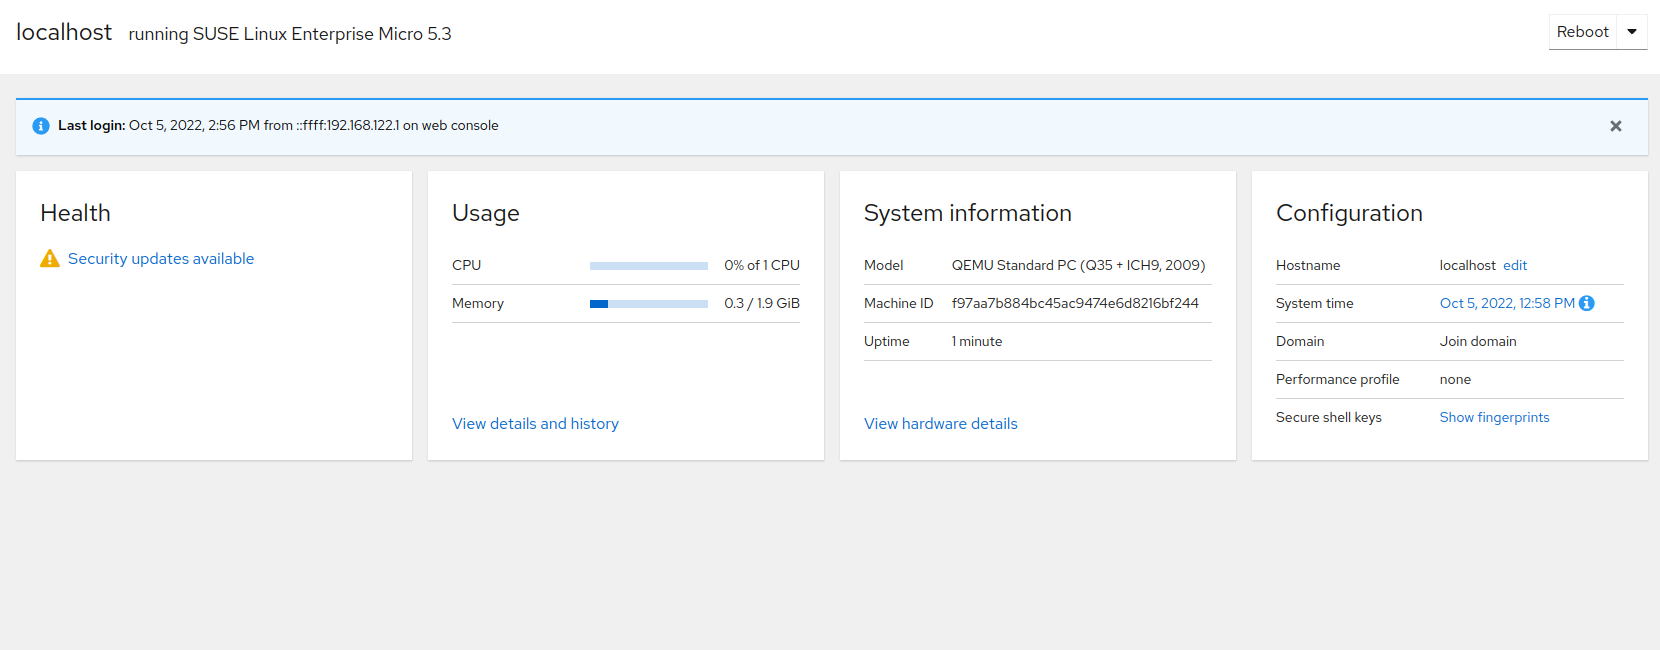
The page provides information about the health of your server, CPU and memory usage and also hardware details. On this page, you can also change the host name, configure the system time and view SSH keys.
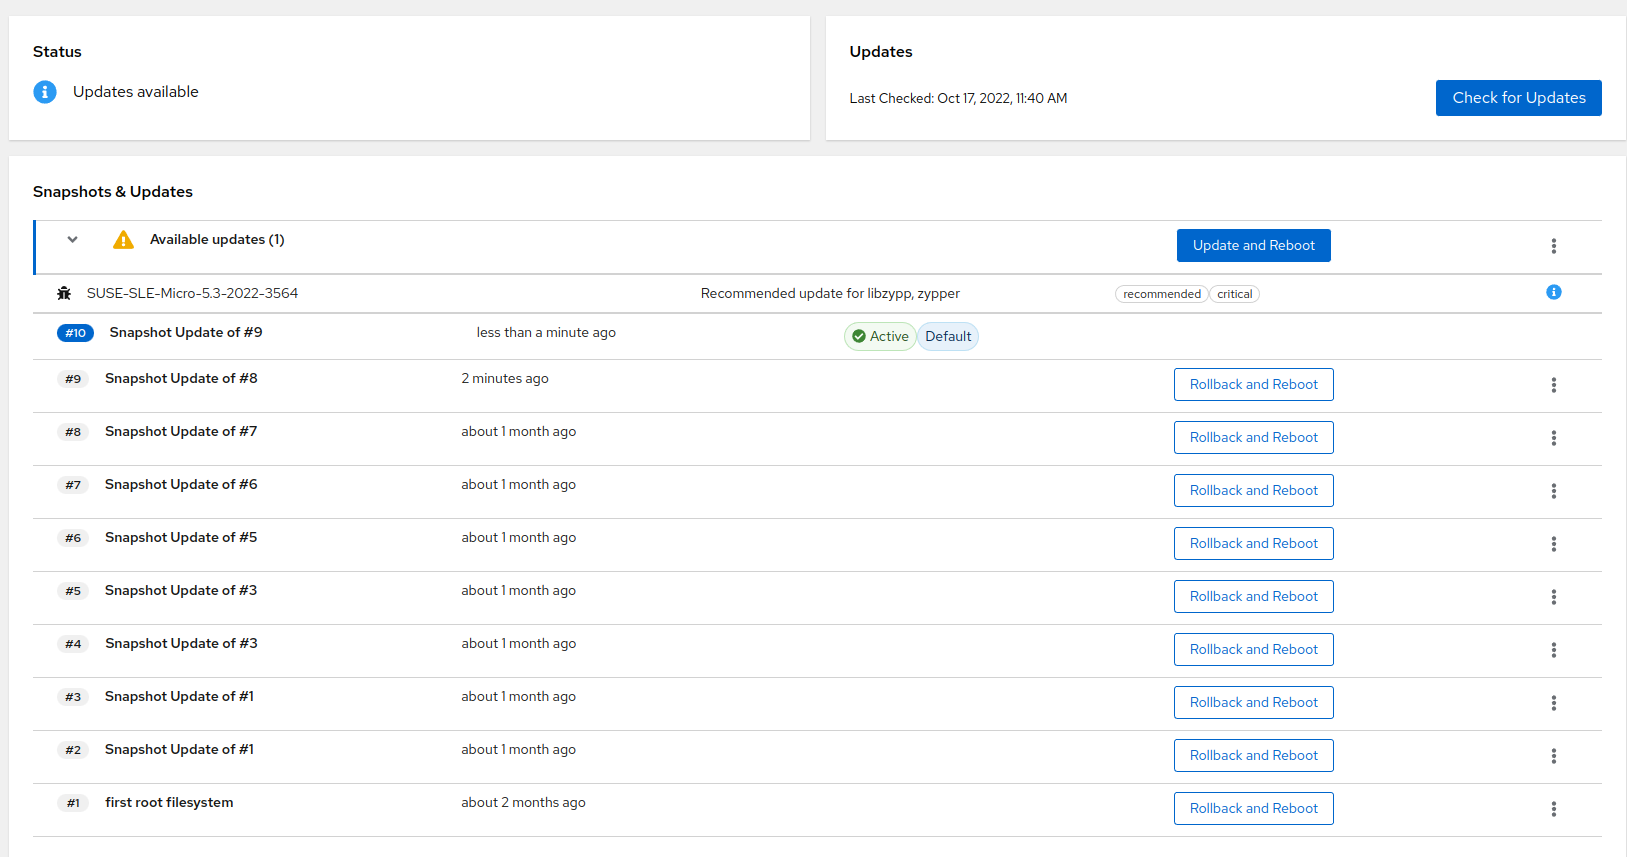
The part displays if your system is up to date or if there are any updates to install. Clicking the displayed statement takes you to . For details, refer to Section 12, “Managing SLE Micro updates and snapshots”.
The part displays CPU and memory usage. For detailed performance metrics, click . Clicking on mount points in takes you to Storage. Clicking on a particular service opens the service details under Services.
In the part, you can perform the following tasks:
change the host name by clicking and entering the required host name
change the system time by clicking on the date and time value. In the popup window, select a time zone or set the time, either manually or by synchronizing it with an NTP server.
view your SSH keys by clicking
5 SLE Micro logs #
After clicking , Cockpit enables you to view logs on your system. You can filter the logs according to the following criteria:
- Time
to filter the logs according to a specific time, you can choose from the following values:
Current boot
Previous boot
Last 24 hours
Last 7 days
- Priority
The standard
syslogseverity levels are used (sorted from most to least severe):- Only emergency
The system is unusable. This is a panic condition.
- Alert and above
This log requires your immediate action.
- Critical and above
Failures in primary systems. You should correct the problem immediately.
- Error and above
Not an urgent error but should be handled within a specific time.
- Warning and above
Not an error but indicates that an error might occur if no action is taken.
- Notice and above
Unusual events that are not errors. No immediate actions are required.
- Info and above
Normal operational messages that serve as a confirmation that the system is working properly.
- Debug and above
These messages are used just to debug the system.
- Identifier
You can filter logs for a particular service, daemon or process. Available identifiers are parsed from the logs currently displayed according to the set filters.
- Filters
You can refine the logs view here according to the following criteria:
- Since
Logs on the specified date or newer will be displayed. You can specify the time the following way:
using the absolute date in the format YYYY-MM-DD
using any of the terms:
yesterday,today,tomorrowandnowusing relative time by prefixing the value with - or + and specifying units. You can use the following units:
secondsors,minutesormin,hoursorh,daysord,weeksorw,monthsorm, andyearsory.
- Until
Logs on the specified date or older will be displayed. You can specify the time the following way:
using the absolute date in the format YYYY-MM-DD
using any of the terms:
yesterday,today,tomorrowandnowusing relative time by prefixing the value with - or + and specifying units. You can use the following units:
secondsors,minutesormin,hoursorh,daysord,weeksorw,monthsorm, andyearsory.
- Boot
Enter an integer: 0 means the current boot, -1 is for the previous boot, 1 for the first boot, 2 for the second, etc.
- Unit
Specify a
systemdunit which logs you want to display. Use one of the formats:_SYSTEMD_UNIT=NAME.serviceCOREDUMP_UNIT=NAME.serviceUNIT=NAME.service
- Free-form search
Enter a string that you want to find in the log messages. You can also use PERL-compatible regular expressions. Alternatively, you can filter messages according to message log fields in the format FIELD=VALUE, for example,
CODE_LINE=349displays logs with this value.
6 Managing storage #
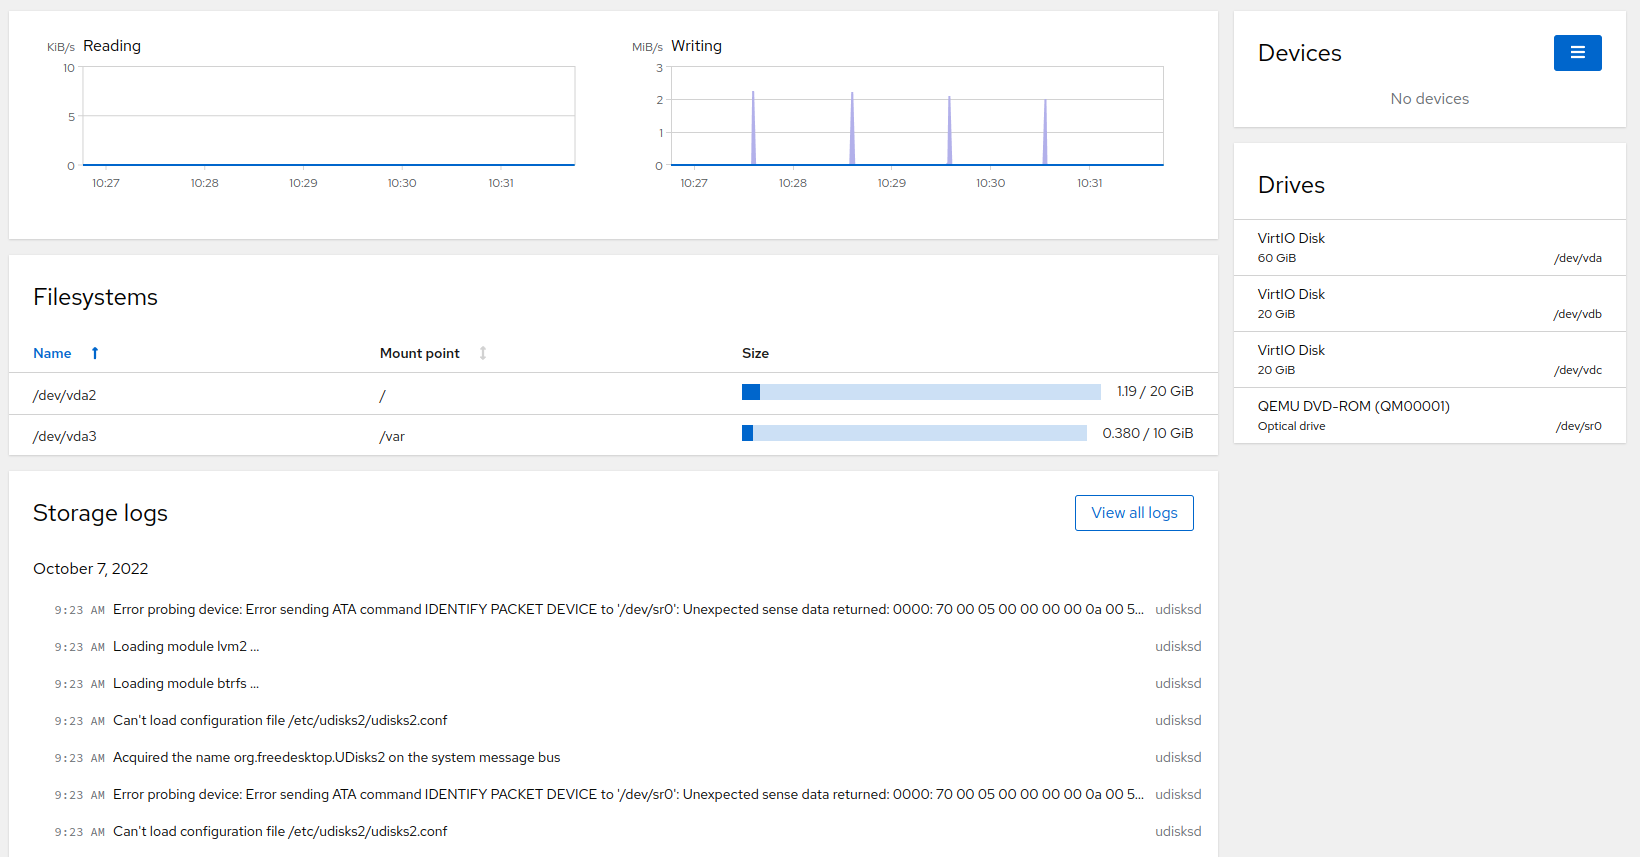
The page enables you to monitor traffic on your drives, repartition your system, view storage logs and create RAIDs or LVM.
6.1 Monitoring data flow on disks #
The graphs on the page display reading and writing data flow to devices. Each device in the graph has a different color. Hover over the displayed data flow peak to identify the device name.
6.2 Managing file systems #
The view enables you to create a partition table and to format or mount file systems. You can sort the mounted partition according to or . Click on the particular file system to open the details window.
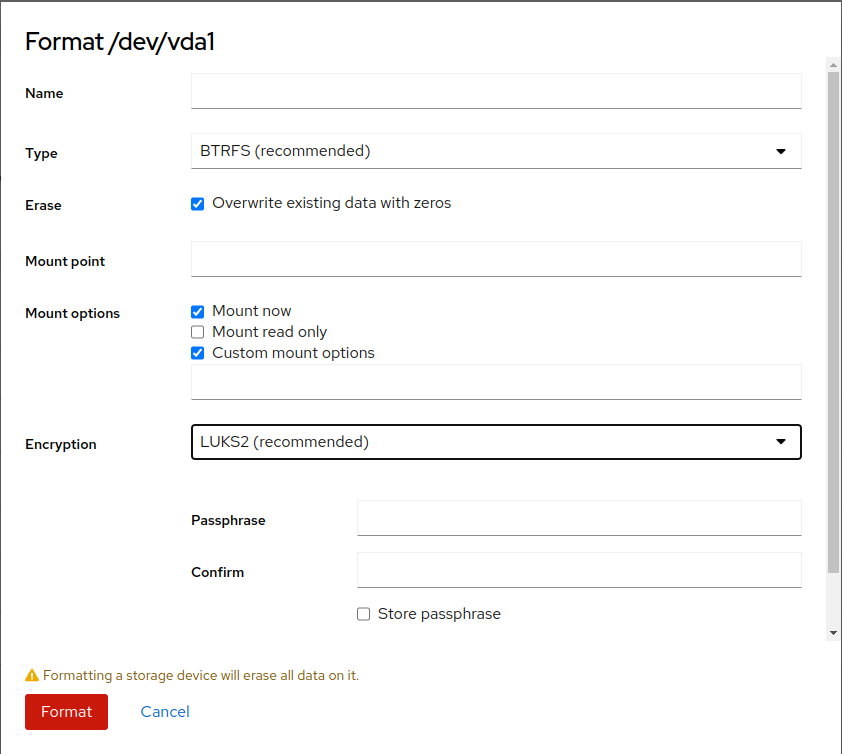
To format the partition, click next to the particular partition description to open the format window.
You can specify the following details:
- Name
Enter a unique name of the partition.
- Type
Select the file system. BTRFS is mandatory for the
/partition.- Mount point
This is a mandatory option. Specify to which directory the partition will be mounted.
- Mount options
In the text field, you can enter a comma-separated list of options. For common options, refer to File system Independent Mount Options. Those options are used in the
optionspart of the/etc/fstabfile.- Encryption
Select the encryption method or do not encrypt the partition. If you choose any of the encryption methods, the following fields appear:
- Passphrase and Confirm
Enter a passphrase to unlock the encrypted partition.
- Store passphrase
The passphrase is stored in
/etc/luks-keysand you are not asked for the passphrase on next boot.- Custom encryption options
You can pass a list of options described in supported encrypted options.
After you specify all required details, click to proceed.
If a partition is already formatted, you can mount it by clicking . Here you can change the mount point and mount options. To proceed, click .
6.3 Managing NFS mount points #
Use the view to add, edit or delete NFS mounts.
To add an NFS mount point, after clicking on the plus icon, specify the following details:
- Server address
Provide the IP address or name of the NFS server.
- Path on server
Select the available path on the NFS server that can be mounted.
- Local mount point
Specify a directory on the local system where the path will be mounted to.
- Mount options
Check any of the options:
– to mount the path automatically after each system start or restart.
– you will not be able to perform changes to the data on the NFS path.
is a comma-separated list of the
mountcommand options.
To edit an NFS mount, click on the particular NFS mount. On the next screen, click and specify the details described in NFS mount details.
6.4 Software RAID management #
The view enables you to add or manage RAIDs.
6.4.1 Creating RAIDs #
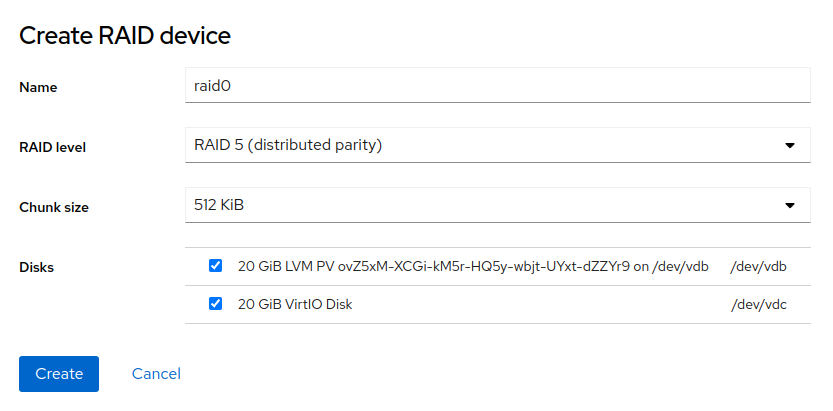
You can create RAIDs of different levels on your system from the part by selecting the option in the hamburger menu.
Enter the following parameters of the RAID:
- Name
Enter a unique name of the RAID.
- RAID level
Select one of the following RAID levels:
- RAID 0
has the data split evenly to two or more disks. Such a solution provides higher performance because you can read data from several disks simultaneously, but does not provide any fault tolerance. You need to have at least 2 disks.
- RAID 1
is a mirror. Data are kept in exact copies on several disks. If there is a failure on one disk, you can use data on another disk. Typically, this RAID level uses 2 disks.
- RAID 4
provides striping and a dedicated disk for parity. You need to have at least 3 disks.
- RAID 5
provides striping, the parity data are distributed on all disks. The minimum number of disks is 3.
- RAID 6
provides striping and two parity blocks distributed across disks. The minimum number of disks is 4.
- RAID 10
is a combination of striping and mirroring. Each stripe is mirrored to another disk. The minimum number of disks is 4.
- Chunk size
The size of chunks. A chunk is the minimum amount of data read or written to each data disk in the array during a single read/write operation.
- Disks
Select the disks that should be included in the RAID. The required number of disks depends on the selected RAID level.
Confirm the parameters by clicking . The RAID then appears in the part.
6.4.2 Modifying RAIDS #
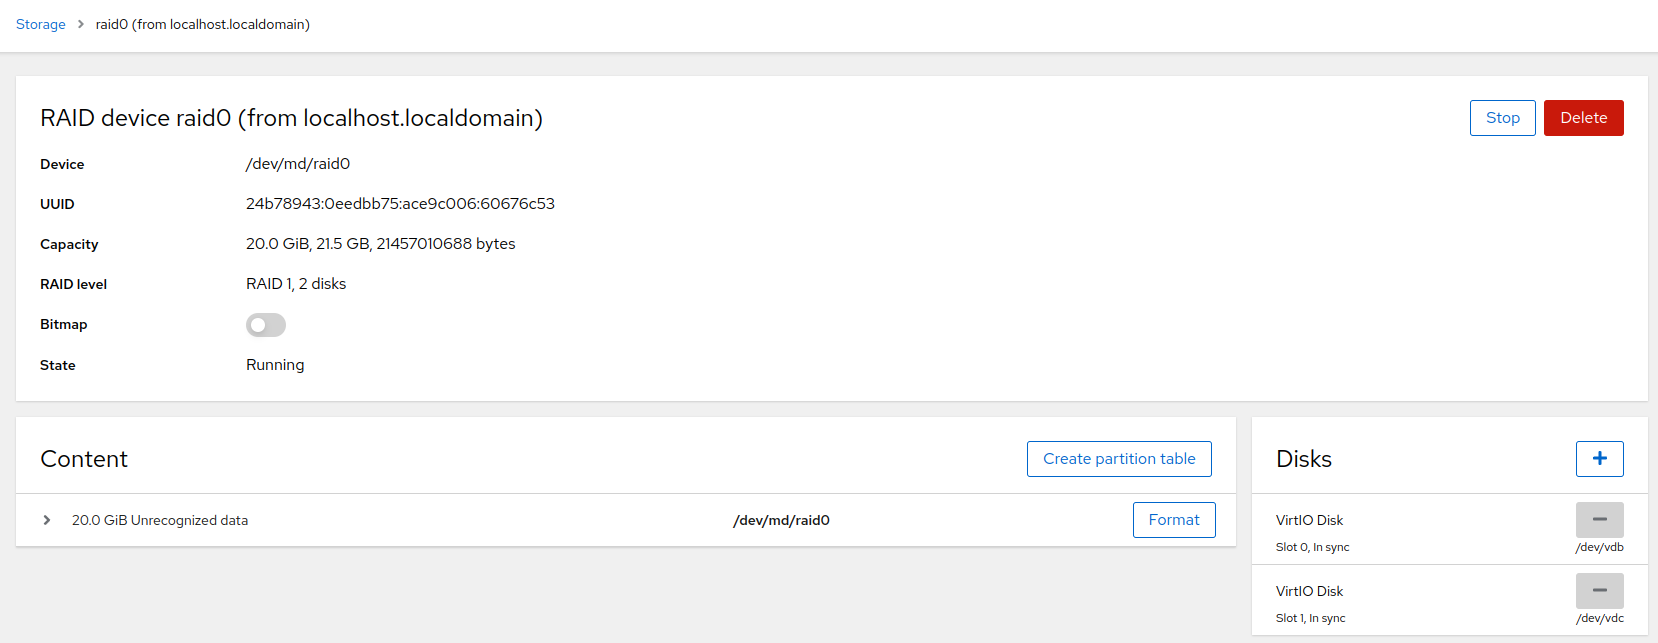
Click the RAID in to open the RAID details view. In the detailed view, you can stop or delete the RAID, add or remove disks and format the device.
With some RAID levels, you can switch on the option that enables you to synchronize only the changes after a disk is temporarily disconnected. If the is off, all data on the disk will be synchronized.
You can remove and add disks in the part. After any change to the array, the system undergoes resynchronization that might take some time. Keep in mind that each RAID level requires a minimum number of disks, therefore, Cockpit does not allow removing the disks that are required by the particular RAID level.
The view enables you to create a partition table (either MBR or GPT), format the disks and mount the RAID.
6.5 Logical volume management #
Using Cockpit, you can create thinly provisioned logical volumes or logical block devices. To do so, create a volume group of disks by selecting in the hamburger menu in .
Enter the volume group name and select disks that will be part of the volume group. Confirm the data with . The volume group appears in the view. Now you can create a logical volume (either a block device or a pool of thinly provisioned volumes). To create a logical volume, proceed as follows:
If you created a block logical volume, you need to format the volume by clicking and filling the details as described in Formatting partitions parameters.
If you created a pool of thinly provisioned volumes, you can create a thin volume by clicking .
Enter a unique name, select the size of the volume, and confirm by clicking . You can create several volumes of the particular volume group by clicking again. Format the volumes by clicking and filling the details as described in Formatting partitions parameters.
Other actions on a particular volume are available in the three dots menu: , or .
Shrinking or growing a volume is available by clicking on or in the particular volume details. These features are not available for all file systems and volume types.
7 Managing networking #
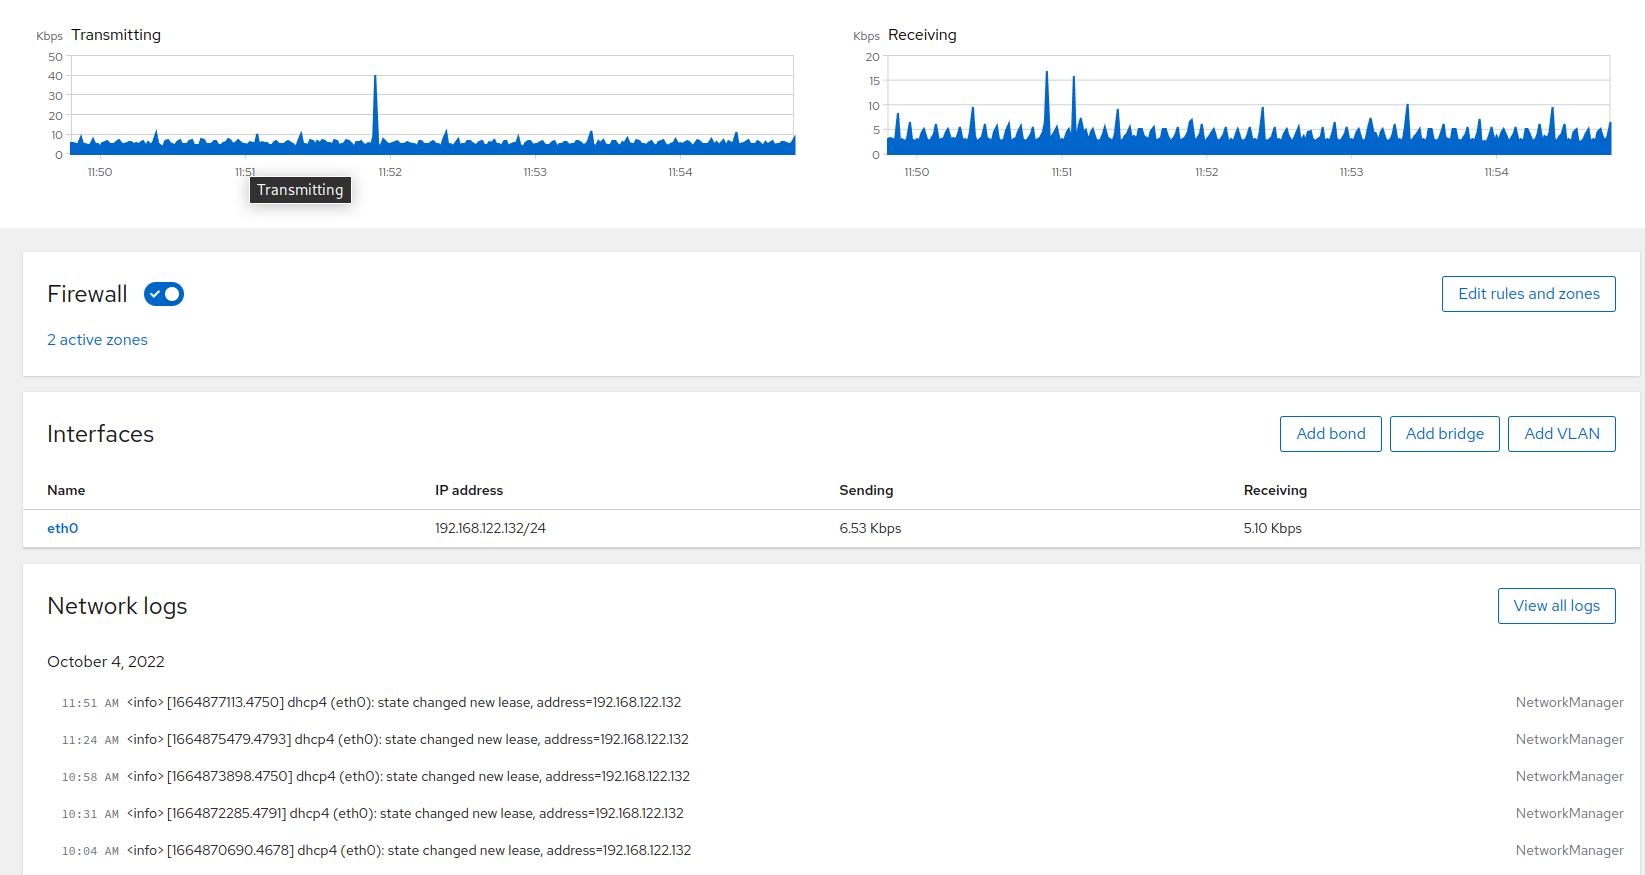
After clicking , you can view traffic on your system, manage firewall, manage network interfaces or view network logs.
7.1 Firewall #
Using firewall along with Podman may result in missing Podman-related firewall rules after reloading the firewalld service. Therefore, it is recommended to keep the firewall in its default setting (disabled) if you intend to use Podman.
cockpit service is not included in the
If you turn on the firewall, add the cockpit service to
the , otherwise the Cockpit web UI might get
disconnected.
The view enables you turn on the firewall, which is off by default. After turning it on, you can edit firewall rules and zones by clicking .
To add a service to an existing zone, click . Then select a service from the list and confirm with .
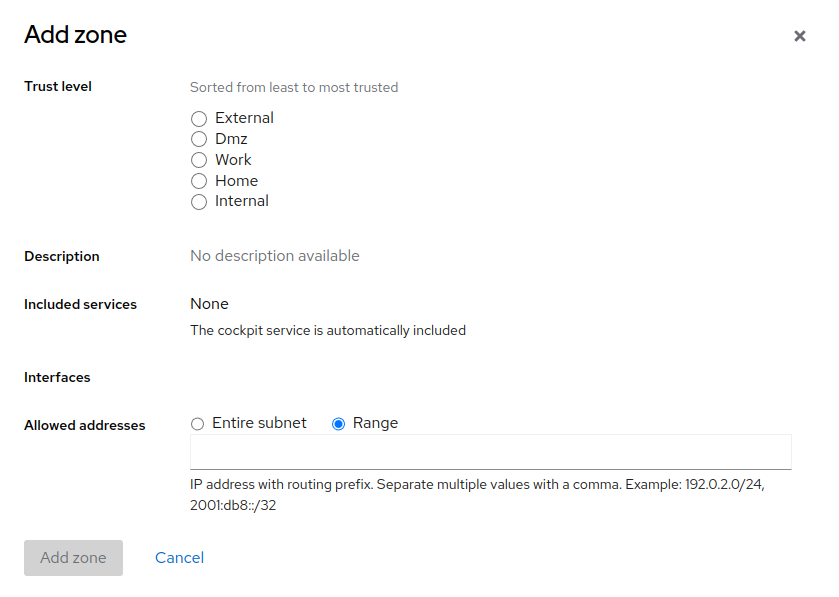
If you need to define a zone on top of the currently available zones, click . In the window, select . Each trust level of network connections has a predefined set of included services (the Cockpit service is included in all trust levels). You can also allow addresses from the entire subnet within the particular trust level, or you can define a specific range of allowed IP addresses as a comma-separated list.
7.2 Interfaces #
In the part, you can add, modify or delete VLANs, bridges or bond interfaces.
7.2.1 Managing bonds #
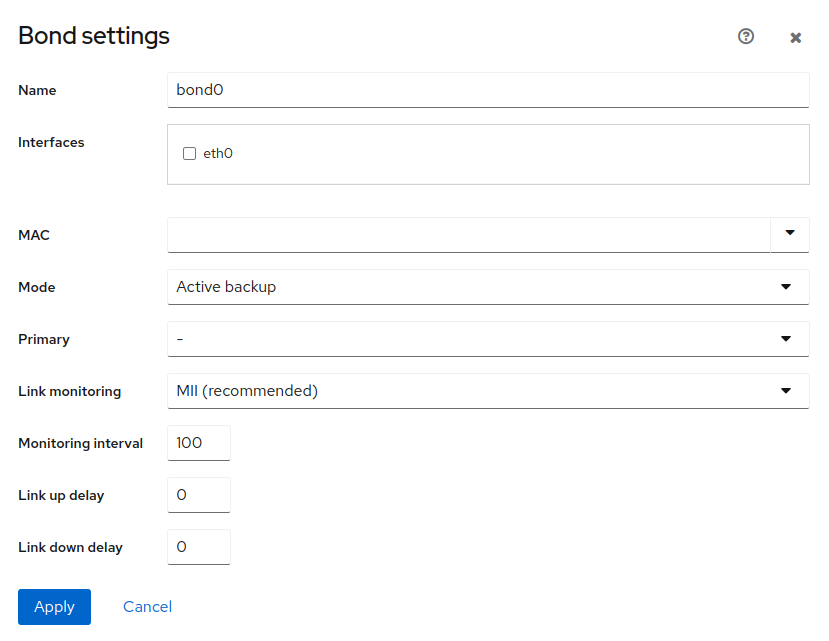
A bond interface is a combination of several network interfaces into one bond. Depending on the (described further), network bonding can increase performance by increasing the network throughput and bandwidth. Network bonding can also increase fault tolerance by keeping overall connectivity even if some of the bonded interfaces stopped working. To add a bond interface, click .
Specify the following parameters of the bond interface:
- Name
Enter a unique name of the interface.
- Interfaces
Select which network interfaces should be grouped in the bond.
- MAC
You can either select a specific MAC address of the underlying interface, or you can use any of the following options:
- Permanent
Use the permanent hardware address if the device has a MAC address.
- Preserve
During the bond activation, the MAC address is not changed.
- Random
A random MAC address is created on each connection attempt.
- Stable
Creates a hashed MAC address.
- Mode
Keep the default mode or select any of the following modes:
- Round Robin
Transfers packets from the first available interface to the last. The mode offers fault tolerance and load balancing.
- Active Backup
Only one interface in the bonding is active. If the active interface fails, the backup will be activated.
- Balance XOR
Balancing using a transmit hash policy. The default is a modulo device count. To select a different policy, specify the
xmit_hash_policyoption in the field.- Broadcast
Everything is transmitted on all interfaces.
- 802.3ad Dynamic Link Aggregation
Creates aggregation groups that share the same speed and duplex settings.
- Adaptive Transmit Load Balancing
A channel bonding that does not require any special switch support. The outgoing traffic is distributed according to the current load on each interface.
- Adaptive Load Balancing
Includes adaptive transmit load balancing and receive load balancing, no special switch support is required.
- Primary
This selection is available only for the Active Backup mode. You can select a particular interface that will be used as primary, while other interfaces in the bond are used as secondary.
- Link monitoring
Select the type of link monitoring.
- Monitoring interval
Specifies the intervals at which the particular link monitor performs checks. The value is in ms.
- Link up delay
Define the time in ms for how long the bond is disabled after a link has been activated. The value should be a multiple of the value, otherwise it will be rounded to the nearest value. Available only for the MII link monitor.
- Link down delay
Define the time in ms for how long the bond is disabled if a link failure has been detected. The value should be a multiple of the value, otherwise it will be rounded to the nearest value. Available only for the MII link monitor.
- Monitoring targets
Specify the list of host IP addresses that you want to monitor. Available only for the ARP link monitor.
To modify or delete a bond interface, click on the particular bond name to open the details. There you can change the parameters of the bond described below.
- Bond
Select a MAC address from the list.
- Connect automatically
The bond connects automatically by default. Uncheck the box to disable the automatic connection.
- IPv4 and IPv6
After clicking , you can set an IP address and configure a specific DNS, DNS search domain and Routes.
- MTU
After clicking , you can specify a particular value of the maximum transmission unit in bytes.
- Bond
After clicking , you can edit the same parameters as when you were creating the bond interface.
7.2.2 Managing bridges #
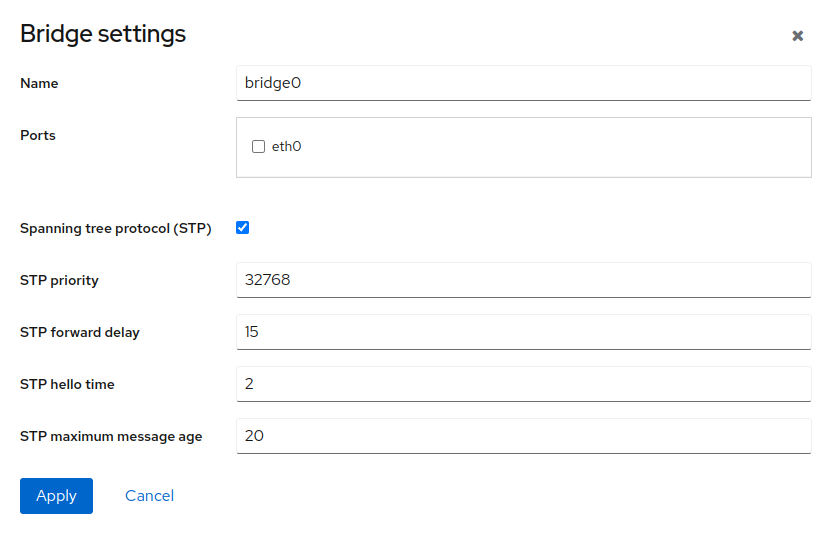
A network bridge is a device that creates a single aggregated network from multiple networks. To create a bridge, click .
Specify the following:
- Name
Specify a unique name of the bridge.
- Ports
Select interfaces to be included in the bridge.
- Spanning tree protocol (STP)
STP is a network protocol used for Ethernet networks that prevents bridge loops by setting a preferred link whenever network switches are connected with several links. This preferred link is used for all Ethernet traffic unless it fails. In that case, a redundant link is used instead. For details regarding STP, see STP.
If you enable the STP protocol, you can edit the following settings:
- STP priority
the lower the priority, the higher the probability of the switch to become the root switch.
- STP forward delay
Specify the time spent in the listening and learning state (in seconds). The default value is 15 s, but you can use any value between 4 and 30 s.
- STP hello time
Specify the time between each bridge protocol data unit (BDPU) that is sent on a port (in seconds). The default value is 2 s, but the recommended range is 1 to 10 s.
- STP maximum message age
Specify the maximum length of time that passes before a bridge port saves its configuration BPDU information.
To modify or delete a bridge, click the bridge name to open the details.
There you can edit the following details:
- General
The bridge connects automatically by default. To disable the automatic connection, uncheck the option.
- IPv4 and IPv6
After clicking , you can set the IP address and configure a specific DNS, DNS search domain and Routes.
- Bridge
By clicking , you can edit all parameters of the bridge.
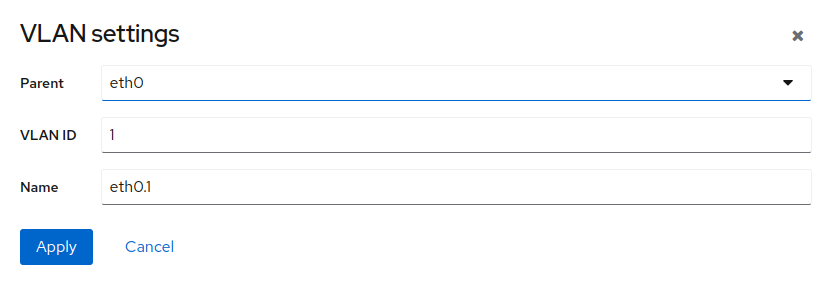
7.2.3 Managing VLANs #
A virtual local area network is a logical subnetwork that groups devices from different physical LANs.
To create a VLAN, click and select the parent interface, assign an ID number and provide a name for the VLAN.
To modify or delete a VLAN, click the VLAN name.
8 Working with containers #
After the first login to Cockpit, you need to start Podman. Keep the default check box selected to start Podman automatically on each boot.
The page enables you to pull images from registries and manage your container. You can also filter the view by entering a filter criterion into the filter field.
8.1 Getting container images #
To start a container, you need a container image. Click to open a search box for images.
In the search box:
choose a preferred image registry or proceed with
All
      registries
define the . The default value is
latestfill in the image name or description
Cockpit suggests possible images according to the entered name, registry and tag. Select the desired image and click .
SLE Micro comes with a predefined set of registries. If you need to use a
custom registry, configure Cockpit to display them. Add the custom
registry to the file /etc/containers/registries.conf
to the registries list. For example, you can add
registry.example to the list as follows:
registries = ["registry.opensuse.org", "docker.io", "registry.example"]
You can also get container images using Podman by running the
podman pull command. For details, refer to
Podman Guide.
8.2 Managing containers #
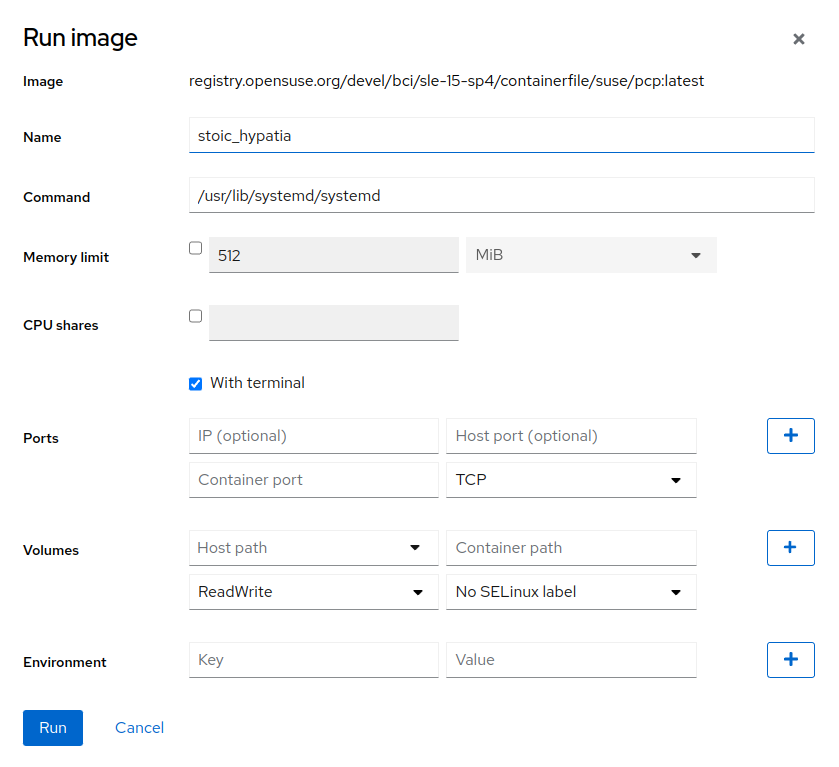
After you get an image, you can start a container based on that image by clicking the button next to the image information.
In the window, enter the container details as described below.
- Name
You can define a custom name for the container. If not specified, the generated value is used.
- Command
Defines a command that is run inside the container, for example,
/usr/lib/systemd/systemdor/bin/bash.- Memory limit
You can limit maximum memory consumption of the container by checking the box and specifying the limit.
- With terminal
The container will not run in the detached mode.
- CPU shares
specify the weight of the container to use CPU time. The default weight is 1024. The weight applies only if containers are under high load. If tasks in one container are idle, other containers may use its CPU time.
If you have four containers, two of them have CPU shares of 512 and the other two have 1024. Thus, under high load the containers with lower CPU shares get only 16,5% of CPU time, while those with 1024 CPU shares get 33% of CPU time.
- Ports
You can publish ports of the container to the host. If you do not provide the host IP address, the port will be bound to all host IP addresses. If you omit the host port number, a random port is assigned.
To publish a port for both protocols (TCP and UDP), enter the same port number twice, just select different protocols.
- Volumes
Maps the volumes on the host system to the paths in the container. The
Container pathmust be an absolute path inside the container. If it does not exist, the directory will be created.- Environment
Enables passing environment variables to the container.
After expanding the container details, you can perform the following tasks:
access a terminal of the container in the tab
view the container logs in the tab
delete the container by clicking the trash bin button
commit changes performed to the container, for example, installing packages to the container
start the container by clicking
restart the container, either by regular , where processes running inside the container are stopped, or by , where the processes are killed, and you might lose data
stop the container, either by regular , or . When using , the state of all processes in the container is written to the disk and after the next start, the container is restored to the same point before stopping.
9 Users administration #
Only users with the role can edit other users.
Cockpit enables you to manage the users of your system. Click to open the user administration page. Here you can create a new account by clicking or manage already existing accounts by clicking on the particular account.
9.1 Creating new accounts #
Click to open the window that enables you to add a new user. Fill in the user's login and/or full name and password, then confirm the form by clicking .
To add authorized SSH keys for the new user or set the role, edit the already created account by clicking on it. For details, refer to Section 9.2, “Modifying accounts”.
9.2 Modifying accounts #
After clicking the user icon in the page, the user details view opens, and you can edit the user.
In the user's details view, you can perform the following actions.
- Delete the user
Click to remove the user from the system.
- Terminate user's session
By clicking , you can log a particular user out of the system.
- Change user's role
By checking/unchecking the check box, you can assign or remove the administrator role from the user.
- Manage access to the account
You can lock the account, or you can set a date when the account will expire.
- Manage the user's password
Click to set a new password for the account.
By clicking , the user will have to change the password on the next login.
Click to set whether or when the password expires.
- Add SSH key
You can add an SSH key for passwordless authentication via SSH. Click , paste the contents of the public SSH key and confirm it by clicking .
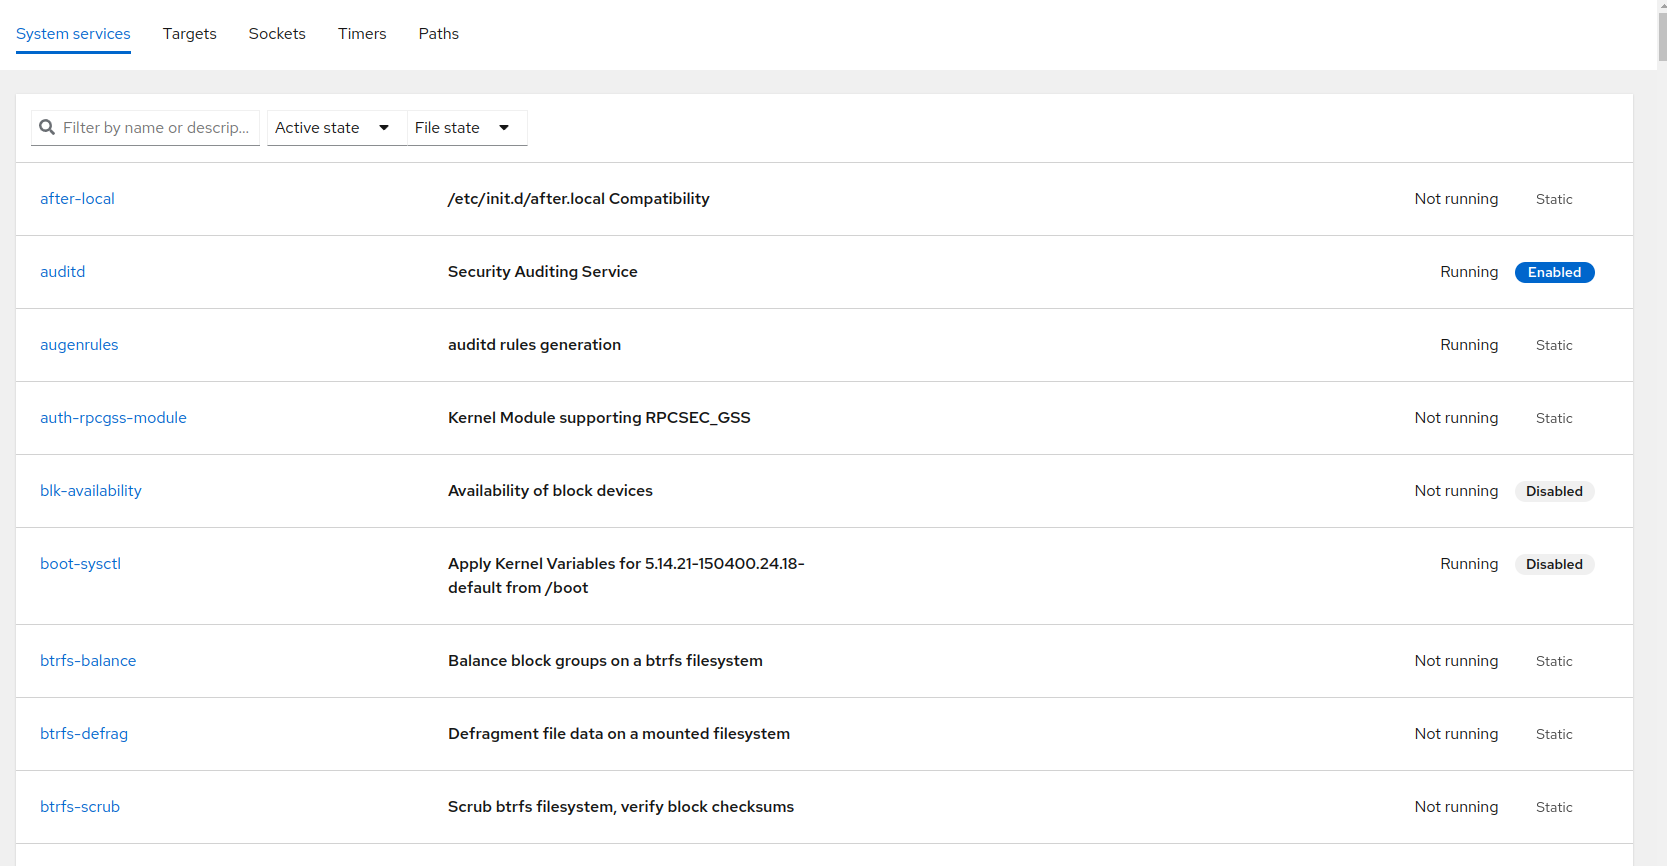
10 Managing services #
In the view, you can view the status of systemd
units, start or stop particular units and create systemd timers.
To manage a systemd unit, select the appropriate tab, then click on the
particular unit. In the unit details, you can view relations to other
systemd units, the status of the unit, or you can perform the following
actions that can be found in the three dots menu:
if the unit is not running
the running unit
the running unit
—that will stop the service permanently including all its dependencies. Keep in mind that the dependent service can be used by other units, and disallowing the unit might cause serious troubles for the system.
10.1 Creating new timers #
To create a new timer, click in the tab. Fill in the details described below in the opened window.
- Name
The name of the timer that will be used in the unit name and in the service unit name as well. For example, specifying the name example will create the following unit files:
/etc/systemd/system/example.timerand/etc/systemd/system/example.service.- Description
You can provide a short description of the timer.
- Command
The command to be invoked when the timer is triggered
- Trigger
the timer can be triggered each time you reboot your machine or at a specific time. For the option, you can define the delay of the service invocation. For the option, specify when the service should be invoked.
The default set of systemd timers is stored in
/usr/lib/systemd. If you create a timer with already
existing names, the default unit file is not overwritten, but a new one is
created in /etc/systemd/system/ that overrides the
default unit file. If you want to restore the timer to the default one,
delete the timer unit file in /etc/systemd/system/.
If you try to create a timer that already exists in the
/etc/systemd/system/ directory, the unit file will be
overwritten, and the previous changes are lost.
11 Managing SELinux mode and policy #
The SELinux tool enables you to switch between SELinux modes and view current modifications of the SELinux policy.
On SLE Micro, SELinux is in the enforcing mode by default. To temporarily
switch to the permissive mode, click the button with the
Enforcing label. Bear in mind that the change persists
only until the next boot. If you need to perform a persistent change of the mode,
edit the configuration file /etc/selinux/config as
described in Section 1.2, “SELinux modes”.
The lists all modifications performed on the default SELinux policy. If you want to export the modifications and reuse them on different servers, click . In the new window, you can copy a shell script or the ansible configuration file that can be applied on other servers.
12 Managing SLE Micro updates and snapshots #
If your system is not registered, the updates are not available and the check for updates fails. Therefore, register your system to view available updates. For details, refer to 第 10 章 “部署后步骤”.
Only users with the role can update the system or perform a rollback to another snapshot.
Cockpit enables you to update your SLE Micro instance or perform a rollback
from the Software Updates menu.
12.1 Managing updates #
Click to get a list of new package updates and patches available for your system. You can view each package update or patch information by clicking the blue icon next to the package update/patch. It is recommended to install the patches marked as important as soon as possible.
To apply the updates and patches, click . The equivalent of the transactional-update
up command is called, and a new snapshot of your system is
created. After the update completes successfully, your system will be
rebooted and the new snapshot set as default.
You can postpone the reboot of your system after the update process by selecting from the three dots menu. Bear in mind that you need to reboot the system to activate the snapshot with updates. If you perform further changes without rebooting the system beforehand, a new snapshot will be created from the same point as the snapshots with updates. Therefore, the new snapshot will not include the updates.
You can also update SLE Micro using CLI. For details, refer to
Section 3.1, “transactional-update usage”.
12.2 Performing rollbacks #
In Snapshots & Updates you can perform a rollback to
one of older snapshots by clicking ,
or in the three dots menu.
After rebooting the system, the snapshot you rolled back to will be set as active. Do not make any changes (install updates, packages, etc.) before rebooting your system, as the snapshot you rolled back to is not active. Any changes performed before you reboot your system will start from the currently active snapshot.
For a system rollback procedure performed using CLI, refer to Section 3.3, “System rollback”.
