Developing for Kubernetes
Rancher Desktop – SUSE Application Collection – Tilt
From development environment to deployment – Inner Loop, Observability, GitOps
1. Overview: why this guide?
This guide covers the complete value chain of Kubernetes development, from initial environment setup to continuous deployment. The goal: enable a developer to be productive quickly using popular tools, a local cluster (Rancher Desktop), and trusted images (SUSE Application Collection).
It is structured in two parts: first, a hands-on demo that gets you running in minutes. Then, a Going further section covering the broader ecosystem (Dev Containers, Testcontainers, mirrord, Helm, security, GitOps) for when you are ready to deepen your workflow.
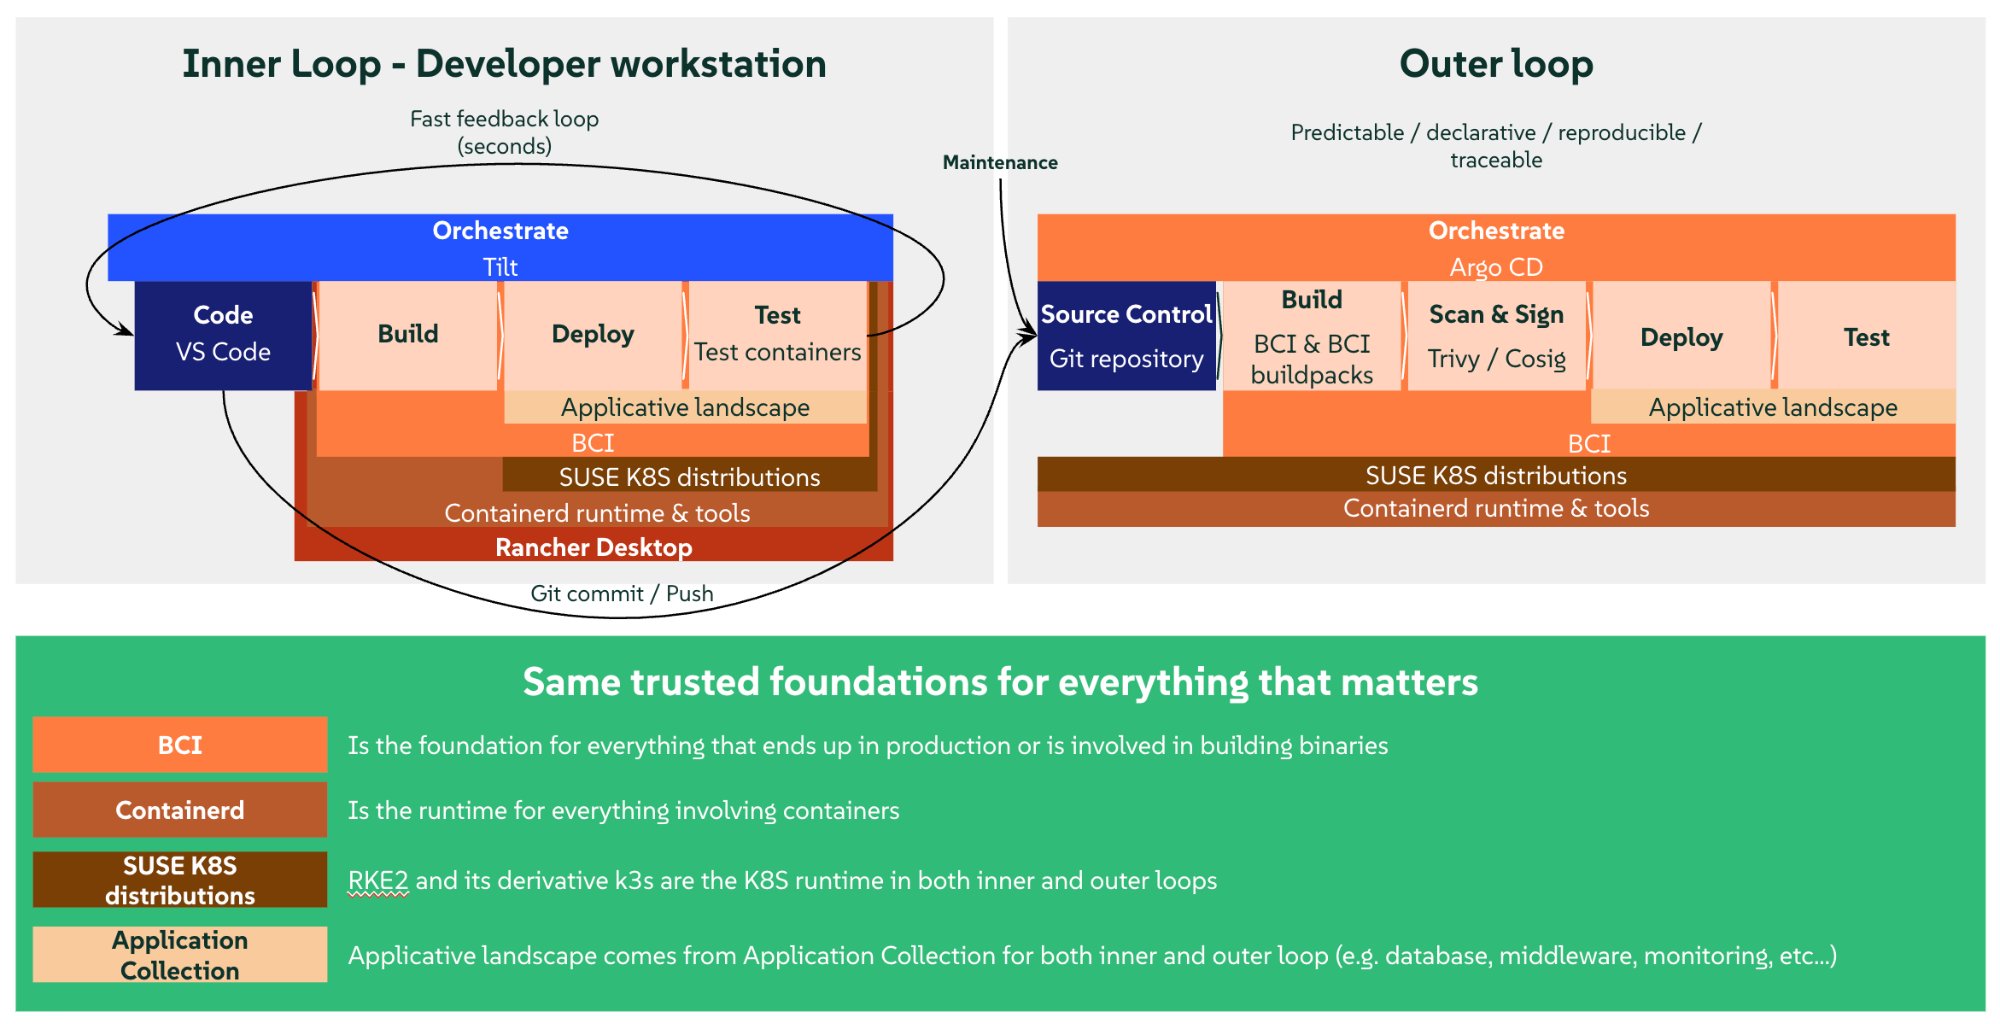
1.1 The two loops of cloud-native development
| Inner Loop | Outer Loop | |
|---|---|---|
What |
The developer’s fast daily cycle: write code, build, deploy locally, test, debug, iterate |
The automated post-commit cycle: CI/CD, integration tests, security scans, staging/prod deployment |
Goal |
Feedback in seconds |
Quality and reproducibility |
Tools |
Tilt, mirrord |
Argo CD, GitHub Actions, Tekton |
Scope |
Developer workstation + local cluster |
CI/CD pipeline + remote cluster |
Key principle – The inner loop must be as fast as possible. Every second saved in the code-build-deploy-test cycle multiplies by the number of daily changes. A good inner loop means going from 5-10 minutes to 5-10 seconds per iteration.
2. Overall architecture
2.1 Diagram
2.2 Stack layers
| Layer | Tool | Role |
|---|---|---|
IDE |
VS Code + extensions |
Editor, debug, integrated terminals |
Local cluster |
Rancher Desktop (k3s) |
Local Kubernetes + container runtime |
Images |
SUSE Application Collection |
Base images, languages, middleware, tools |
Inner loop |
Tilt |
Auto-build, auto-deploy, hot reload |
Authentication |
Keycloak |
OAuth2 / OpenID Connect identity provider |
Observability |
Prometheus + Grafana |
Application metrics, real-time dashboards |
Packaging |
Helm / Kustomize |
K8s manifest templating |
Security |
Trivy / Cosign |
Vulnerability scanning, image signing |
GitOps |
Argo CD |
Declarative deployment from Git |
3. Setting up Rancher Desktop
3.1 What is Rancher Desktop?
Rancher Desktop is an open-source desktop application that provides a local Kubernetes cluster (k3s) and a container runtime (dockerd or containerd), all within an automatically managed VM. No need to install Docker Desktop.
3.2 Installation and configuration
-
Download from rancherdesktop.io.
-
Choose the runtime: select dockerd (moby) (not containerd). This is essential for what follows.
-
Enable Kubernetes (enabled by default).
-
Verify:
docker info # shows "Server Version: ..." kubectl get nodes # shows "Ready" -
PATH – on macOS, verify that
~/.rd/bin/is in your$PATH(added automatically by the installer):which docker kubectl helm # should point to ~/.rd/bin/
Rancher Desktop is not Docker Desktop. You do not need Docker Desktop. Rancher Desktop provides its own Docker daemon (moby/dockerd). Having both installed can create socket conflicts. Disable Docker Desktop if you have it.
3.3 Why dockerd (moby) when production runs containerd?
In production, Kubernetes uses containerd as runtime. Here is the key insight: so does Rancher Desktop, even in moby mode. The k3s cluster always runs on containerd, regardless of the setting. Choosing “dockerd (moby)” does not replace containerd – it adds Docker’s daemon alongside it, and the two share the same image store.
This is what gives us the best of both worlds: the same runtime as production, plus Docker’s developer-friendly tooling.
Rancher Desktop VM (moby mode):
+---------------------------------------------+
|                                             |
|   dockerd (moby)         k3s (containerd)   |
|   +-- image store <----> image store --+    |
|       (shared)           (same!)       |    |
|                                             |
|   docker build -> image appears in both     |
|   NO PUSH NEEDED!                           |
+---------------------------------------------+

Rancher Desktop VM (containerd mode):
+---------------------------------------------+
|                                             |
|   nerdctl (containerd)   k3s (containerd)   |
|   +-- image store        image store --+    |
|       (separate!)        (separate!)   |    |
|                                             |
|   nerdctl build -> push -> pull -> k3s      |
|   3 steps instead of 1 = slower             |
+---------------------------------------------+
Images built by Docker are immediately visible to k3s because they share the same store. No registry, no push, no pull. This is what makes the inner loop so fast.
No compromise on parity. Your app runs on containerd in both cases. The only difference is the CLI used to build images:
docker(moby mode) vsnerdctl(containerd mode). At runtime, k3s behaves identically.
This is also why the demo K8s Deployments use imagePullPolicy: IfNotPresent (or Never): we tell k3s “use the local image, do not look in a registry”.
4. SUSE Application Collection
4.1 What is SUSE Application Collection?
SUSE Application Collection is a collection of applications in the form of container images and Helm charts, built, packaged, hardened, and maintained by SUSE – with SLSA L3 grade builds and all the metadata needed to keep Operations serene. It is the trusted source for building applications on Kubernetes.
The registry is dp.apps.rancher.io. You will find:
-
Base images (BCI) – SUSE Linux Enterprise Base Container Images: minimal, secure foundations.
-
Language images – Node.js, Go, Rust, Java, Ruby, Clojure… with complete toolchains.
-
Middleware – PostgreSQL, Redis, Kafka, MariaDB, Nats, NGINX, Apache ActiveMQ, Apache Apisix, Apache Tomcat…
-
Tools – Helm, Trivy, Cosign, kubectl, ArgoCD, Prometheus, Grafana…
Available in the form of single containers, or, when relevant, full-fledge applications with helm-charts for deployment.
The SUSE Application Collection extension in Rancher Desktop adds a dedicated tab in the UI. You browse the catalog, configure values, and install with one click – the Helm complexity is hidden.
4.2 Why Application Collection over Public registries?
| Public registries | SUSE Application Collection | |
|---|---|---|
Maintenance |
Community, variable |
SUSE, enterprise SLA |
Base OS |
Alpine, Debian, Ubuntu… |
SLE BCI (SUSE Linux Enterprise) |
Security patches |
When the maintainer wants |
Continuous CVE tracking by SUSE |
Signing |
Optional |
Cosign built-in |
Supply chain |
Variable |
SBOM, provenance, attestations, SLSA L3 |
4.3 Authentication
Authentication to the Application Collection registry is configured automatically by the SUSE Application Collection extension in Rancher Desktop.
Verify it works:
docker pull dp.apps.rancher.io/containers/bci-base:latestIf auth is not configured, add it manually:
# Log in to the registry (SUSE Customer Center credentials)
docker login dp.apps.rancher.io

# Verify
docker pull dp.apps.rancher.io/containers/bci-base:latest
For Kubernetes (helm install, pods) – a pull secret is needed if images are not already pulled. Rancher Desktop handles this automatically via the extension. If there is an issue:
kubectl create secret docker-registry application-collection \
  --docker-server=dp.apps.rancher.io \
  --docker-username=<USERNAME> \
  --docker-password=<PASSWORD>
Then add imagePullSecrets: [{name: application-collection}] in your Helm values.
5. Installing Tilt
Tilt is an open-source tool that automates every step of the inner loop, from code change to redeployment. It watches your files, rebuilds images, updates the cluster, and displays everything in a real-time dashboard. See tilt.dev.
5.2 Linux (SUSE and others)
curl -fsSL https://raw.githubusercontent.com/tilt-dev/tilt/master/scripts/install.sh | bashThe script detects your architecture and places the binary in your $PATH (~/.local/bin, /usr/local/bin, or ~/bin). Verify:
tilt version5.3 Windows
In PowerShell:
iex ((new-object net.webclient).DownloadString('https://raw.githubusercontent.com/tilt-dev/tilt/master/scripts/install.ps1'))If you have Scoop installed, the script will use it automatically. Otherwise, you may need to add the install directory to your $PATH. Verify:
tilt version5.4 Tilt + Rancher Desktop
Tilt runs on the host (not inside a container) and directly uses the CLIs installed by Rancher Desktop: docker, kubectl, helm. It automatically detects Rancher Desktop (since Tilt v0.25.1+) when the runtime is dockerd. It then knows that locally built images are directly available in the cluster, and skips the push.
If Tilt does not automatically detect your cluster, add this line at the top of the Tiltfile:
allow_k8s_contexts('rancher-desktop')6. The demo: Message Wall with observability
This section walks through the complete demo. It shows the inner loop workflow: a Node.js “message wall” application connected to PostgreSQL, with Keycloak for authentication, instrumented with Prometheus, and visualized in Grafana. Everything is installed from SUSE Application Collection.
The complete source code is available on GitHub: fxHouard/Rancher-Developer-Access-Demo.
6.1 Project structure
Rancher-Developer-Access-Demo/
+-- src/
|   +-- server.js               Application (API + UI + Prometheus metrics)
+-- k8s/
|   +-- appco/
|   |   +-- deployment.yaml     Pod spec with Prometheus annotations
|   |   +-- service.yaml        ClusterIP service
|   |   +-- keycloak.yaml       Keycloak Deployment + Service (Application Collection image)
|   +-- shared/
|       +-- grafana-dashboard.yaml   8-panel dashboard (auto-provisioned via sidecar)
|       +-- keycloak-realm.json      Realm config (demo user + OAuth client)
+-- scripts/
|   +-- setup-keycloak-realm.sh      Keycloak realm import via Admin REST API
+-- values_yaml/
|   +-- postgresql.yaml          Helm values for PostgreSQL
|   +-- prometheus.yaml          Helm values for Prometheus
|   +-- grafana.yaml             Helm values for Grafana
+-- Dockerfile                   Container image (Application Collection base)
+-- Tiltfile                     Inner loop config (build, deploy, sync, monitoring)
+-- package.json
6.2 The package.json
{
  "name": "message-wall",
  "version": "1.0.0",
  "description": "SUSE Rancher Developer Access + Tilt: Demo",
  "main": "src/server.js",
  "scripts": {
    "start": "node src/server.js"
  },
  "dependencies": {
    "pg": "^8.13.0",
    "prom-client": "^15.1.0"
  }
}
Two dependencies only: pg for PostgreSQL and prom-client to expose Prometheus metrics.
6.3 The application (src/server.js)
The application is an interactive message wall with a built-in web UI. It exposes Prometheus metrics for observability. Here are the key parts – the complete file is in the repo.
Configuration and Prometheus metrics:
const http = require('http');
const { Client } = require('pg');
const promClient = require('prom-client');

const PORT = 3000;

// Change this color, save, see it update!
const ACCENT_COLOR = "#747dcd";

// --- Prometheus metrics ---
// collectDefaultMetrics() automatically exposes Node.js
// metrics: CPU, heap memory, event loop lag, GC...
promClient.collectDefaultMetrics();

// Custom metrics -- prefixed "app_" for easy discovery
const httpDuration = new promClient.Histogram({
  name: 'app_http_request_duration_seconds',
  help: 'Duration of HTTP requests in seconds',
  labelNames: ['method', 'path', 'status'],
  buckets: [0.005, 0.01, 0.05, 0.1, 0.5, 1],
});

const messagesPosted = new promClient.Counter({
  name: 'app_messages_posted_total',
  help: 'Total number of messages posted',
});

const messagesDeleted = new promClient.Counter({
  name: 'app_messages_deleted_total',
  help: 'Total number of bulk deletes',
});

const messagesCurrent = new promClient.Gauge({
  name: 'app_messages_count',
  help: 'Current number of messages in the database',
});
Why the
app_prefix? – Prometheus collects hundreds of metrics (Node.js, k8s, system…). Theapp_prefix lets you instantly find your application metrics: typeapp_in Grafana and autocomplete does the rest.
Prometheus metric types:
| Type | Usage | Demo example |
|---|---|---|
Counter |
Value that only goes up |
|
Gauge |
Value that goes up and down |
|
Histogram |
Distribution of values (latency) |
|
API routes:
The application exposes 6 routes: GET / serves the HTML page, GET /api/messages lists the 50 most recent messages, POST /api/messages creates a message (280 char limit), DELETE /api/messages deletes all messages, GET /health serves as the K8s probe (liveness + readiness), and GET /metrics exposes Prometheus metrics in text format.
The /metrics endpoint:
if (req.method === 'GET' && req.url === '/metrics') {
  const metrics = await promClient.register.metrics();
  res.writeHead(200, { 'Content-Type': promClient.register.contentType });
  res.end(metrics);
  // Do not record /metrics in the histogram (noise)
  return;
}
This is the endpoint that Prometheus scrapes periodically. It returns all metrics in OpenMetrics text format. Note that /metrics itself is not measured by the histogram – that would be noise.
The measurement middleware:
Every HTTP request is automatically timed:
const end = httpDuration.startTimer();
// ... request processing ...
end({ method: req.method, path: routePath, status: statusCode });
The histogram records the duration, method, path, and return code. Grafana can then compute percentiles (p50, p95, p99) per route.
The HTML page:
The application serves an interactive message wall directly from Node.js (inline HTML in server.js). The UI includes an input field, an info bar showing the pod name and uptime, and automatic polling every 3 seconds with smart diffing (only timestamps are updated if messages have not changed, no flickering).
live_update demo – Change the
ACCENT_COLORconstant on line 9, save. In ~2 seconds, the wall color changes without losing messages. That is Tilt’s live_update in action.
6.4 The Dockerfile
FROM dp.apps.rancher.io/containers/nodejs:24-dev
WORKDIR /app
COPY package.json ./
RUN npm install --no-package-lock
COPY . .
EXPOSE 3000
CMD ["node", "src/server.js"]
In production, you would use a multi-stage build to separate the
npm installstep (dev image with npm) from the final image (minimalnodejs:24image, without npm or build tools). Here we keep a simple Dockerfile for the demo. See Going further: minimal images.
6.5 The Kubernetes manifests
k8s/deployment.yaml:
apiVersion: apps/v1
kind: Deployment
metadata:
  name: message-wall
spec:
  replicas: 1
  selector:
    matchLabels:
      app: message-wall
  template:
    metadata:
      labels:
        app: message-wall
      annotations:
        prometheus.io/scrape: "true"
        prometheus.io/port: "3000"
        prometheus.io/path: "/metrics"
    spec:
      containers:
        - name: message-wall
          image: message-wall           # Tilt replaces with local image
          ports:
            - containerPort: 3000
          env:
            - name: DB_HOST
              value: "demo-db-postgresql"
            - name: DB_PORT
              value: "5432"
            - name: DB_USER
              value: "demo"
            - name: DB_PASSWORD
              value: "demo"
            - name: DB_NAME
              value: "demo"
          livenessProbe:
            httpGet:
              path: /health
              port: 3000
            initialDelaySeconds: 5
          readinessProbe:
            httpGet:
              path: /health
              port: 3000
            initialDelaySeconds: 5
Prometheus annotations – The three annotations under
template.metadata.annotationstell Prometheus: “scrape this pod, on port 3000, at path/metrics”. The Prometheus server, configured by default for Kubernetes auto-discovery, automatically detects annotated pods. No additional Prometheus configuration needed.
Watch the indentation – Annotations must be under
template.metadata(the pod template), not under the Deployment’smetadataor at thespeclevel. This is a common mistake: if annotations are at the wrong level, Prometheus will not find your pods.
k8s/service.yaml:
apiVersion: v1
kind: Service
metadata:
  name: message-wall
spec:
  selector:
    app: message-wall
  ports:
    - port: 3000
      targetPort: 3000
6.6 Installing PostgreSQL, Prometheus, and Grafana
All three are infrastructure services – install them once via Rancher Desktop, not on every tilt up. They persist between development sessions.
The repo includes Helm values files in values_yaml/ for each service. In the Rancher Desktop Application Collection tab, search for each chart, switch to YAML mode, and paste the corresponding file.
values_yaml/postgresql.yaml:
auth:
  database: demo
  postgresPassword: demo
  postgresUsername: demo
  username: demo
global:
  imagePullSecrets:
  - application-collection
values_yaml/prometheus.yaml:
alertmanager:
  service:
    type: NodePort
global:
  imagePullSecrets:
  - application-collection
values_yaml/grafana.yaml:
adminPassword: admin
global:
  imagePullSecrets:
  - application-collection
sidecar:
  dashboards:
    enabled: true
  datasources:
    enabled: true
imagePullSecrets– Each values file references theapplication-collectionsecret so pods can pull images fromdp.apps.rancher.io. This secret is created automatically by the Rancher Desktop extension.
Grafana sidecars – The
sidecar.dashboards.enabledandsidecar.datasources.enabledsettings are critical. They start small containers alongside Grafana that watch for Kubernetes ConfigMaps with certain labels and automatically load their contents into Grafana. No need to manually configure datasources or import dashboards.
| Sidecar | Watched label | Effect |
|---|---|---|
|
|
Automatically loads dashboard JSON files |
|
|
Automatically configures datasources |
Verify the sidecars are active:
kubectl get pods -l app.kubernetes.io/name=grafana \
  -o jsonpath='{.items[0].spec.containers[*].name}'
# Expected: grafana grafana-sc-dashboard grafana-sc-datasources
If you only see grafana, go back to the Rancher Desktop UI and verify that both sidecar.dashboards.enabled and sidecar.datasources.enabled are true, then Upgrade the chart.
The Helm chart for PostgreSQL automatically creates the user, database, and a service named
<release-name>-postgresql. The Tiltfile auto-detects this service via theapp.kubernetes.io/name=postgresqllabel – no need to remember the release name.
6.7 Keycloak: authentication without a Helm chart
Keycloak provides OAuth2 / OpenID Connect authentication for the Message Wall. Users log in, and the app verifies their identity token before allowing them to post or delete messages.
Why no Helm install? – Unlike PostgreSQL, Prometheus, and Grafana, there is no Helm chart for Keycloak on SUSE Application Collection. It is available as a container image only (dp.apps.rancher.io/containers/keycloak). This is a realistic scenario: not every application ships a Helm chart, and developers need to know how to deploy raw Kubernetes manifests.
k8s/appco/keycloak.yaml (simplified):
apiVersion: apps/v1
kind: Deployment
metadata:
  name: keycloak-appco
spec:
  replicas: 1
  selector:
    matchLabels:
      app: keycloak
  template:
    metadata:
      labels:
        app: keycloak
    spec:
      volumes:
        - name: realm-config
          configMap:
            name: keycloak-realm
      containers:
        - name: keycloak
          image: dp.apps.rancher.io/containers/keycloak:26.5.4
          args: ["start-dev", "--health-enabled=true", "--import-realm"]
          volumeMounts:
            - name: realm-config
              mountPath: /opt/keycloak/data/import
          env:
            - name: KC_DB
              value: postgres
            - name: KC_DB_URL
              value: jdbc:postgresql://PLACEHOLDER_PG_SVC:5432/keycloak
            # ... KC_DB_USERNAME, KC_DB_PASSWORD, KEYCLOAK_ADMIN, etc.
          readinessProbe:
            httpGet:
              path: /health/ready
              port: 9000
            initialDelaySeconds: 30
      imagePullSecrets:
        - name: application-collection
Key points:
start-dev+--import-realm– Keycloak starts in dev mode (HTTP, no certificate) and automatically imports any JSON realm files found in/opt/keycloak/data/import.Realm ConfigMap – A ConfigMap (
keycloak-realm) containing the realm JSON is mounted as a volume. This ConfigMap is created by the Tiltfile fromk8s/shared/keycloak-realm.json.
PLACEHOLDER_PG_SVC– The Tiltfile replaces this at deploy time with the actual PostgreSQL service name discovered via label selectors.Separate database – Keycloak uses a dedicated
keycloakdatabase in the same PostgreSQL instance. The Tiltfile creates it automatically if it does not exist.
Realm setup script (scripts/setup-keycloak-realm.sh):
The Tiltfile also runs a setup script via the Admin REST API as a fallback. The script is idempotent: it checks if the realm already exists, gets an admin token, and creates the realm if needed. This handles the case where the ConfigMap import is not picked up (e.g., Keycloak was already running before the ConfigMap was created).
6.8 The Grafana dashboard (auto-provisioned ConfigMap)
The Grafana dashboard is defined in a Kubernetes ConfigMap. Thanks to the sidecar enabled in the previous step, it loads automatically – zero manual import.
k8s/grafana-dashboard.yaml (structure – the complete file is in the repo):
apiVersion: v1
kind: ConfigMap
metadata:
  name: message-wall-dashboard
  labels:
    grafana_dashboard: "1"      # the sidecar detects this label
data:
  message-wall.json: |
    {
      "uid": "message-wall",
      "title": "Message Wall",
      "panels": [ ... ]
    }
uid: "prometheus"– Each panel references the datasource by"uid": "prometheus". This uid must exactly match the one declared in the datasource ConfigMap generated by the Tiltfile (see next section). If the JSON uses${DS_PROMETHEUS}(Grafana UI import syntax), the sidecar will not resolve that variable – you must use the hardcoded uid.
The dashboard contains 8 panels:
| Panel | Type | Metric | What it shows |
|---|---|---|---|
Messages in database |
Stat |
|
Gauge with thresholds green < 50 < yellow < 100 < red |
Messages posted |
Stat |
|
Total messages posted counter |
Bulk deletes |
Stat |
|
Total bulk deletes counter |
Requests / sec |
Timeseries |
|
Throughput per HTTP route |
Posts / min |
Timeseries |
|
Publication rate |
Response time (p95) |
Timeseries |
|
95th percentile latency per route |
Memory usage |
Timeseries |
|
RSS + Node.js heap |
Event loop lag (p99) |
Timeseries |
|
Event loop health |
Why
rate(…[5m])and not[1m]? – Therate()function needs at least 2 data points inside the window. If Prometheus scrapes every 60 seconds, a 1-minute window only has one point and returns nothing. The rule of thumb: set therate()window to at least 2x the scrape interval. 5 minutes is a safe default.
Declarative provisioning – The dashboard is in Git, versioned with the code. If you modify it in Grafana (adding panels, changing queries), export it and update the ConfigMap so changes are not lost on the next redeployment. This is the Infrastructure as Code approach applied to observability.
6.9 The complete Tiltfile
# Demo Tiltfile
load('ext://restart_process', 'docker_build_with_restart')

allow_k8s_contexts('rancher-desktop')

# --- Helpers ---------------------------------------------------------
def find_service(label_selector, required=False, name='Service'):
    # Discover a Kubernetes service by label selector.
    #
    # Helm charts installed via Rancher Desktop get random release
    # names (e.g. postgresql-1772033328). Searching by label is
    # robust regardless of the release name.
    svc = str(local(
        "kubectl get svc -l " + label_selector +
        " -o jsonpath='{.items[0].metadata.name}'",
        quiet=True,
    )).strip()
    if required and svc == '':
        fail(name + ' not found. Install it via Rancher Desktop ' +
             '(Application Collection).')
    return svc

# --- Service discovery -----------------------------------------------
pg_svc = find_service(
    'app.kubernetes.io/name=postgresql',
    required=True,
    name='PostgreSQL',
)
grafana_svc = find_service('app.kubernetes.io/name=grafana')
prometheus_svc = find_service(
    'app.kubernetes.io/name=prometheus,app.kubernetes.io/component=server',
)

# --- Application -----------------------------------------------------
docker_build_with_restart(
    'message-wall',
    '.',
    entrypoint=['node', 'src/server.js'],
    only=['src/', 'package.json'],
    live_update=[
        sync('./src', '/app/src'),
        run('cd /app && npm install --no-package-lock',
            trigger=['package.json']),
    ],
)

deployment = str(read_file('k8s/appco/deployment.yaml')).replace(
    'PLACEHOLDER_PG_SVC', pg_svc)
service = str(read_file('k8s/appco/service.yaml'))
k8s_yaml([blob(deployment), blob(service), 'k8s/shared/grafana-dashboard.yaml'])

k8s_resource(
    'message-wall-appco',
    port_forwards='3000:3000',
    labels=['app'],
)

# --- Keycloak (no Helm chart — deployed as raw K8s manifest) ---------
# Ensure keycloak DB exists in PostgreSQL
pg_pod = str(local(
    "kubectl get pods -l app.kubernetes.io/name=postgresql "
    "-o jsonpath='{.items[0].metadata.name}'", quiet=True)).strip()
local("kubectl exec " + pg_pod +
    " -- env PGPASSWORD=demo psql -U demo -tc "
    "\"SELECT 1 FROM pg_database WHERE datname='keycloak'\""
    " | grep -q 1 || kubectl exec " + pg_pod +
    " -- env PGPASSWORD=demo psql -U demo -c 'CREATE DATABASE keycloak'",
    quiet=True)

# Realm ConfigMap (auto-imports realm with demo user + OAuth client)
local('kubectl create configmap keycloak-realm '
      '--from-file=message-wall.json=k8s/shared/keycloak-realm.json '
      '--dry-run=client -o yaml | kubectl apply -f -', quiet=True)

# Deploy Keycloak using the Application Collection container image
keycloak_yaml = str(read_file('k8s/appco/keycloak.yaml')).replace(
    'PLACEHOLDER_PG_SVC', pg_svc)
k8s_yaml(blob(keycloak_yaml))

k8s_resource('keycloak-appco', port_forwards='8080:8080', labels=['app'])

# Realm setup via Admin REST API (idempotent fallback)
local_resource(
    'keycloak-realm-setup',
    cmd='bash scripts/setup-keycloak-realm.sh http://localhost:8080 '
        'k8s/shared/keycloak-realm.json',
    labels=['app'],
    resource_deps=['keycloak-appco'],
)

# --- Monitoring (optional) -------------------------------------------
if grafana_svc:
    local_resource(
        'grafana',
        serve_cmd='kubectl port-forward svc/' + grafana_svc + ' 3001:80',
        labels=['monitoring'],
        allow_parallel=True,
        links=['http://localhost:3001',
               'http://localhost:3001/d/message-wall/'],
    )

if prometheus_svc:
    local_resource(
        'prometheus',
        serve_cmd='kubectl port-forward svc/' + prometheus_svc
                  + ' 9090:80',
        labels=['monitoring'],
        allow_parallel=True,
        links=['http://localhost:9090'],
    )

    datasource_cm = """apiVersion: v1
kind: ConfigMap
metadata:
  name: grafana-datasource-prometheus
  labels:
    grafana_datasource: "1"
data:
  prometheus.yaml: |
    apiVersion: 1
    datasources:
      - name: Prometheus
        type: prometheus
        uid: prometheus
        url: http://{svc}:80
        access: proxy
        isDefault: true
        editable: false
""".format(svc=prometheus_svc)

    k8s_yaml(blob(datasource_cm))

    k8s_resource(
        objects=['message-wall-dashboard:configmap',
                 'grafana-datasource-prometheus:configmap'],
        new_name='grafana-config',
        labels=['monitoring'],
        links=['http://localhost:3001/d/message-wall/'],
    )
Key points of the Tiltfile:
find_service() helper – Services installed via the Rancher Desktop UI have random release names (e.g., grafana-1772033328). Instead of hardcoding these names, the helper discovers them via Kubernetes labels set by the Helm charts. This is a robust pattern: the Tiltfile works regardless of the release name.
docker_build_with_restart – The restart_process extension solves a problem specific to interpreted languages. When live_update syncs a file into the container, Node.js does not see it – the code is already loaded into memory. docker_build_with_restart wraps the entrypoint to automatically restart the process after each sync. For compiled languages (Go, Rust), a standard docker_build with a compile step in run() is the usual approach.
Prometheus datasource as ConfigMap – Rather than configuring Prometheus in the Grafana UI (manual configuration lost on redeployment), the Tiltfile generates a ConfigMap with the grafana_datasource: "1" label. The Grafana sidecar detects it and automatically provisions the connection. The Prometheus URL is injected dynamically: http://<detected-service-name>:80.
links – Each local_resource and k8s_resource can declare clickable links in the Tilt dashboard. You see the URLs for Grafana, Prometheus, and the specific dashboard directly in the Tilt UI.
objects + new_name – ConfigMaps are not workloads (Deployment, StatefulSet…), so Tilt files them under “uncategorized” by default. The objects directive groups them under an explicit name (grafana-config) with the monitoring label.
Keycloak deployment – Since there is no Helm chart for Keycloak on SUSE Application Collection, the Tiltfile deploys it as a raw K8s manifest. It first ensures a keycloak database exists in PostgreSQL, creates a ConfigMap with the realm JSON, deploys the Keycloak Deployment (replacing PLACEHOLDER_PG_SVC with the discovered service name), and runs a setup script via the Admin REST API as an idempotent fallback.
Conditionality – The monitoring block is conditional (if grafana_svc / if prometheus_svc). If Prometheus and Grafana are not installed, the Tiltfile still works – only the app and PostgreSQL are required. Observability is an opt-in bonus.
6.10 Running the demo
# 1. Clone the repo
git clone https://github.com/fxHouard/Rancher-Developer-Access-Demo.git
cd Rancher-Developer-Access-Demo

# 2. Install services via Rancher Desktop (one time only):
#
#    PostgreSQL:
#      Application Collection tab -> search PostgreSQL -> Install
#      Switch to YAML mode, paste values_yaml/postgresql.yaml, Install
#
#    Prometheus:
#      Application Collection tab -> search Prometheus -> Install
#      Switch to YAML mode, paste values_yaml/prometheus.yaml, Install
#
#    Grafana:
#      Application Collection tab -> search Grafana -> Install
#      Switch to YAML mode, paste values_yaml/grafana.yaml, Install

# 3. Start the inner loop:
tilt up

# 4. Press Space to open the Tilt dashboard in your browser

# 5. From the Tilt dashboard, click the links to:
#    -> http://localhost:3000   -- The Message Wall app
#    -> http://localhost:8080   -- Keycloak (admin / admin)
#    -> http://localhost:9090   -- Prometheus (check targets)
#    -> http://localhost:3001   -- Grafana (admin / admin)

# 6. In Grafana: go to Dashboards -> "Message Wall" is already there
#    (or click the direct link in Tilt)

# 7. Post messages on localhost:3000 and watch the metrics
#    update in real time in Grafana

# 8. Change ACCENT_COLOR in src/server.js (line 9)
#    -> save -> ~2 sec -> the color changes
6.11 What happens under the hood
1. `tilt up` on the host:
   +-- Auto-detects PostgreSQL (label app.kubernetes.io/name=postgresql)
   +-- Auto-detects Prometheus and Grafana (labels app.kubernetes.io/name=...)
   +-- Creates keycloak DB in PostgreSQL if needed
   +-- docker build message-wall -> image in dockerd local store
   |   +-- k3s sees the image because same store -> imagePullPolicy: IfNotPresent
   +-- kubectl apply deployment + service -> k3s creates the app pod
   |   +-- Pod connects to detected PG service (K8s internal DNS)
   |   +-- Prometheus scrapes the pod (prometheus.io/* annotations)
   +-- Deploys Keycloak (Application Collection image, raw K8s manifest)
   |   +-- Imports realm via ConfigMap volume mount
   |   +-- Runs setup script via Admin REST API (idempotent fallback)
   +-- kubectl apply ConfigMaps (datasource + dashboard)
   |   +-- Grafana sidecars detect and load them
   +-- Port-forward 3000 -> localhost:3000 (app)
   +-- Port-forward 8080 -> Keycloak
   +-- Port-forward 3001 -> Grafana
   +-- Port-forward 9090 -> Prometheus

2. Dev modifies src/server.js:
   +-- Tilt (on host) detects the change (file watcher)
   +-- live_update syncs ./src -> /app/src in the pod (kubectl cp)
   +-- restart_process relaunches `node src/server.js` in the container
   +-- ~2 seconds later: change visible on localhost:3000

3. Observability loop (continuous):
   +-- Prometheus scrapes localhost:3000/metrics every 15-60s
   +-- Grafana queries Prometheus to display dashboards
   +-- Dev sees the impact of their changes in real time
6.12 Port forwarding explained
Tilt manages port forwarding automatically via port_forwards in k8s_resource(). It is the equivalent of kubectl port-forward, but integrated into Tilt’s lifecycle (automatically restarted if the pod is recreated).
Complete port forwarding chain:
Browser (localhost:3000)
  -> Tilt port-forward
    -> K8s Service (ClusterIP)
      -> Your app pod (:3000)
        -> Connects to PostgreSQL Service (:5432)
          -> PostgreSQL pod
Your app in the pod uses Kubernetes internal DNS to reach PostgreSQL:
postgresql://user:pass@demo-db-postgresql.default.svc.cluster.local:5432/mydb
From your local machine (for a SQL client for example): kubectl port-forward svc/demo-db-postgresql 5432:5432.
7. The complete workflow
| # | Step | Tools | Details |
|---|---|---|---|
1 |
Write code |
VS Code + extensions |
Editor, autocomplete, lint, Git |
2 |
Iterate (inner loop) |
Tilt |
Auto-build + live sync + dashboard |
3 |
Authenticate |
Keycloak |
OAuth2 login, realm auto-provisioned by Tilt |
4 |
Observe |
Prometheus + Grafana |
Real-time metrics, auto-provisioned dashboards |
5 |
Commit + Push |
Git |
Source of truth for GitOps |
6 |
Build + Scan (outer loop) |
CI pipeline + Trivy + Cosign |
Vulnerabilities + image signing |
7 |
Deploy |
Argo CD |
Automatic sync Git → cluster |
8 |
Progressive rollout |
Argo Rollouts |
Canary / Blue-green with analysis |
8. Going further
The demo above covers the inner loop essentials. This section introduces additional tools and practices that complement the workflow as your project grows.
8.1 Dev Containers: the reproducible environment
The principle: your development environment is defined in code (.devcontainer/). Every developer who opens the project gets exactly the same environment, with the same tools, same versions, same VS Code extensions.
The Dev Container is a development container – it serves only for coding. It does not need Docker, kubectl, or Helm. Tilt runs on the host.
.devcontainer/Dockerfile:
FROM dp.apps.rancher.io/containers/nodejs:24-dev

# System tools (available in the SLE_BCI repo)
# gawk: required by VS Code Server (check-requirements.sh)
RUN zypper --non-interactive install -y git openssh make gawk \
&& zypper clean -a.devcontainer/devcontainer.json:
{
  "name": "Message Wall - Node.js",
  "build": {
    "dockerfile": "Dockerfile"
  },
  "customizations": {
    "vscode": {
      "extensions": [
        "ms-kubernetes-tools.vscode-kubernetes-tools"
      ],
      "settings": {
        "vs-kubernetes.disable-linters": true
      }
    }
  },
  "postCreateCommand": "if [ -f package.json ]; then npm install --no-package-lock; fi"
}
No
docker,kubectl,helm, ortiltin the dev container. Tilt runs on the host. The Kubernetes extension provides IntelliSense for K8s manifest editing. Thekubeconfig not foundwarning is expected and harmless – the cluster explorer will not work inside the container but autocompletion does.
When VS Code is connected to a Dev Container, all its integrated terminals open inside the container. But Tilt must run on the host (where docker, kubectl, and helm are). Use a separate terminal (Terminal.app, iTerm2, Warp, Windows Terminal…) or a second VS Code window opened on the same folder without “Reopen in Container”.
8.2 Resource requests and limits
In the demo, the deployment has no resources block for simplicity. In production (or shared clusters), you should always define them:
resources:
  requests:
    cpu: 100m           # 0.1 vCPU -- scheduler reserves this
    memory: 128Mi       # 128 MB -- guaranteed minimum
  limits:
    cpu: 500m           # 0.5 vCPU -- ceiling, throttled beyond
    memory: 256Mi       # 256 MB -- OOMKill beyond
Without requests or limits, a pod can consume all node resources and impact other workloads – the “noisy neighbor” problem. requests are for the scheduler (intelligent placement), limits protect the node (CPU throttling, OOMKill if memory exceeds).
8.3 Testcontainers: integration tests
The concept: Testcontainers is a library that spins up ephemeral Docker containers in your integration tests. Need a PostgreSQL to test your SQL queries? Testcontainers launches one, runs your tests, and destroys it when done.
Why it matters:
-
Reproducibility: each test starts a fresh database – no pollution between tests.
-
No mocks: you test against the real database, not a mock that can diverge.
-
CI-friendly: works in GitHub Actions, GitLab CI, etc. (just needs Docker).
Testcontainers uses the host’s Docker daemon. With Rancher Desktop (dockerd), it works directly – no special configuration needed.
Configuration:
# macOS / Linux -- already configured if ~/.rd/bin is in PATH
export DOCKER_HOST=unix://$HOME/.rd/run/docker.sock
Example (Node.js):
const { GenericContainer } = require('testcontainers');
const { Client } = require('pg');

describe('Database integration', () => {
  let container, client;

  beforeAll(async () => {
    container = await new GenericContainer('dp.apps.rancher.io/containers/postgresql:17')
      .withExposedPorts(5432)
      .withEnvironment({ POSTGRES_USER: 'test', POSTGRES_PASSWORD: 'test', POSTGRES_DB: 'test' })
      .start();

    client = new Client({
      host: container.getHost(),
      port: container.getMappedPort(5432),
      user: 'test', password: 'test', database: 'test',
    });
    await client.connect();
  });

  afterAll(async () => {
    await client.end();
    await container.stop();
  });

  test('should insert and retrieve data', async () => {
    await client.query('CREATE TABLE test (id SERIAL, name TEXT)');
    await client.query("INSERT INTO test (name) VALUES ('hello')");
    const result = await client.query('SELECT * FROM test');
    expect(result.rows).toHaveLength(1);
  });
});
Testcontainers vs Tilt+Helm:
| Testcontainers | Tilt + Helm | |
|---|---|---|
Lifecycle |
Ephemeral (1 test run) |
Persistent (dev session duration) |
Data |
Fresh each run |
Persistent (unless purged) |
Usage |
Integration tests in CI |
Daily local development |
8.4 mirrord: local debug on a remote cluster
mirrord lets you run a local process while connecting it to the network and filesystem of a pod in a remote Kubernetes cluster. The code runs locally, but “sees” the cluster environment.
No need for mirrord if you have a local cluster with all dependencies and your app has 1 to 5 microservices.
mirrord becomes interesting when the app has 20+ microservices (impossible to run everything locally), you need managed services not available locally, or you want local debugging (breakpoints in VS Code) with the context of a real cluster.
The winning combination – Tilt for daily inner loop (local cluster), mirrord for occasional debugging on staging. The two tools are complementary.
8.5 Helm and Kustomize
Helm lets you template your Kubernetes manifests and distribute them as “charts”. It is the equivalent of a package manager (npm, zypper…) for Kubernetes. values.yaml customizes deployments per environment (dev, staging, prod). Helm tracks deployed versions and enables rollback.
Kustomize works by overlaying patches on base YAML manifests. No template language: you apply declarative transformations. Natively integrated into kubectl (kubectl apply -k).
Helm or Kustomize? – The two are not mutually exclusive. A common approach: use Helm for external charts (databases, monitoring) and Kustomize to customize your own manifests per environment.
8.6 Security: Trivy and Cosign
Trivy (available in Application Collection) scans your container images, Kubernetes files, dependencies, and IaC code to detect known vulnerabilities (CVEs), misconfigurations, and exposed secrets.
trivy image dp.apps.rancher.io/containers/nodejs:24
trivy k8s --report summary cluster
Cosign (available in Application Collection) lets you cryptographically sign your container images. It is a pillar of supply chain security.
cosign sign --key cosign.key myregistry/myapp:v1.0
cosign verify --key cosign.pub myregistry/myapp:v1.0
8.7 GitOps: Argo CD and Argo Rollouts
GitOps is the principle that Git is the single source of truth for the desired state of your infrastructure and applications. A deployment tool watches the Git repository and automatically reconciles the cluster state with the state declared in Git.
Argo CD (available in Application Collection) is a declarative continuous deployment tool for Kubernetes: declarative state in Git, auto-sync with drift detection, multi-cluster support, and a web UI for visualization.
Argo Rollouts (also in Application Collection) adds blue-green and canary deployment strategies to Kubernetes, with automatic metric analysis to decide whether to promote or rollback a deployment.
8.8 The “12 Factor App” for Kubernetes
-
Configuration via environment: use ConfigMaps and Secrets, never hardcode config in the image.
-
Stateless processes: each instance of your app must be identical and replaceable.
-
Port binding: your app exposes a port, Kubernetes handles routing via Services.
-
Logs to stdout: never write to log files. Let Kubernetes / Fluent Bit collect stdout.
-
Health checks: always implement liveness and readiness probes.
-
Metrics: expose a
/metricsPrometheus endpoint. Observability is not a luxury, it is a standard.
8.9 Minimal images
-
BCI Micro: for static binaries (Go, Rust). No package manager, minimal attack surface.
-
BCI BusyBox: for cases requiring a minimal shell.
-
BCI Base: for cases requiring zypper/RPM.
-
Multi-stage builds: build with the dev image, copy the result into BCI Micro.
8.10 Infrastructure as Code
-
Everything is in Git: Dockerfiles, Helm charts, Kustomize overlays, Tiltfiles, devcontainer.json, Grafana dashboards.
-
No manual
kubectl applyin staging/prod. Everything goes through GitOps (Argo CD). -
Ephemeral environments (preview environments) are created automatically on each PR.
9. Glossary
| Term | Definition |
|---|---|
Inner Loop |
Fast local development cycle: code, build, deploy, test |
Outer Loop |
Automated post-commit cycle: CI/CD, tests, deployment |
Tilt |
Inner loop tool with live_update and web dashboard |
Tiltfile |
Tilt config file in Starlark (Python-like DSL) |
live_update |
Tilt feature: file sync into a container without rebuild |
restart_process |
Tilt extension: restarts the application process after a live_update |
Dev Containers |
Open specification for defining a dev env in a container |
mirrord |
Connects a local process to a remote K8s cluster context |
Testcontainers |
Library for containerized dependencies in tests |
Helm |
Package manager for Kubernetes (charts) |
Kustomize |
K8s manifest customization via patches/overlays |
Trivy |
Vulnerability scanner for images, code, IaC |
Cosign |
Container image signing/verification tool |
Argo CD |
GitOps continuous deployment tool for Kubernetes |
Argo Rollouts |
Canary and blue-green deployments for Kubernetes |
GitOps |
Paradigm: Git = source of truth for cluster state |
Keycloak |
Open-source identity and access management (OAuth2 / OpenID Connect) |
Prometheus |
Monitoring system that collects metrics via HTTP scraping |
Grafana |
Metrics visualization platform (dashboards) |
prom-client |
Node.js library for exposing Prometheus metrics |
Sidecar |
Auxiliary container in a pod, running a complementary task |
ConfigMap |
K8s resource for storing configuration (here: dashboards, datasources) |
k3s |
Lightweight Kubernetes distribution used by Rancher Desktop |
BCI |
Base Container Images from SUSE, foundation of Application Collection images |
OCI |
Open Container Initiative: standard for container images |
imagePullPolicy |
K8s policy: |
10. Further reading
-
Rancher Desktop: rancherdesktop.io
-
SUSE Application Collection: apps.suse.com
-
Demo source code: github.com/fxHouard/Rancher-Developer-Access-Demo
-
Tilt: tilt.dev – and the blog post Tilt + Rancher Desktop
-
mirrord: mirrord.dev
-
Testcontainers: testcontainers.com
-
Dev Containers Spec: containers.dev
-
Argo CD: argoproj.github.io/cd
-
Helm: helm.sh
-
Trivy: aquasecurity.github.io/trivy
-
Cosign: docs.sigstore.dev/cosign
-
Keycloak: keycloak.org
-
Prometheus: prometheus.io
-
Grafana: grafana.com
-
prom-client (Node.js): github.com/siimon/prom-client
Happy Kubernetes development!