11 Monitoring clusters #
This chapter describes how to monitor a cluster's health and view its history.
11.1 Monitoring cluster status #
Hawk2 has different screens for monitoring single clusters and multiple clusters: the and the screen.
11.1.1 Monitoring a single cluster #
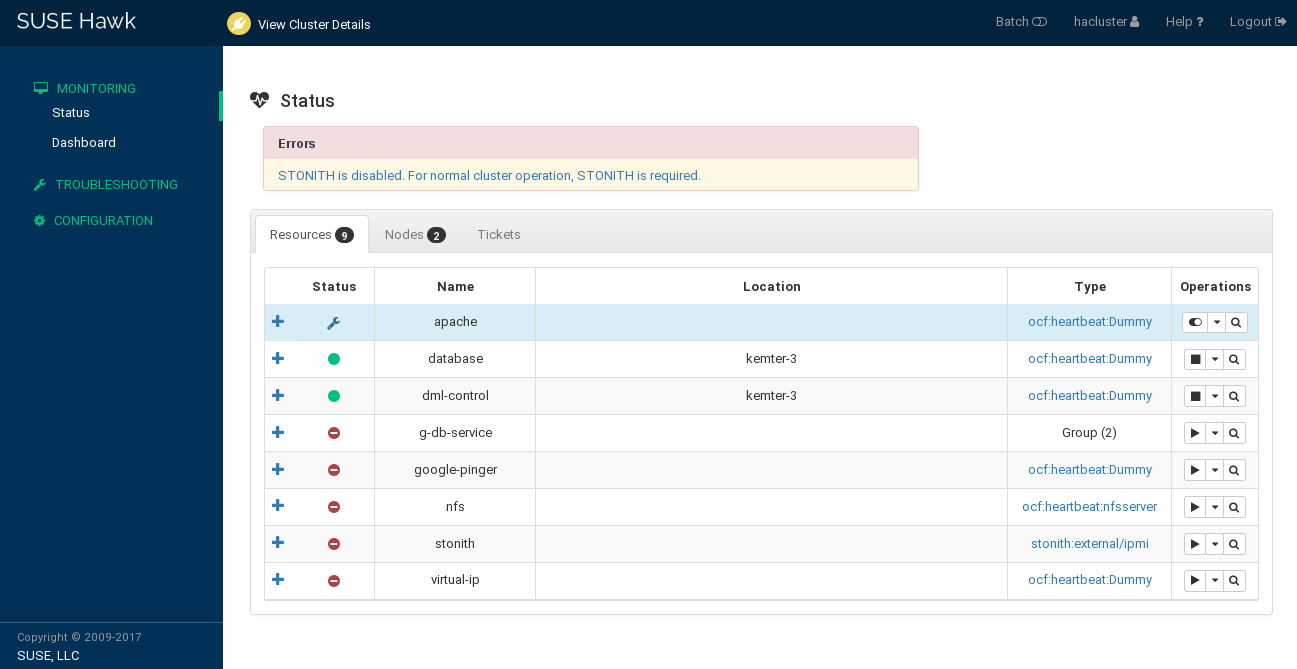
To monitor a single cluster, use the screen. After you have logged in to Hawk2, the screen is displayed by default. An icon in the upper right corner shows the cluster status at a glance. For further details, have a look at the following categories:
- Errors
If errors have occurred, they are shown at the top of the page.
- Resources
Shows the configured resources including their , (ID), (node on which they are running), and resource agent . From the column, you can start or stop a resource, trigger several actions, or view details. Actions that can be triggered include setting the resource to maintenance mode (or removing maintenance mode), migrating it to a different node, cleaning up the resource, showing any recent events, or editing the resource.
- Nodes
Shows the nodes belonging to the cluster site you are logged in to, including the nodes' and . In the and columns, you can set or remove the
maintenanceorstandbyflag for a node. The column allows you to view recent events for the node or further details: for example, if autilization,standbyormaintenanceattribute is set for the respective node.- Tickets
Only shown if tickets have been configured (for use with Geo clustering).
11.1.2 Monitoring multiple clusters #
To monitor multiple clusters, use the Hawk2 . The cluster information displayed in the screen is stored on the server side. It is synchronized between the cluster nodes (if passwordless SSH access between the cluster nodes has been configured). For details, see Section D2, “Configuring a passwordless SSH account”. However, the machine running Hawk2 does not even need to be part of any cluster for that purpose—it can be a separate, unrelated system.
In addition to the general Hawk2 requirements, the following prerequisites need to be fulfilled to monitor multiple clusters with Hawk2:
All clusters to be monitored from Hawk2's must be running SUSE Linux Enterprise High Availability 15 SP4.
If you did not replace the self-signed certificate for Hawk2 on every cluster node with your own certificate (or a certificate signed by an official Certificate Authority) yet, do the following: Log in to Hawk2 on every node in every cluster at least once. Verify the certificate (or add an exception in the browser to bypass the warning). Otherwise Hawk2 cannot connect to the cluster.
Log in to Hawk2:
https://HAWKSERVER:7630/
From the left navigation bar, select › .
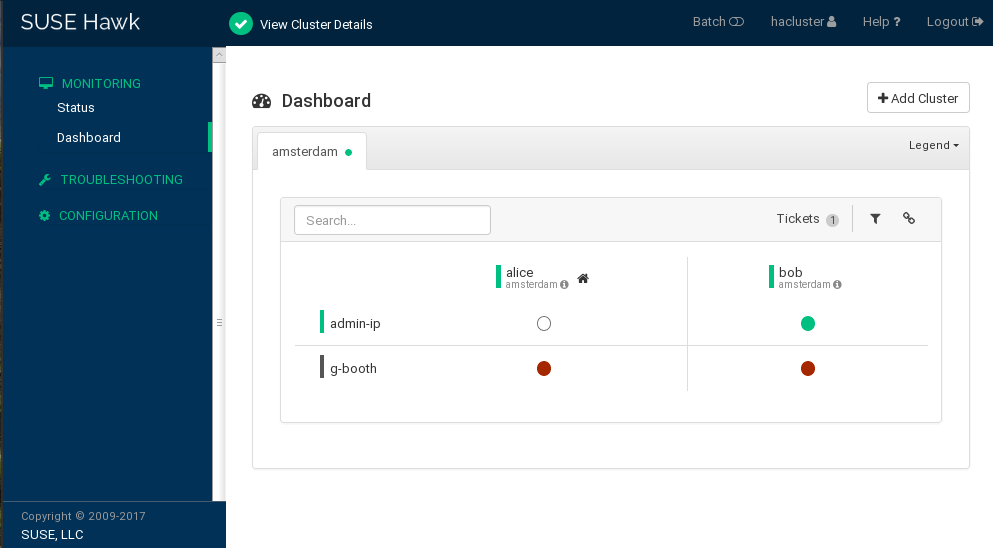
Hawk2 shows an overview of the resources and nodes on the current cluster site. In addition, it shows any that have been configured for use with a Geo cluster. If you need information about the icons used in this view, click . To search for a resource ID, enter the name (ID) into the text box. To only show specific nodes, click the filter icon and select a filtering option.
Figure 11.2: Hawk2 dashboard with one cluster site (amsterdam) #To add dashboards for multiple clusters:
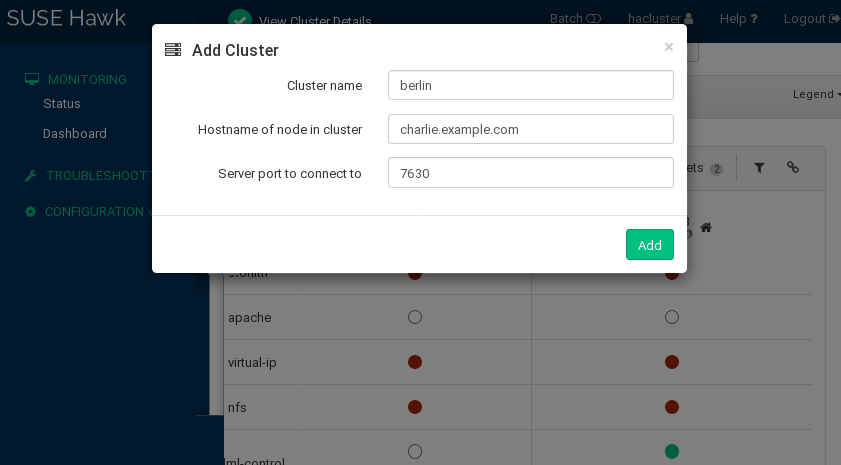
Click .
Enter the with which to identify the cluster in the . For example,
berlin.Enter the fully qualified host name of one of the nodes in the second cluster. For example,
charlie.Click . Hawk2 will display a second tab for the newly added cluster site with an overview of its nodes and resources.
Note: Connection errorIf instead you are prompted to log in to this node by entering a password, you probably did not connect to this node yet and have not replaced the self-signed certificate. In that case, even after entering the password, the connection will fail with the following message:
Error connecting to server. Retrying every 5 seconds... '.To proceed, see Replacing the self-signed certificate.
To view more details for a cluster site or to manage it, switch to the site's tab and click the chain icon.
Hawk2 opens the view for this site in a new browser window or tab. From there, you can administer this part of the Geo cluster.
To remove a cluster from the dashboard, click the
xicon on the right-hand side of the cluster's details.
11.2 Verifying cluster health #
You can check the health of a cluster using either Hawk2 or crmsh.
11.2.1 Verifying cluster health with Hawk2 #
Hawk2 provides a wizard which checks and detects issues with your cluster. After the analysis is complete, Hawk2 creates a cluster report with further details. To verify cluster health and generate the report, Hawk2 requires passwordless SSH access between the nodes. Otherwise it can only collect data from the current node. If you have set up your cluster with the bootstrap scripts, provided by the CRM Shell, passwordless SSH access is already configured. In case you need to configure it manually, see Section D2, “Configuring a passwordless SSH account”.
Log in to Hawk2:
https://HAWKSERVER:7630/
From the left navigation bar, select › .
Expand the category.
Select the wizard.
Confirm with .
Enter the root password for your cluster and click . Hawk2 will generate the report.
11.2.2 Getting health status with crmsh #
The “health” status of a cluster or node can be displayed with so called scripts. A script can perform different tasks—they are not targeted to health. However, for this subsection, we focus on how to get the health status.
To get all the details about the health command, use
describe:
#crm script describe health
It shows a description and a list of all parameters and their default
values. To execute a script, use run:
#crm script run health
If you prefer to run only one step from the suite, the
describe command lists all available steps in the
Steps category.
For example, the following command executes the first step of the
health command. The output is stored in the
health.json file for further investigation:
#crm script run health statefile='health.json'
It is also possible to run the above commands with
crm cluster health.
For additional information regarding scripts, see http://crmsh.github.io/scripts/.
11.3 Viewing the cluster history #
Hawk2 provides the following possibilities to view past events on the cluster (on different levels and in varying detail):
You can also view cluster history information using crmsh:
11.3.1 Viewing recent events of nodes or resources #
Log in to Hawk2:
https://HAWKSERVER:7630/
From the left navigation bar, select › . It lists and .
To view recent events of a resource:
Click and select the respective resource.
In the column for the resource, click the arrow down button and select .
Hawk2 opens a new window and displays a table view of the latest events.
To view recent events of a node:
Click and select the respective node.
In the column for the node, select .
Hawk2 opens a new window and displays a table view of the latest events.
11.3.2 Using the history explorer for cluster reports #
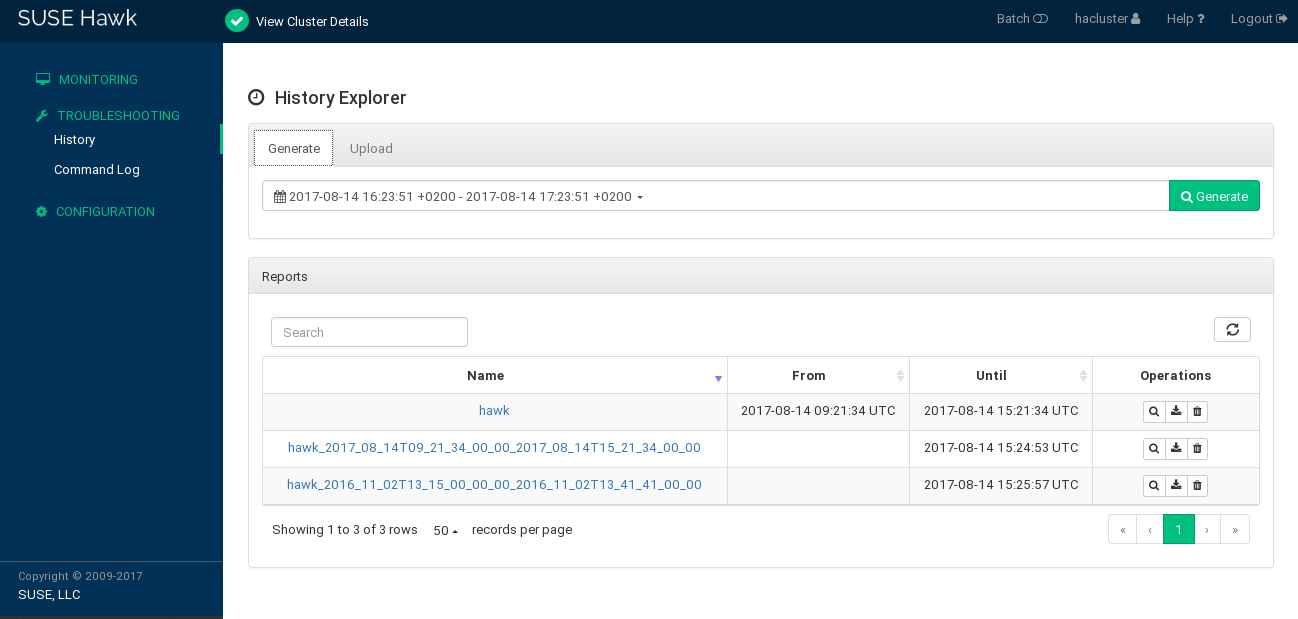
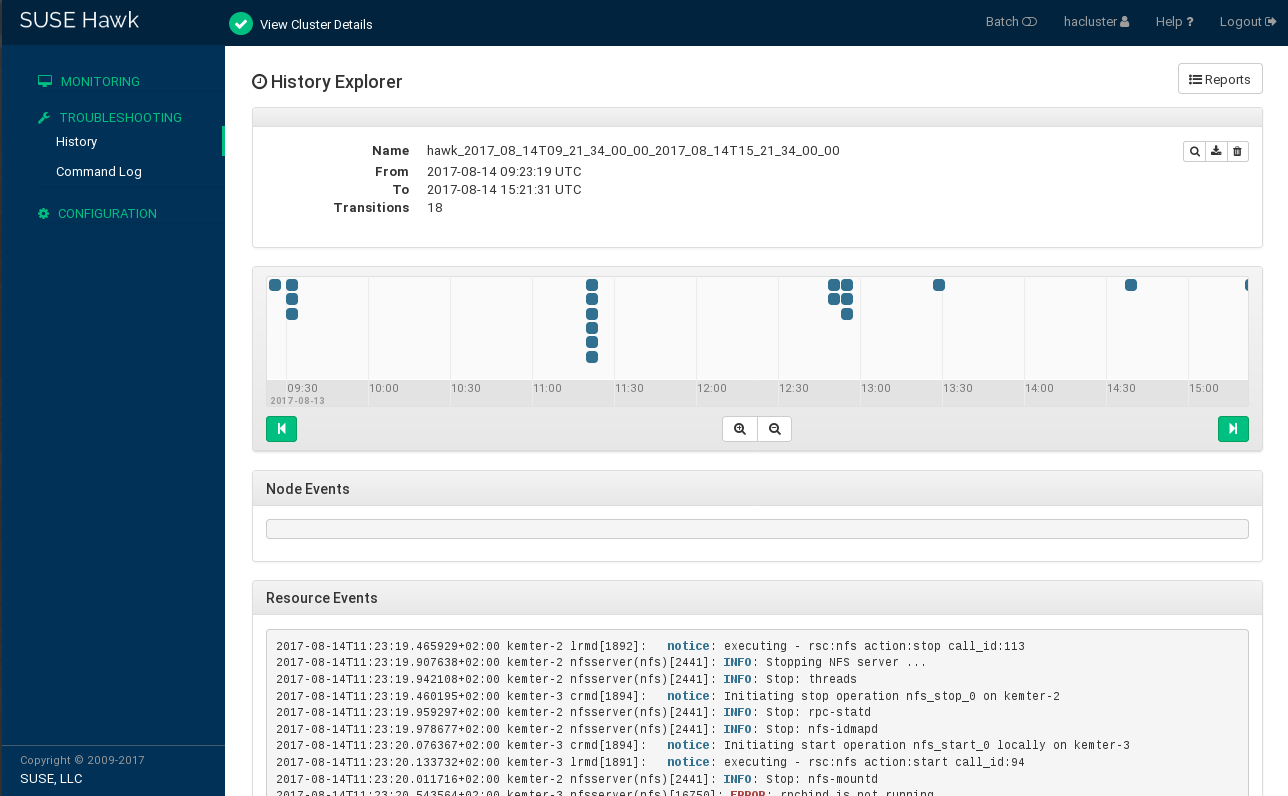
From the left navigation bar, select › to access the . The allows you to create detailed cluster reports and view transition information. It provides the following options:
Create a cluster report for a certain time. Hawk2 calls the
crm reportcommand to generate the report.Allows you to upload
crm reportarchives that have either been created with the CRM Shell directly or even on a different cluster.
After reports have been generated or uploaded, they are shown below . From the list of reports, you can show a report's details, download or delete the report.
Log in to Hawk2:
https://HAWKSERVER:7630/
From the left navigation bar, select › .
The screen opens in the view. By default, the suggested time frame for a report is the last hour.
To create a cluster report:
To immediately start a report, click .
To modify the time frame for the report, click anywhere on the suggested time frame and select another option from the drop-down box. You can also enter a start date, end date and hour, respectively. To start the report, click .
After the report has finished, it is shown below .
To upload a cluster report, the
crm reportarchive must be located on a file system that you can access with Hawk2. Proceed as follows:Switch to the tab.
for the cluster report archive and click .
After the report is uploaded, it is shown below .
To download or delete a report, click the respective icon next to the report in the column.
To view Report details in history explorer, click the report's name or select from the column.
Return to the list of reports by clicking the button.
Name of the report.
Start time of the report.
End time of the report.
Number of transitions plus time line of all transitions in the cluster that are covered by the report. To learn how to view more details for a transition, see Section 11.3.3.
Node events.
Resource events.
11.3.3 Viewing transition details in the history explorer #
For each transition, the cluster saves a copy of the state which it provides
as input to pacemaker-schedulerd.
The path to this archive is logged. All
pe-* files are generated on the Designated
Coordinator (DC). As the DC can change in a cluster, there may be
pe-* files from several nodes. Any pe-*
files are saved snapshots of the CIB, used as input of calculations by pacemaker-schedulerd.
In Hawk2, you can display the name of each pe-*
file plus the time and node on which it was created. In addition, the
can visualize the following details,
based on the respective pe-* file:
Shows snippets of logging data that belongs to the transition. Displays the output of the following command (including the resource agents' log messages):
crm history transition peinput
Shows the cluster configuration at the time that the
pe-*file was created.Shows the differences of configuration and status between the selected
pe-*file and the following one.Shows snippets of logging data that belongs to the transition. Displays the output of the following command:
crm history transition log peinput
This includes details from the following daemons:
pacemaker-schedulerd,pacemaker-controld, andpacemaker-execd.Shows a graphical representation of the transition. If you click , the calculation is simulated (exactly as done by
pacemaker-schedulerd) and a graphical visualization is generated.
Log in to Hawk2:
https://HAWKSERVER:7630/
From the left navigation bar, select › .
If reports have already been generated or uploaded, they are shown in the list of . Otherwise generate or upload a report as described in Procedure 11.2.
Click the report's name or select from the column to open the Report details in history explorer.
To access the transition details, you need to select a transition point in the transition time line that is shown below. Use the and icons and the and icons to find the transition that you are interested in.
To display the name of a
pe-input*file plus the time and node on which it was created, hover the mouse pointer over a transition point in the time line.To view the Transition details in the history explorer, click the transition point for which you want to know more.
To show , , , or , click the respective buttons to show the content described in Transition details in the history explorer.
To return to the list of reports, click the button.
11.3.4 Retrieving history information with crmsh #
Investigating the cluster history is a complex task. To simplify this
task, crmsh contains the history command with its
subcommands. It is assumed SSH is configured correctly.
Each cluster moves states, migrates resources, or starts important
processes. All these actions can be retrieved by subcommands of
history.
By default, all history commands look at the events of
the last hour. To change this time frame, use the
limit subcommand. The syntax is:
#crm historycrm(live)history#limit FROM_TIME [TO_TIME]
Some valid examples include:
limit 4:00pm,limit 16:00Both commands mean the same, today at 4pm.
limit 2012/01/12 6pmJanuary 12th 2012 at 6pm
limit "Sun 5 20:46"In the current year of the current month at Sunday the 5th at 8:46pm
Find more examples and how to create time frames at http://labix.org/python-dateutil.
The info subcommand shows all the parameters which are
covered by the crm report:
crm(live)history#infoSource: live Period: 2012-01-12 14:10:56 - end Nodes: alice Groups: Resources:
To limit crm report to certain parameters view the
available options with the subcommand help.
To narrow down the level of detail, use the subcommand
detail with a level:
crm(live)history#detail 1
The higher the number, the more detailed your report will be. Default is
0 (zero).
After you have set above parameters, use log to show
the log messages.
To display the last transition, use the following command:
crm(live)history#transition -1INFO: fetching new logs, please wait ...
This command fetches the logs and runs dotty (from the
graphviz package) to show the
transition graph. The shell opens the log file which you can browse with
the ↓ and ↑ cursor keys.
If you do not want to open the transition graph, use the
nograph option:
crm(live)history#transition -1 nograph
11.4 Monitoring system health with the SysInfo resource agent #
To prevent a node from running out of disk space and thus being unable to
manage any resources that have been assigned to it, SUSE Linux Enterprise High Availability
provides a resource agent,
ocf:pacemaker:SysInfo. Use it to monitor a
node's health with regard to disk partitions.
The SysInfo RA creates a node attribute named
#health_disk which will be set to
red if any of the monitored disks' free space is below
a specified limit.
To define how the CRM should react in case a node's health reaches a
critical state, use the global cluster option
node-health-strategy.
To automatically move resources away from a node in case the node runs out of disk space, proceed as follows:
Configure an
ocf:pacemaker:SysInforesource:primitive sysinfo ocf:pacemaker:SysInfo \ params disks="/tmp /var"1 min_disk_free="100M"2 disk_unit="M"3 \ op monitor interval="15s"Which disk partitions to monitor. For example,
/tmp,/usr,/var, and/dev. To specify multiple partitions as attribute values, separate them with a blank.Note:/file system always monitoredYou do not need to specify the root partition (
/) indisks. It is always monitored by default.The minimum free disk space required for those partitions. Optionally, you can specify the unit to use for measurement (in the example above,
Mfor megabytes is used). If not specified,min_disk_freedefaults to the unit defined in thedisk_unitparameter.The unit in which to report the disk space.
To complete the resource configuration, create a clone of
ocf:pacemaker:SysInfoand start it on each cluster node.Set the
node-health-strategytomigrate-on-red:property node-health-strategy="migrate-on-red"
In case of a
#health_diskattribute set tored, thepacemaker-schedulerdadds-INFto the resources' score for that node. This will cause any resources to move away from this node. The STONITH resource will be the last one to be stopped but even if the STONITH resource is not running anymore, the node can still be fenced. Fencing has direct access to the CIB and will continue to work.
After a node's health status has turned to red, solve
the issue that led to the problem. Then clear the red
status to make the node eligible again for running resources. Log in to
the cluster node and use one of the following methods:
Execute the following command:
#crm node status-attr NODE delete #health_diskRestart the cluster services on that node.
Reboot the node.
The node will be returned to service and can run resources again.
