Operations Guide
- 1 Operations Overview
- 2 Tutorials
- 3 Third-Party Integrations
- 4 Managing Identity
- 5 Managing Compute
- 6 Managing ESX
- 7 Managing Block Storage
- 8 Managing Object Storage
- 9 Managing Networking
- 10 Managing the Dashboard
- 11 Managing Orchestration
- 12 Managing Monitoring, Logging, and Usage Reporting
- 13 System Maintenance
- 14 Backup and Restore
- 15 Troubleshooting Issues
15 Troubleshooting Issues
- 15.1 General Troubleshooting
- 15.2 Control Plane Troubleshooting
- 15.3 Troubleshooting Compute Service
- 15.4 Network Service Troubleshooting
- 15.5 Troubleshooting the Image (Glance) Service
- 15.6 Storage Troubleshooting
- 15.7 Monitoring, Logging, and Usage Reporting Troubleshooting
- 15.8 Backup and Restore Troubleshooting
- 15.9 Orchestration Troubleshooting
- 15.10 Troubleshooting Tools
Troubleshooting and support processes for solving issues in your environment.
This section contains troubleshooting tasks for your HPE Helion OpenStack cloud.
15.1 General Troubleshooting #
General troubleshooting procedures for resolving your cloud issues including steps for resolving service alarms and support contact information.
Before contacting support to help you with a problem on SUSE OpenStack Cloud, we recommend
gathering as much information as possible about your system and the
problem. For this purpose, HPE Helion OpenStack ships with a tool called
supportconfig. It gathers system information such as the
current kernel version being used, the hardware, RPM database, partitions,
and other items. supportconfig also collects the most
important log files. This information assists support staff to identify and
solve your problem.
Always run supportconfig on the Cloud Lifecycle Manager and on the
Control Node(s). If a Compute Node or a Storage Node is part of the problem, run
supportconfig on the affected node as well. For details on
how to run supportconfig, see
https://documentation.suse.com/sles/12-SP5/single-html/SLES-admin/#cha-adm-support.
15.1.1 Alarm Resolution Procedures #
HPE Helion OpenStack provides a monitoring solution based on OpenStack’s Monasca service. This service provides monitoring and metrics for all OpenStack components, as well as much of the underlying system. By default, HPE Helion OpenStack comes with a set of alarms that provide coverage of the primary systems. In addition, you can define alarms based on threshold values for any metrics defined in the system. You can view alarm information in the Operations Console. You can also receive or deliver this information to others by configuring email or other mechanisms. Alarms provide information about whether a component failed and is affecting the system, and also what condition triggered the alarm.
Here is a list of the included service-specific alarms and the recommended
troubleshooting steps. We have organized these alarms by the section of the
HPE Helion OpenStack Operations Console, they are organized in as well as the
service dimension defined.
15.1.1.1 Compute Alarms #
These alarms show under the Compute section of the HPE Helion OpenStack Operations Console.
15.1.1.1.1 SERVICE: COMPUTE #
| Alarm Information | Mitigation Tasks |
|---|---|
|
Name: HTTP Status
Description: This is a Likely cause: Process crashed. | Restart the nova-api process on the affected
node. Review the nova-api.log files. Try to connect
locally to the http port that is found in the dimension field of the alarm
to see if the connection is accepted. |
|
Name: Host Status Description:: Alarms when the specified host is down or not reachable. Likely cause: The host is down, has been rebooted, or has network connectivity issues. | If it is a single host, attempt to restart the system. If it is multiple hosts, investigate networking issues. |
|
Name: Process Bound Check
Description:: Likely cause: Process crashed or too many processes running | Stop all the processes and restart the nova-api process on the affected host. Review the system and nova-api logs. |
|
Name: Process Check
Description:: Separate alarms for each of these Nova services,
specified by the
Likely cause: Process specified by the |
Restart the process on the affected node using these steps:
Review the associated logs. The logs will be in the format of
|
|
Name: nova.heartbeat Description:: Check that all services are sending heartbeats. Likely cause: Process for service specified in the alarm has crashed or is hung and not reporting its status to the database. Alternatively it may be the service is fine but an issue with messaging or the database which means the status is not being updated correctly. | Restart the affected service. If the service is reporting OK the issue may be with RabbitMQ or MySQL. In that case, check the alarms for those services. |
|
Name: Service Log Directory Size Description:: Service log directory consuming more disk than its quota.
Likely cause: This could be due to a service set to
| Find the service that is consuming too much disk space. Look at the
logs. If DEBUG log entries exist, set the logging level
to INFO. If the logs are repeatedly logging an error
message, do what is needed to resolve the error. If old log files exist,
configure log rotate to remove them. You could also choose to remove old
log files by hand after backing them up if needed. |
15.1.1.1.2 SERVICE: IMAGE-SERVICE in Compute section #
| Alarm Information | Mitigation Tasks |
|---|---|
|
Name: HTTP Status
Description:: Separate alarms for
each of these Glance services, specified by the
Likely cause: API is unresponsive. |
Restart the process on the affected node using these steps:
Review the associated logs. |
|
Name: Service Log Directory Size Description:: Service log directory consuming more disk than its quota.
Likely cause: This could be due to a service set to
| Find the service that is consuming too much disk space. Look at
the logs. If DEBUG log entries exist, set the logging
level to INFO. If the logs are repeatedly logging an
error message, do what is needed to resolve the error. If old log files
exist, configure log rotate to remove them. You could also choose to
remove old log files by hand after backing them up if needed. |
15.1.1.1.3 SERVICE: BAREMETAL in Compute section #
| Alarm Information | Mitigation Tasks |
|---|---|
|
Name: Process Check
Description: Alarms when the
specified process is not running: Likely cause: The Ironic API is unresponsive. |
Restart the
|
|
Name: Process Check
Description: Alarms when the
specified process is not running:
Likely cause: The
|
Restart the
|
|
Name: HTTP Status Description: Alarms when the specified HTTP endpoint is down or not reachable. Likely cause: The API is unresponsive. |
|
|
Name: Service Log Directory Size Description: Service log directory consuming more disk than its quota.
Likely cause: This could be due to a
service set to | Find the service that is consuming too much disk space. Look at
the logs. If DEBUG log entries exist, set the logging
level to INFO. If the logs are repeatedly logging an
error message, do what is needed to resolve the error. If old log files
exist, configure log rotate to remove them. You could also choose to
remove old log files by hand after backing them up if needed. |
15.1.1.2 Storage Alarms #
These alarms show under the Storage section of the HPE Helion OpenStack Operations Console.
15.1.1.2.1 SERVICE: OBJECT-STORAGE #
| Alarm Information | Mitigation Tasks |
|---|---|
|
Name: swiftlm-scan monitor
Description: Alarms if
Likely cause: The
|
Click on the alarm to examine the sudo swiftlm-scan | python -mjson.tool
The |
|
Name: Swift account replicator last completed in 12 hours
Description: Alarms if an
Likely cause: This can indicate that
the |
Another cause of this problem may be that a file system may be corrupt. Look for sign of this in these logs on the affected node: /var/log/swift/swift.log /var/log/kern.log The file system may need to be wiped, contact Professional Services for advice on the best way to do that if needed. You can then reformat the file system with these steps:
|
|
Name: Swift container replicator last completed in 12 hours Description: Alarms if a container-replicator process did not complete a replication cycle within the last 12 hours Likely cause: This can indicate that the container-replication process is stuck. |
SSH to the affected host and restart the process with this command: sudo systemctl restart swift-container-replicator Another cause of this problem may be that a file system may be corrupt. Look for sign of this in these logs on the affected node: /var/log/swift/swift.log /var/log/kern.log The file system may need to be wiped, contact Professional Services for advice on the best way to do that if needed. You can then reformat the file system with these steps:
|
|
Name: Swift object replicator last completed in 24 hours Description: Alarms if an object-replicator process did not complete a replication cycle within the last 24 hours Likely cause: This can indicate that the object-replication process is stuck. |
SSH to the affected host and restart the process with this command: sudo systemctl restart swift-account-replicator Another cause of this problem may be that a file system may be corrupt. Look for sign of this in these logs on the affected node: /var/log/swift/swift.log /var/log/kern.log The file system may need to be wiped, contact Professional Services for advice on the best way to do that if needed. You can then reformat the file system with these steps:
|
|
Name: Swift configuration file ownership
Description: Alarms if
files/directories in
Likely cause: For files in
|
For files in |
|
Name: Swift data filesystem ownership
Description: Alarms if files or
directories in
Likely cause: For directories in
|
For directories and files in |
|
Name: Drive URE errors detected
Description: Alarms if
Likely cause: An unrecoverable read error occurred when Swift attempted to access a directory. |
The UREs reported only apply to file system metadata (that is, directory structures). For UREs in object files, the Swift system automatically deletes the file and replicates a fresh copy from one of the other replicas. UREs are a normal feature of large disk drives. It does not mean that the drive has failed. However, if you get regular UREs on a specific drive, then this may indicate that the drive has indeed failed and should be replaced. You can use standard XFS repair actions to correct the UREs in the file system. If the XFS repair fails, you should wipe the GPT table as follows (where <drive_name> is replaced by the actual drive name): Then follow the steps below which will reformat the drive, remount it, and restart Swift services on the affected node.
It is safe to reformat drives containing Swift data because Swift maintains other copies of the data (usually, Swift is configured to have three replicas of all data). |
|
Name: Swift service
Description: Alarms if a Swift
process, specified by the
Likely cause: A daemon specified by
the |
Examine the
Restart Swift processes by running the
|
|
Name: Swift filesystem mount point status Description: Alarms if a file system/drive used by Swift is not correctly mounted.
Likely cause: The device specified by
the The most probable cause is that the drive has failed or that it had a temporary failure during the boot process and remained unmounted. Other possible causes are a file system corruption that prevents the device from being mounted. |
Reboot the node and see if the file system remains unmounted. If the file system is corrupt, see the process used for the "Drive URE errors" alarm to wipe and reformat the drive. |
|
Name: Swift uptime-monitor status
Description: Alarms if the
swiftlm-uptime-monitor has errors using Keystone ( Likely cause: The swiftlm-uptime-monitor cannot get a token from Keystone or cannot get a successful response from the Swift Object-Storage API. |
Check that the Keystone service is running:
Check that Swift is running:
Restart the swiftlm-uptime-monitor as follows:
|
|
Name: Swift Keystone server connect Description: Alarms if a socket cannot be opened to the Keystone service (used for token validation)
Likely cause: The Identity service
(Keystone) server may be down. Another possible cause is that the
network between the host reporting the problem and the Keystone server
or the |
The |
|
Name: Swift service listening on ip and port Description: Alarms when a Swift service is not listening on the correct port or ip. Likely cause: The Swift service may be down. |
Verify the status of the Swift service on the affected host, as
specified by the
If an issue is determined, you can stop and restart the Swift service with these steps:
|
|
Name: Swift rings checksum Description: Alarms if the Swift rings checksums do not match on all hosts.
Likely cause: The Swift ring files
must be the same on every node. The files are located in
If you have just changed any of the rings and you are still deploying the change, it is normal for this alarm to trigger. |
If you have just changed any of your Swift rings, if you wait until the changes complete then this alarm will likely clear on its own. If it does not, then continue with these steps.
Use
Run the
|
|
Name: Swift memcached server connect Description: Alarms if a socket cannot be opened to the specified memcached server. Likely cause: The server may be down. The memcached daemon running the server may have stopped. |
If the server is down, restart it.
If memcached has stopped, you can restart it by using the
If the server is running and memcached is running, there may be a network problem blocking port 11211. If you see sporadic alarms on different servers, the system may be running out of resources. Contact Professional Services for advice. |
|
Name: Swift individual disk usage exceeds 80% Description: Alarms when a disk drive used by Swift exceeds 80% utilization. Likely cause: Generally all disk drives will fill roughly at the same rate. If an individual disk drive becomes filled faster than other drives it can indicate a problem with the replication process. |
If many or most of your disk drives are 80% full, you need to add more nodes to your system or delete existing objects. If one disk drive is noticeably (more than 30%) more utilized than the average of other disk drives, check that Swift processes are working on the server (use the steps below) and also look for alarms related to the host. Otherwise continue to monitor the situation.
|
|
Name: Swift individual disk usage exceeds 90% Description: Alarms when a disk drive used by Swift exceeds 90% utilization. Likely cause: Generally all disk drives will fill roughly at the same rate. If an individual disk drive becomes filled faster than other drives it can indicate a problem with the replication process. |
If one disk drive is noticeably (more than 30%) more utilized than the average of other disk drives, check that Swift processes are working on the server, using these steps:
Also look for alarms related to the host. An individual disk drive filling can indicate a problem with the replication process.
Restart Swift on that host using the
If the utilization does not return to similar values as other disk drives, you can reformat the disk drive. You should only do this if the average utilization of all disk drives is less than 80%. To format a disk drive contact Professional Services for instructions. |
|
Name: Swift total disk usage exceeds 80% Description: Alarms when the average disk utilization of Swift disk drives exceeds 80% utilization. Likely cause: The number and size of objects in your system is beginning to fill the available disk space. Account and container storage is included in disk utilization. However, this generally consumes 1-2% of space compared to objects, so object storage is the dominate consumer of disk space. |
You need to add more nodes to your system or delete existing objects to remain under 80% utilization.
If you delete a project/account, the objects in that account are not
removed until a week later by the |
|
Name: Swift total disk usage exceeds 90% Description: Alarms when the average disk utilization of Swift disk drives exceeds 90% utilization. Likely cause: The number and size of objects in your system is beginning to fill the available disk space. Account and container storage is included in disk utilization. However, this generally consumes 1-2% of space compared to objects, so object storage is the dominate consumer of disk space. |
If your disk drives are 90% full, you must immediately stop all applications that put new objects into the system. At that point you can either delete objects or add more servers.
Using the steps below, set the
If you allow your file systems to become full, you will be unable to delete objects or add more nodes to the system. This is because the system needs some free space to handle the replication process when adding nodes. With no free space, the replication process cannot work. |
|
Name: Swift service per-minute availability Description: Alarms if the Swift service reports unavailable for the previous minute.
Likely cause: The
|
There are many reasons why the endpoint may stop running. Check:
|
|
Name: Swift rsync connect Description: Alarms if a socket cannot be opened to the specified rsync server Likely cause: The rsync daemon on the specified node cannot be contacted. The most probable cause is that the node is down. The rsync service might also have been stopped on the node. |
Reboot the server if it is down. Attempt to restart rsync with this command: systemctl restart rsync.service |
|
Name: Swift smart array controller status Description: Alarms if there is a failure in the Smart Array. Likely cause: The Smart Array or Smart HBA controller has a fault or a component of the controller (such as a battery) is failed or caching is disabled. The HPE Smart Storage Administrator (HPE SSA) CLI component will have to be installed for SSACLI status to be reported. HPE-specific binaries that are not based on open source are distributed directly from and supported by HPE. To download and install the SSACLI utility, please refer to: https://support.hpe.com/hpsc/swd/public/detail?swItemId=MTX_3d16386b418a443388c18da82f |
Log in to the reported host and run these commands to find out the status of the controllers: sudo hpssacli => controller show all detail For hardware failures (such as failed battery), replace the failed component. If the cache is disabled, reenable the cache. |
|
Name: Swift physical drive status Description: Alarms if there is a failure in the Physical Drive. Likely cause:A disk drive on the server has failed or has warnings. |
Log in to the reported and run these commands to find out the status of the drive: sudo hpssacli => ctrl slot=1 pd all show Replace any broken drives. |
|
Name: Swift logical drive status Description: Alarms if there is a failure in the Logical Drive. Likely cause: A LUN on the server is degraded or has failed. |
Log in to the reported host and run these commands to find out the status of the LUN: sudo hpssacli => ctrl slot=1 ld all show => ctrl slot=1 pd all show Replace any broken drives. |
|
Name: Process Check Description: Alarms when the specified process is not running.
Likely cause: If the
|
If the |
|
Name: HTTP Status Description: Alarms when the specified HTTP endpoint is down or not reachable.
Likely cause: If the
|
If the |
|
Name: Service Log Directory Size Description: Service log directory consuming more disk than its quota.
Likely cause: This could be due to a
service set to |
Find the service that is consuming too much disk space. Look at the
logs. If |
15.1.1.2.2 SERVICE: BLOCK-STORAGE in Storage section #
| Alarm Information | Mitigation Tasks |
|---|---|
|
Name: Process Check
Description: Separate alarms for each
of these Cinder services, specified by the
Likely cause: Process crashed. |
Restart the process on the affected node. Review the associated logs.
|
|
Name: Process Check
Description: Alarms when the specified
process is not running: Likely cause: Process crashed. |
Alert may be incorrect if the service has migrated. Validate that the service is intended to be running on this node before restarting the service. Review the associated logs. |
|
Name: Process Check Description: Alarms when the specified process is not running: process_name=cinder-scheduler Likely cause: Process crashed. |
Restart the process on the affected node. Review the associated logs.
|
|
Name: Process Check
Description: Alarms when the specified
process is not running: Likely cause:Process crashed. |
Alert may be incorrect if the service has migrated. Validate that the service is intended to be running on this node before restarting the service. Review the associated logs. |
|
Name: Cinder backup running <hostname> check Description: Cinder backup singleton check. Likely cause: Backup process is one of the following:
|
Run the
|
|
Name: Cinder volume running <hostname> check Description: Cinder volume singleton check.
Likely cause: The
|
Run the
|
|
Name: Storage faulty lun check Description: Alarms if local LUNs on your HPE servers using smartarray are not OK. Likely cause: A LUN on the server is degraded or has failed. |
Log in to the reported host and run these commands to find out the status of the LUN: sudo hpssacli => ctrl slot=1 ld all show => ctrl slot=1 pd all show Replace any broken drives. |
|
Name: Storage faulty drive check Description: Alarms if the local disk drives on your HPE servers using smartarray are not OK. Likely cause: A disk drive on the server has failed or has warnings. |
Log in to the reported and run these commands to find out the status of the drive: sudo hpssacli => ctrl slot=1 pd all show Replace any broken drives. |
|
Name: Service Log Directory Size Description: Service log directory consuming more disk than its quota.
Likely cause: This could be due to a
service set to |
Find the service that is consuming too much disk space. Look at the
logs. If |
15.1.1.3 Networking Alarms #
These alarms show under the Networking section of the HPE Helion OpenStack Operations Console.
15.1.1.3.1 SERVICE: NETWORKING #
| Alarm Information | Mitigation Tasks |
|---|---|
|
Name: Process Check
Description: Alarms when the specified
process is not running. Separate alarms for each of these Neutron
services, specified by the
Likely cause: Process crashed. |
Restart the process on the affected node:
|
|
Name: Process Check Description: Alarms when the specified process is not running: process_name = neutron-rootwrap Likely cause: Process crashed. |
Currently
|
|
Name: HTTP Status Description: neutron api health check
Likely cause: Process is stuck if the
|
|
|
Name: HTTP Status Description: neutron api health check Likely cause: The node crashed. Alternatively, only connectivity might have been lost if the local node HTTP Status is OK or UNKNOWN. | Reboot the node if it crashed or diagnose the networking connectivity failures between the local and remote nodes. Review the logs. |
|
Name: Service Directory Log Size Description: Service log directory consuming more disk than its quota.
Likely cause: This could be due to a
service set to | Find the service that is consuming too much disk space. Look at
the logs. If DEBUG log entries exist, set the logging
level to INFO. If the logs are repeatedly logging an
error message, do what is needed to resolve the error. If old log files
exist, configure log rotate to remove them. You could also choose to
remove old log files by hand after backing them up if needed. |
15.1.1.3.2 SERVICE: DNS in Networking section #
| Alarm Information | Mitigation Tasks |
|---|---|
|
Name: Process Check Description: Alarms when the specified process is not running: process_name = designate-zone-manager Likely cause: Process crashed. |
Restart the process on the affected node using these steps:
Review the log located at: /var/log/designate/designate-zone-manager.log |
|
Name: Process Check Description: Alarms when the specified process is not running: process_name = designate-pool-manager Likely cause: Process crashed. |
Restart the process on the affected node using these steps:
Review the log located at: /var/log/designate/designate-pool-manager.log |
|
Name: Process Check Description: Alarms when the specified process is not running: process_name = designate-central Likely cause: Process crashed. |
Restart the process on the affected node using these steps:
Review the log located at: /var/log/designate/designate-central.log |
|
Name: Process Check Description: Alarms when the specified process is not running: process_name = designate-api Likely cause: Process crashed. |
Restart the process on the affected node using these steps:
Review the log located at: /var/log/designate/designate-api.log |
|
Name: Process Check Description: Alarms when the specified process is not running: process_name = designate-mdns Likely cause: Process crashed. |
Restart the process on the affected node using these steps:
Review the log located at: /var/log/designate/designate-mdns.log |
|
Name: HTTP Status
Description: Likely cause: The API is unresponsive. |
Restart the process on the affected node using these steps:
Review the logs located at: /var/log/designate/designate-api.log /var/log/designate/designate-central.log |
|
Name: Service Directory Log Size Description: Service log directory consuming more disk than its quota.
Likely cause: This could be due to a
service set to | Find the service that is consuming too much disk space. Look at
the logs. If DEBUG log entries exist, set the logging
level to INFO. If the logs are repeatedly logging an
error message, do what is needed to resolve the error. If old log files
exist, configure log rotate to remove them. You could also choose to
remove old log files by hand after backing them up if needed. |
15.1.1.3.3 SERVICE: BIND in Networking section #
| Alarm Information | Mitigation Tasks |
|---|---|
|
Name: Process Check
Description: Alarms when the specified
process is not running: Likely cause: Process crashed. |
Restart the process on the affected node using these steps:
Review the log located at, querying against /var/log/syslog |
|
Name: Process Check
Description: Alarms when the specified
process is not running: Likely cause: Process crashed. |
Restart the process on the affected node using these steps:
Review the log located at, querying against /var/log/syslog |
15.1.1.4 Identity Alarms #
These alarms show under the Identity section of the HPE Helion OpenStack Operations Console.
15.1.1.4.1 SERVICE: IDENTITY-SERVICE #
| Alarm Information | Mitigation Tasks |
|---|---|
|
Name: HTTP Status Description: This check is contacting the Keystone public endpoint directly. component=keystone-api api_endpoint=public Likely cause: The Keystone service is down on the affected node. |
Restart the Keystone service on the affected node:
|
|
Name: HTTP Status Description: This check is contacting the Keystone admin endpoint directly component=keystone-api api_endpoint=admin Likely cause: The Keystone service is down on the affected node. |
Restart the Keystone service on the affected node:
|
|
Name: HTTP Status Description: This check is contacting the Keystone admin endpoint via the virtual IP address (HAProxy) component=keystone-api monitored_host_type=vip Likely cause: The Keystone service is unreachable via the virtual IP address. |
If neither the You can restart the haproxy service with these steps:
|
|
Name: Process Check
Description: Separate alarms for each
of these Glance services, specified by the
Likely cause: Process crashed. |
You can restart the Keystone service with these steps:
Review the logs in |
|
Name: Service Log Directory Size Description: Service log directory consuming more disk than its quota.
Likely cause: This could be due to a
service set to | Find the service that is consuming too much disk space. Look at
the logs. If DEBUG log entries exist, set the logging
level to INFO. If the logs are repeatedly logging an
error message, do what is needed to resolve the error. If old log files
exist, configure log rotate to remove them. You could also choose to
remove old log files by hand after backing them up if needed. |
15.1.1.5 Telemetry Alarms #
These alarms show under the Telemetry section of the HPE Helion OpenStack Operations Console.
15.1.1.5.1 SERVICE: TELEMETRY #
| Alarm Information | Mitigation Tasks |
|---|---|
|
Name: Process Check
Description: Alarms when the
Likely cause: Process has crashed. |
Review the logs on the alarming host in the following location for the cause: /var/log/ceilometer/ceilometer-agent-notification-json.log Restart the process on the affected node using these steps:
|
|
Name: Process Check
Description: Alarms when the
Likely cause: Process has crashed. |
Review the logs on the alarming host in the following location for the cause: /var/log/ceilometer/ceilometer-polling-json.log Restart the process on the affected node using these steps:
|
15.1.1.5.2 SERVICE: METERING in Telemetry section #
| Alarm Information | Mitigation Tasks |
|---|---|
|
Name: Service Log Directory Size Description: Service log directory consuming more disk than its quota.
Likely cause: This could be due to a
service set to | Find the service that is consuming too much disk space. Look at
the logs. If DEBUG log entries exist, set the logging
level to INFO. If the logs are repeatedly logging an
error message, do what is needed to resolve the error. If old log files
exist, configure log rotate to remove them. You could also choose to
remove old log files by hand after backing them up if needed. |
15.1.1.5.3 SERVICE: KAFKA in Telemetry section #
| Alarm Information | Mitigation Tasks |
|---|---|
|
Name: Kafka Persister Metric Consumer Lag Description: Alarms when the Persister consumer group is not keeping up with the incoming messages on the metric topic. Likely cause: There is a slow down in the system or heavy load. |
Verify that all of the monasca-persister services are up with these steps:
Look for high load in the various systems. This alert can fire for multiple topics or on multiple hosts. Determining which alarms are firing can help diagnose likely causes. For example, if the alarm is alerting all on one machine it could be the machine. If one topic across multiple machines it is likely the consumers of that topic, etc. |
|
Name: Kafka Alarm Transition Consumer Lag Description: Alarms when the specified consumer group is not keeping up with the incoming messages on the alarm state transition topic. Likely cause: There is a slow down in the system or heavy load. |
Check that monasca-thresh and monasca-notification are up. Look for high load in the various systems. This alert can fire for multiple topics or on multiple hosts. Which alarms are firing can help diagnose likely causes. For example:
|
|
Name: Kafka Kronos Consumer Lag Description: Alarms when the Kronos consumer group is not keeping up with the incoming messages on the metric topic. Likely cause: There is a slow down in the system or heavy load. |
Look for high load in the various systems. This alert can fire for multiple topics or on multiple hosts. Which alarms are firing can help diagnose likely causes. For example:
|
|
Name: Process Check Description: Alarms when the specified process is not running: process_name = kafka.Kafka Likely cause: |
Restart the process on the affected node using these steps:
Review the logs in |
15.1.1.5.4 SERVICE: LOGGING in Telemetry section #
| Alarm Information | Mitigation Tasks |
|---|---|
|
Name: Beaver Memory Usage Description: Beaver is using more memory than expected. This may indicate that it cannot forward messages and its queue is filling up. If you continue to see this, see the troubleshooting guide. Likely cause: Overloaded system or services with memory leaks. | Log on to the reporting host to investigate high memory users. |
|
Name: Audit Log Partition Low Watermark
Description: The
var_audit_low_watermark_percent Likely cause: This could be due to a service set to DEBUG instead of INFO level. Another reason could be due to a repeating error message filling up the log files. Finally, it could be due to log rotate not configured properly so old log files are not being deleted properly. | Find the service that is consuming too much disk space. Look at the logs. If DEBUG log entries exist, set the logging level to INFO. If the logs are repeatedly logging an error message, do what is needed to resolve the error. If old log files exist, configure log rotate to remove them. You could also choose to remove old log files by hand after backing them up if needed. |
|
Name: Audit Log Partition High Watermark
Description: The
var_audit_high_watermark_percent Likely cause: This could be due to a service set to DEBUG instead of INFO level. Another reason could be due to a repeating error message filling up the log files. Finally, it could be due to log rotate not configured properly so old log files are not being deleted properly. | Find the service that is consuming too much disk space. Look at the logs. If DEBUG log entries exist, set the logging level to INFO. If the logs are repeatedly logging an error message, do what is needed to resolve the error. If old log files exist, configure log rotate to remove them. You could also choose to remove old log files by hand after backing them up if needed. |
|
Name: Elasticsearch Unassigned Shards Description: component = elasticsearch; Elasticsearch unassigned shards count is greater than 0. Likely cause: Environment could be misconfigured. |
To find the unassigned shards, run the following command on the Cloud Lifecycle Manager
from the
This shows which shards are unassigned, like this: logstash-2015.10.21 4 p UNASSIGNED ... 10.240.75.10 NodeName The last column shows the name that Elasticsearch uses for the node that the unassigned shards are on. To find the actual host name, run:
When you find the host name, take the following steps:
|
|
Name: Elasticsearch Number of Log Entries
Description: Elasticsearch Number of
Log Entries: Likely cause: The number of log entries may get too large. | Older versions of Kibana (version 3 and earlier) may hang if the number of log entries is too large (for example, above 40,000), and the page size would need to be small enough (about 20,000 results), because if it is larger (for example, 200,000), it may hang the browser, but Kibana 4 should not have this issue. |
|
Name: Elasticsearch Field Data Evictions
Description: Elasticsearch Field
Data Evictions count is greater than 0: Likely cause: Field Data Evictions may be found even though it is nowhere near the limit set. |
The
|
|
Name: Service Log Directory Size Description: Service log directory consuming more disk than its quota.
Likely cause: This could be due to a
service set to | Find the service that is consuming too much disk space. Look at
the logs. If DEBUG log entries exist, set the logging
level to INFO. If the logs are repeatedly logging an
error message, do what is needed to resolve the error. If old log files
exist, configure log rotate to remove them. You could also choose to
remove old log files by hand after backing them up if needed. |
|
Name: Process Check
Description: Separate alarms for each
of these logging services, specified by the
Likely cause: Process has crashed. |
On the affected node, attempt to restart the process.
If the If the logstash process has crashed, use: The rest of the processes can be restarted using similar commands, listed here:
|
15.1.1.5.5 SERVICE: MONASCA-TRANSFORM in Telemetry section #
| Alarm Information | Mitigation Tasks |
|---|---|
|
Name: Process Check
Description: Likely cause: Service process has crashed. |
Restart process on affected node. Review logs.
Child process of |
|
Name: Process Check Description: process_name = org.apache.spark.executor.CoarseGrainedExecutorBackend Likely cause: Service process has crashed. |
Restart process on affected node. Review logs.
Child process of |
|
Name: Process Check
Description: Likely cause: Service process has crashed. | Restart the service on affected node. Review logs. |
15.1.1.5.6 SERVICE: MONITORING in Telemetery section #
| Alarm Information | Mitigation Tasks |
|---|---|
|
Name: HTTP Status
Description: Persister Health Check
Likely cause: The process has crashed or a dependency is out. |
If the process has crashed, restart it using the steps below. If a dependent service is down, address that issue. Restart the process on the affected node using these steps:
Review the associated logs. |
|
Name: HTTP Status
Description: API Health Check
Likely cause: The process has crashed or a dependency is out. |
If the process has crashed, restart it using the steps below. If a dependent service is down, address that issue. Restart the process on the affected node using these steps:
Review the associated logs. |
|
Name: Monasca Agent Collection Time
Description: Alarms when the elapsed
time the Likely cause: Heavy load on the box or a stuck agent plug-in. |
Address the load issue on the machine. If needed, restart the agent using the steps below: Restart the agent on the affected node using these steps:
Review the associated logs. |
|
Name: Process Check
Description: Alarms when the specified
process is not running: Likely cause: Process crashed. |
Restart the process on the affected node using these steps:
Review the associated logs. |
|
Name: Process Check Description: Alarms when the specified process is not running: process_name = monasca-notification Likely cause: Process crashed. |
Restart the process on the affected node using these steps:
Review the associated logs. |
|
Name: Process Check
Description: Alarms when the specified
process is not running: Likely cause: Process crashed. |
Restart the agent on the affected node using these steps:
Review the associated logs. |
|
Name: Process Check
Description: Alarms when the specified
process is not running: Likely cause: Process crashed. |
>Restart the process on the affected node using these steps:
Review the associated logs. |
|
Name: Process Check
Description: Alarms when the specified
process is not running: Likely cause: Process crashed. |
Restart the process on the affected node using these steps:
Review the associated logs. |
|
Name: Process Check Description: Alarms when the specified process is not running: process_name = backtype.storm.daemon.nimbus component = apache-storm Likely cause: Process crashed. |
Review the logs in the NoteThe logs containing threshold engine logging are on the 2nd and 3rd controller nodes.
Restart
|
|
Name: Process Check Description: Alarms when the specified process is not running: process_name = backtype.storm.daemon.supervisor component = apache-storm Likely cause: Process crashed. |
Review the logs in the NoteThe logs containing threshold engine logging are on the 2nd and 3rd controller nodes. Restart monasca-thresh with these steps:
|
|
Name: Process Check Description: Alarms when the specified process is not running: process_name = backtype.storm.daemon.worker component = apache-storm Likely cause: Process crashed. |
Review the logs in the NoteThe logs containing threshold engine logging are on the 2nd and 3rd controller nodes.
Restart
|
|
Name: Process Check
Description: Alarms when the specified
process is not running: process_name = monasca-thresh component = apache-storm Likely cause: Process crashed. |
Restart the process on the affected node using these steps:
Review the associated logs. |
|
Name: Service Log Directory Size Description: Service log directory consuming more disk than its quota.
Likely cause: The service log
directory, as indicated by the | Find the service that is consuming too much disk space. Look at
the logs. If DEBUG log entries exist, set the logging
level to INFO. If the logs are repeatedly logging an
error message, do what is needed to resolve the error. If old log files
exist, configure log rotate to remove them. You could also choose to
remove old log files by hand after backing them up if needed. |
15.1.1.6 Console Alarms #
These alarms show under the Console section of the HPE Helion OpenStack Operations Console.
| Alarm Information | Mitigation Tasks |
|---|---|
|
Name: HTTP Status
Description:
Likely cause: The Operations Console is unresponsive |
Review logs in
|
|
Name: Process Check
Description: Alarms when the specified
process is not running:
Likely cause: Process crashed or unresponsive. |
Review logs in
|
15.1.1.7 System Alarms #
These alarms show under the System section and are set up per
hostname and/or mount_point.
15.1.1.7.1 SERVICE: SYSTEM #
| Alarm Information | Mitigation Tasks |
|---|---|
|
Name: CPU Usage Description: Alarms on high CPU usage. Likely cause: Heavy load or runaway processes. | Log onto the reporting host and diagnose the heavy CPU usage. |
|
Name: Elasticsearch Low Watermark
Description:
Likely cause: Running out of disk
space for |
Free up space by removing indices (backing them up first if desired).
Alternatively, adjust For more information about how to back up your centralized logs, see Section 12.2.5, “Configuring Centralized Logging”. |
|
Name: Elasticsearch High Watermark
Description:
Likely cause: Running out of disk
space for |
Verify that disk space was freed up by the curator. If needed, free up additional space by removing indices (backing them up first if desired). Alternatively, adjust curator_low_watermark_percent, curator_high_watermark_percent, and/or elasticsearch_max_total_indices_size_in_bytes if needed. For more information about how to back up your centralized logs, see Section 12.2.5, “Configuring Centralized Logging”. |
|
Name: Log Partition Low Watermark
Description: The
Likely cause: This could be due to a
service set to | Find the service that is consuming too much disk space. Look at
the logs. If DEBUG log entries exist, set the logging
level to INFO. If the logs are repeatedly logging an
error message, do what is needed to resolve the error. If old log files
exist, configure log rotate to remove them. You could also choose to
remove old log files by hand after backing them up if needed. |
|
Name: Log Partition High Watermark
Description: The
Likely cause: This could be due to a
service set to | Find the service that is consuming too much disk space. Look at
the logs. If DEBUG log entries exist, set the logging
level to INFO. If the logs are repeatedly logging an
error message, do what is needed to resolve the error. If old log files
exist, configure log rotate to remove them. You could also choose to
remove old log files by hand after backing them up if needed. |
|
Name: Crash Dump Count
Description: Alarms if it receives any
metrics with
Likely cause: When a crash dump is
generated by kdump, the crash dump file is put into the
|
Analyze the crash dump file(s) located in
Move the file to a new location so that a developer can take a look at
it. Make sure all of the processes are back up after the crash (run the
|
|
Name: Disk Inode Usage
Description: Nearly out of inodes for
a partition, as indicated by the Likely cause: Many files on the disk. | Investigate cleanup of data or migration to other partitions. |
|
Name: Disk Usage
Description: High disk usage, as
indicated by the Likely cause: Large files on the disk. |
Investigate cleanup of data or migration to other partitions. |
|
Name: Host Status
Description: Alerts when a host is
unreachable. Likely cause: Host or network is down. | If a single host, attempt to restart the system. If multiple hosts, investigate network issues. |
|
Name: Memory Usage Description: High memory usage. Likely cause: Overloaded system or services with memory leaks. | Log onto the reporting host to investigate high memory users. |
|
Name: Network Errors Description: Alarms on a high network error rate. Likely cause: Bad network or cabling. | Take this host out of service until the network can be fixed. |
|
Name: NTP Time Sync Description: Alarms when the NTP time offset is high. |
Log in to the reported host and check if the ntp service is running. If it is running, then use these steps:
|
15.1.1.8 Other Services Alarms #
These alarms show under the Other Services section of the HPE Helion OpenStack Operations Console.
15.1.1.8.1 SERVICE: APACHE #
| Alarm Information | Mitigation Tasks |
|---|---|
|
Name: Apache Status Description: Alarms on failure to reach the Apache status endpoint. | |
|
Name: Process Check
Description: Alarms when the specified
process is not running: | If the Apache process goes down, connect to the affected node via
SSH and restart it with this command: sudo systemctl restart
apache2
|
|
Name: Apache Idle Worker Count Description: Alarms when there are no idle workers in the Apache server. |
15.1.1.8.2 SERVICE: BACKUP in Other Services section #
| Alarm Information | Mitigation Tasks |
|---|---|
|
Name: Process Check
Description: Alarms when the specified
process is not running: Likely cause: Process crashed. | Restart the process on the affected node. Review the associated logs. |
|
Name: HTTP Status
Description: Alarms when the specified
HTTP endpoint is down or not reachable:
Likely cause: see
| see Description |
|
Name: Service Log Directory Size Description: Service log directory consuming more disk than its quota.
Likely cause: The service log
directory, as indicated by the | Find the service that is consuming too much disk space. Look at
the logs. If DEBUG log entries exist, set the logging
level to INFO. If the logs are repeatedly logging an
error message, do what is needed to resolve the error. If old log files
exist, configure log rotate to remove them. You could also choose to
remove old log files by hand after backing them up if needed. |
15.1.1.8.3 SERVICE: HAPROXY in Other Services section #
| Alarm Information | Mitigation Tasks |
|---|---|
|
Name: Process Check
Description: Alarms when the specified
process is not running: Likely cause: HA Proxy is not running on this machine. |
Restart the process on the affected node:
Review the associated logs. |
15.1.1.8.4 SERVICE: ARDANA-UX-SERVICES in Other Services section #
| Alarm Information | Mitigation Tasks |
|---|---|
|
Name: HTTP Status Description: Alarms when the specified HTTP endpoint is down or not reachable. |
15.1.1.8.5 SERVICE: KEY-MANAGER in Other Services section #
| Alarm Information | Mitigation Tasks |
|---|---|
|
Name: Process Check
Description: Alarms when the specified
process is not running: process_name = barbican-api Likely cause: Process has crashed. |
Restart the process on the affected node using these steps:
|
|
Name: HTTP Status Description: Alarms when the specified HTTP endpoint is down or not reachable. component = barbican-api api_endpoint = public or internal Likely cause: The endpoint is not responsive, it may be down. |
For the HTTP Status alarms for the public and internal endpoints, restart the process on the affected node using these steps:
Examine the logs in |
|
Name: HTTP Status Description: Alarms when the specified HTTP endpoint is down or not reachable. component = barbican-api monitored_host_type = vip Likely cause: The Barbican API on the admin virtual IP is down. | This alarm is verifying access to the Barbican API via the virtual IP address (HAProxy). If this check is failing but the other two HTTP Status alarms for the key-manager service are not then the issue is likely with HAProxy so you should view the alarms for that service. If the other two HTTP Status alarms are alerting as well then restart Barbican using the steps listed. |
|
Name: Service Log Directory Size Description: Service log directory consuming more disk than its quota.
Likely cause: The service log
directory, as indicated by the | Find the service that is consuming too much disk space. Look at
the logs. If DEBUG log entries exist, set the logging
level to INFO. If the logs are repeatedly logging an
error message, do what is needed to resolve the error. If old log files
exist, configure log rotate to remove them. You could also choose to
remove old log files by hand after backing them up if needed. |
15.1.1.8.6 SERVICE: MYSQL in Other Services section #
| Alarm Information | Mitigation Tasks |
|---|---|
|
Name: MySQL Slow Query Rate Description: Alarms when the slow query rate is high. Likely cause: The system load is too high. | This could be an indication of near capacity limits or an exposed bad query. First, check overall system load and then investigate MySQL details. |
|
Name: Process Check Description: Alarms when the specified process is not running. Likely cause: MySQL crashed. | Restart MySQL on the affected node. |
15.1.1.8.7 SERVICE: OCTAVIA in Other Services section #
| Alarm Information | Mitigation Tasks |
|---|---|
|
Name: Process Check Description: Alarms when the specified process is not running. There are individual alarms for each of these processes:
Likely cause: The process has crashed. |
Restart the process on the affected node using these steps:
|
|
Name: HTTP Status Description: Alarms when the specified HTTP endpoint is down or not reachable.
Likely cause: The |
If the
If it is not the |
|
Name: Service Log Directory Size Description: Service log directory consuming more disk than its quota.
Likely cause: The service log
directory, as indicated by the | Find the service that is consuming too much disk space. Look at
the logs. If DEBUG log entries exist, set the logging
level to INFO. If the logs are repeatedly logging an
error message, do what is needed to resolve the error. If old log files
exist, configure log rotate to remove them. You could also choose to
remove old log files by hand after backing them up if needed. |
15.1.1.8.8 SERVICE: ORCHESTRATION in Other Services section #
| Alarm Information | Mitigation Tasks |
|---|---|
|
Name: Process Check Description: Alarms when the specified process is not running. There are individual alarms for each of these processes:
heat-api process check on each node Likely cause: Process crashed. |
Restart the process with these steps:
Review the relevant log at the following locations on the affected node: /var/log/heat/heat-api.log /var/log/heat/heat-cfn.log /var/log/heat/heat-cloudwatch.log /var/log/heat/heat-engine.log |
|
Name: HTTP Status Description: Alarms when the specified HTTP endpoint is down or not reachable.
|
Restart the Heat service with these steps:
Review the relevant log at the following locations on the affected node: /var/log/heat/heat-api.log /var/log/heat/heat-cfn.log /var/log/heat/heat-cloudwatch.log |
|
Name: Service Log Directory Size Description: Service log directory consuming more disk than its quota.
Likely cause: The service log
directory, as indicated by the | Find the service that is consuming too much disk space. Look at
the logs. If DEBUG log entries exist, set the logging
level to INFO. If the logs are repeatedly logging an
error message, do what is needed to resolve the error. If old log files
exist, configure log rotate to remove them. You could also choose to
remove old log files by hand after backing them up if needed. |
15.1.1.8.9 SERVICE: OVSVAPP-SERVICEVM in Other Services section #
| Alarm Information | Mitigation Tasks |
|---|---|
|
Name: Process Check Description:Alarms when the specified process is not running: process_name = ovs-vswitchd process_name = neutron-ovsvapp-agent process_name = ovsdb-server Likely cause: Process has crashed. | Restart process on affected node. Review logs. |
15.1.1.8.10 SERVICE: RABBITMQ in Other Services section #
| Alarm Information | Mitigation Tasks |
|---|---|
|
Name: Process Check Description: Alarms when the specified process is not running: process_name = rabbitmq process_name = epmd Likely cause: Process has crashed. | Restart process on affected node. Review logs. |
15.1.1.8.11 SERVICE: SPARK in Other Services section #
| Alarm Information | Mitigation Tasks |
|---|---|
|
Name: Process Check Description: Alarms when the specified process is not running process_name = org.apache.spark.deploy.master.Master process_name = org.apache.spark.deploy.worker.Worker Likely cause: Process has crashed. | Restart process on affected node. Review logs. |
15.1.1.8.12 SERVICE: WEB-UI in Other Services section #
| Alarm Information | Mitigation Tasks |
|---|---|
|
Name: HTTP Status Description: Alarms when the specified HTTP endpoint is down or not reachable. Likely cause: Apache is not running or there is a misconfiguration. | Check that Apache is running; investigate Horizon logs. |
|
Name: Service Log Directory Size Description: Service log directory consuming more disk than its quota.
Likely cause: The service log
directory, as indicated by the | Find the service that is consuming too much disk space. Look at
the logs. If DEBUG log entries exist, set the logging
level to INFO. If the logs are repeatedly logging an
error message, do what is needed to resolve the error. If old log files
exist, configure log rotate to remove them. You could also choose to
remove old log files by hand after backing them up if needed. |
15.1.1.8.13 SERVICE: ZOOKEEPER in Other Services section #
| Alarm Information | Mitigation Tasks |
|---|---|
|
Name: Process Check
Description: Alarms when the specified
process is not running: Likely cause: Process crashed. | Restart the process on the affected node. Review the associated logs. |
|
Name: ZooKeeper Latency Description: Alarms when the ZooKeeper latency is high. Likely cause: Heavy system load. | Check the individual system as well as activity across the entire service. |
15.1.1.9 ESX vCenter Plugin Alarms #
These alarms relate to your ESX cluster, if you are utilizing one.
| Alarm Information | Mitigation Tasks |
|---|---|
|
Name: ESX cluster CPU Usage Description: Alarms when average of CPU usage for a particular cluster exceeds 90% continuously for 3 polling cycles. Alarm will have the following dimension: esx_cluster_id=<domain>.<vcenter-id> Likely cause: Virtual machines are consuming more than 90% of allocated vCPUs. |
|
|
Name: ESX cluster Disk Usage Description:
Likely cause:
|
|
|
Name: ESX cluster Memory Usage Description: Alarms when average of RAM memory usage for a particular cluster, exceeds 90% continuously for 3 polling cycles. Alarm will have the following dimension: esx_cluster_id=<domain>.<vcenter-id> Likely cause: Virtual machines are consuming more than 90% of their total allocated memory. |
|
15.1.2 Support Resources #
To solve issues in your cloud, consult the Knowledge Base or contact Professional Services.
15.1.2.1 Using the Knowledge Base #
The public knowledge base for HPE Helion OpenStack 8 can be reached at Hewlett Packard Enterprise Support Center - HPE Helion OpenStack.
You can look through the top issues or search for the specific issue you are
experiencing. Knowledge documents listed with the content type
Knowledge Centered Support are made by HPE TS Support
cloud CoE engineers. If you do not find your issue listed then we suggest
you contact support directly.
15.1.2.2 Contacting the HPE TS Support Cloud CoE #
Call the HPE Support Number
Once you have registered for HPE TS Support you will be mailed a Service Agreement ID (SAID) and a phone number to call (www.hpe.com/contact). HPE customers with a Datacenter Care for Cloud contract will have to use their designated contact number. You can use that phone number to log support requests. Please have your SAID number available when calling. The support agent will log a case with the information you provide and the case will be sent to the HPE TS Support Cloud CoE Team. The response time will depend on the service level agreement (SLA) in place.
Electronic Case Logging
There is the option of visiting the HPE Support Center to log a support case via the website. You will be asked to setup and provide a PIN code for correct routing of your support case to the HPE TS Support Cloud CoE team. Use your HPE Passport and your Service Agreement ID (SAID) to electronically log your support case.
15.2 Control Plane Troubleshooting #
Troubleshooting procedures for control plane services.
15.2.1 Understanding and Recovering RabbitMQ after Failure #
RabbitMQ is the message queue service that runs on each of your controller nodes and brokers communication between multiple services in your HPE Helion OpenStack cloud environment. It is important for cloud operators to understand how different troubleshooting scenarios affect RabbitMQ so they can minimize downtime in their environments. We are going to discuss multiple scenarios and how it affects RabbitMQ. We will also explain how you can recover from them if there are issues.
15.2.1.1 How upgrades affect RabbitMQ #
There are two types of upgrades within HPE Helion OpenStack -- major and minor. The effect that the upgrade process has on RabbitMQ depends on these types.
A major upgrade is defined by an erlang change or major version upgrade of RabbitMQ. A minor upgrade would be an upgrade where RabbitMQ stays within the same version, such as v3.4.3 to v.3.4.6.
During both types of upgrades there may be minor blips in the authentication process of client services as the accounts are recreated.
RabbitMQ during a major upgrade
There will be a RabbitMQ service outage while the upgrade is performed.
During the upgrade, high availability consistency is compromised -- all but the primary node will go down and will be reset, meaning their database copies are deleted. The primary node is not taken down until the last step and then it is upgrade. The database of users and permissions is maintained during this process. Then the other nodes are brought back into the cluster and resynchronized.
RabbitMQ during a minor upgrade
Minor upgrades are performed node by node. This "rolling" process means there should be no overall service outage because each node is taken out of its cluster in turn, its database is reset, and then it is added back to the cluster and resynchronized.
15.2.1.2 How RabbitMQ is affected by other operational processes #
There are operational tasks, such as Section 13.1.1.1, “Bringing Down Your Cloud: Services Down Method”, where
you use the ardana-stop.yml and
ardana-start.yml playbooks to gracefully restart your cloud.
If you use these playbooks, and there are no errors associated with them
forcing you to troubleshoot further, then RabbitMQ is brought down
gracefully and brought back up. There is nothing special to note regarding
RabbitMQ in these normal operational processes.
However, there are other scenarios where an understanding of RabbitMQ is important when a graceful shutdown did not occur.
These examples that follow assume you are using one of the entry-scale
models where RabbitMQ is hosted on your controller node cluster. If you are
using a mid-scale model or have a dedicated cluster that RabbitMQ lives on
you may need to alter the steps accordingly. To determine which nodes
RabbitMQ is on you can use the rabbit-status.yml playbook
from your Cloud Lifecycle Manager.
ardana >cd ~/scratch/ansible/next/ardana/ansibleardana >ansible-playbook -i hosts/verb_hosts rabbitmq-status.yml
Your entire control plane cluster goes down
If you have a scenario where all of your controller nodes went down, either manually or via another process such as a power outage, then an understanding of how RabbitMQ should be brought back up is important. Follow these steps to recover RabbitMQ on your controller node cluster in these cases:
The order in which the nodes went down is key here. Locate the last node to go down as this will be used as the primary node when bringing the RabbitMQ cluster back up. You can review the timestamps in the
/var/log/rabbitmqlog file to determine what the last node was.
Note
The
primarystatus of a node is transient, it only applies for the duration that this process is running. There is no long-term distinction between any of the nodes in your cluster. The primary node is simply the one that owns the RabbitMQ configuration database that will be synchronized across the cluster.Run the
ardana-start.ymlplaybook specifying the primary node (aka the last node down determined in the first step):ardana >cd ~/scratch/ansible/next/ardana/ansibleardana >ansible-playbook -i hosts/verb_hosts ardana-start.yml -e rabbit_primary_hostname=<hostname>Note
The
<hostname>value will be the "shortname" for your node, as found in the/etc/hostsfile.
If one of your controller nodes goes down
First step here is to determine whether the controller that went down is the
primary RabbitMQ host or not. The primary host is going to be the first host
member in the FND-RMQ group in the file below on your
Cloud Lifecycle Manager:
ardana > ~/scratch/ansible/next/ardana/ansible/hosts/verb_hosts
In this example below, ardana-cp1-c1-m1-mgmt would be the
primary:
[FND-RMQ-ccp-cluster1:children]
ardana-cp1-c1-m1-mgmt
ardana-cp1-c1-m2-mgmt
ardana-cp1-c1-m3-mgmt
If your primary RabbitMQ controller node has gone down and you need to bring
it back up, you can follow these steps. In this playbook you are using the
rabbit_primary_hostname parameter to specify the hostname
for one of the other controller nodes in your environment hosting RabbitMQ,
which will service as the primary node in the recovery. You will also use
the --limit parameter to specify the controller node you
are attempting to bring back up.
ardana >cd ~/scratch/ansible/next/ardana/ansibleardana >ansible-playbook -i hosts/verb_hosts ardana-start.yml -e rabbit_primary_hostname=<new_primary_hostname> --limit <hostname_of_node_you_are_bringing_up>
If the node you need to bring back is not
the primary RabbitMQ node then you can just run the
ardana-start.yml playbook with the
--limit parameter and your node should recover:
ardana >cd ~/scratch/ansible/next/ardana/ansibleardana >ansible-playbook -i hosts/verb_hosts ardana-start.yml --limit <hostname_of_node_you_are_bringing_up>
If you are replacing one or more of your controller nodes
The same general process noted above is used if you are removing or replacing one or more of your controller nodes.
If your node needs minor hardware repairs, but does not need to be replaced
with a new node, you should use the ardana-stop.yml playbook
with the --limit parameter to stop services on that node
prior to removing it from the cluster.
Log into the Cloud Lifecycle Manager.
Run the
rabbitmq-stop.ymlplaybook, specifying the hostname of the node you are removing, which will remove the node from the RabbitMQ cluster:ardana >cd ~/scratch/ansible/next/ardana/ansibleardana >ansible-playbook -i hosts/verb_hosts rabbitmq-stop.yml --limit <hostname_of_node_you_are_removing>Run the
ardana-stop.ymlplaybook, again specifying the hostname of the node you are removing, which will stop the rest of the services and prepare it to be removed.ardana >cd ~/scratch/ansible/next/ardana/ansibleardana >ansible-playbook -i hosts/verb_hosts ardana-stop.yml --limit <hostname_of_node_you_are_removing>
If your node cannot be repaired and needs to be replaced with another baremetal node, any references to the replaced node must be removed from the RabbitMQ cluster. This is because RabbitMQ associates a cookie with each node in the cluster which is derived, in part, by the specific hardware. So it is possible to replace a hard drive in a node. However changing a motherboard or replacing the node with another node entirely may cause RabbitMQ to stop working. When this happens, the running RabbitMQ cluster must be edited from a running RabbitMQ node. The following steps show how to do this.
In this example, controller 3 is the node being replaced with the following steps:
ardana >cd ~/scratch/ansible/next/ardana/ansibleSSH to a running RabbitMQ cluster node.
ardana >ssh cloud-cp1-rmq-mysql-m1-mgmtForce the cluster to forget the node you are removing (in this example, the controller 3 node).
ardana >sudo rabbitmqctl forget_cluster_node \ rabbit@cloud-cp1-rmq-mysql-m3-mgmtConfirm that the node has been removed:
ardana >sudo rabbitmqctl cluster_statusOn the replacement node, information and services related to RabbitMQ must be removed.
ardana >sudo systemctl stop rabbitmq-serverardana >sudo systemctl stop epmd.socket>Verify that the epmd service has stopped (kill it if it is still running).
ardana >ps -eaf | grep epmd.Remove the Mnesia database directory.
ardana >sudo rm -rf /var/lib/rabbitmq/mnesiaRestart the RabbitMQ server.
ardana >sudo systemctl start rabbitmq-serverOn the Cloud Lifecycle Manager, run the
ardana-start.ymlplaybook.
If the node you are removing/replacing is your primary host then when you are adding it to your cluster then you will want to ensure that you specify a new primary host when doing so, as follows:
ardana >cd ~/scratch/ansible/next/ardana/ansibleardana >ansible-playbook -i hosts/verb_hosts ardana-start.yml -e rabbit_primary_hostname=<new_primary_hostname> --limit <hostname_of_node_you_are_adding>
If the node you are removing/replacing is not your primary host then you can add it as follows:
ardana >cd ~/scratch/ansible/next/ardana/ansibleardana >ansible-playbook -i hosts/verb_hosts ardana-start.yml --limit <hostname_of_node_you_are_adding>
If one of your controller nodes has rebooted or temporarily lost power
After a single reboot, RabbitMQ will not automatically restart. This is by design to protect your RabbitMQ cluster. To restart RabbitMQ, you should follow the process below.
If the rebooted node was your primary RabbitMQ host, you will specify a different primary hostname using one of the other nodes in your cluster:
ardana >cd ~/scratch/ansible/next/ardana/ansibleardana >ansible-playbook -i hosts/verb_hosts ardana-start.yml -e rabbit_primary_hostname=<new_primary_hostname> --limit <hostname_of_node_that_rebooted>
If the rebooted node was not the primary RabbitMQ host then you can just start it back up with this playbook:
ardana >cd ~/scratch/ansible/next/ardana/ansibleardana >ansible-playbook -i hosts/verb_hosts ardana-start.yml --limit <hostname_of_node_that_rebooted>
15.2.1.3 Recovering RabbitMQ #
In this section we will show you how to check the status of RabbitMQ and how to do a variety of disaster recovery procedures.
Verifying the status of RabbitMQ
You can verify the status of RabbitMQ on each of your controller nodes by using the following steps:
Log in to the Cloud Lifecycle Manager.
Run the
rabbitmq-status.ymlplaybook:ardana >cd ~/scratch/ansible/next/ardana/ansibleardana >ansible-playbook -i hosts/verb_hosts rabbitmq-status.ymlIf all is well, you should see an output similar to the following:
PLAY RECAP ********************************************************************
rabbitmq | status | Check RabbitMQ running hosts in cluster ------------- 2.12s
rabbitmq | status | Check RabbitMQ service running ---------------------- 1.69s
rabbitmq | status | Report status of RabbitMQ --------------------------- 0.32s
-------------------------------------------------------------------------------
Total: ------------------------------------------------------------------ 4.36s
ardana-cp1-c1-m1-mgmt  : ok=2    changed=0    unreachable=0    failed=0
ardana-cp1-c1-m2-mgmt  : ok=2    changed=0    unreachable=0    failed=0
ardana-cp1-c1-m3-mgmt  : ok=2    changed=0    unreachable=0    failed=0
If one or more of your controller nodes are having RabbitMQ issues then continue reading, looking for the scenario that best matches yours.
RabbitMQ recovery after a small network outage
In the case of a transient network outage, the version of RabbitMQ included
with HPE Helion OpenStack is likely to recover automatically without any further
action needed. However, if yours does not and the
rabbitmq-status.yml playbook is reporting an issue then
use the scenarios below to resolve your issues.
All of your controller nodes have gone down and using other methods have not brought RabbitMQ back up
If your RabbitMQ cluster is irrecoverable and you need rapid service recovery because other methods either cannot resolve the issue or you do not have time to investigate more nuanced approaches then we provide a disaster recovery playbook for you to use. This playbook will tear down and reset any RabbitMQ services. This does have an extreme effect on your services. The process will ensure that the RabbitMQ cluster is recreated.
Log in to your Cloud Lifecycle Manager.
Run the RabbitMQ disaster recovery playbook. This generally takes around two minutes.
ardana >cd ~/scratch/ansible/next/ardana/ansibleardana >ansible-playbook -i hosts/verb_hosts rabbitmq-disaster-recovery.ymlRun the reconfigure playbooks for both Cinder (Block Storage) and Heat (Orchestration), if those services are present in your cloud. These services are affected when the fan-out queues are not recovered correctly. The reconfigure generally takes around five minutes.
ardana >cd ~/scratch/ansible/next/ardana/ansibleardana >ansible-playbook -i hosts/verb_hosts cinder-reconfigure.ymlardana >ansible-playbook -i hosts/verb_hosts heat-reconfigure.ymlardana >ansible-playbook -i hosts/verb_hosts kronos-server-configure.ymlIf you need to do a safe recovery of all the services in your environment then you can use this playbook. This is a more lengthy process as all services are inspected.
ardana >cd ~/scratch/ansible/next/ardana/ansibleardana >ansible-playbook -i hosts/verb_hosts ardana-reconfigure.yml
One of your controller nodes has gone down and using other methods have not brought RabbitMQ back up
This disaster recovery procedure has the same caveats as the preceding one, but the steps differ.
If your primary RabbitMQ controller node has gone down and you need to perform a disaster recovery, use this playbook from your Cloud Lifecycle Manager:
ardana >cd ~/scratch/ansible/next/ardana/ansibleardana >ansible-playbook -i hosts/verb_hosts rabbitmq-disaster-recovery.yml -e rabbit_primary_hostname=<new_primary_hostname> --limit <hostname_of_node_that_needs_recovered>
If the controller node is not your primary, you can use this playbook:
ardana >cd ~/scratch/ansible/next/ardana/ansibleardana >ansible-playbook -i hosts/verb_hosts rabbitmq-disaster-recovery.yml --limit <hostname_of_node_that_needs_recovered>
No reconfigure playbooks are needed because all of the fan-out exchanges are maintained by the running members of your RabbitMQ cluster.
15.3 Troubleshooting Compute Service #
Troubleshooting scenarios with resolutions for the Nova service.
Nova offers scalable, on-demand, self-service access to compute resources. You can use this guide to help with known issues and troubleshooting of Nova services.
15.3.1 How can I reset the state of a compute instance? #
If you have an instance that is stuck in a non-Active state, such as
Deleting or Rebooting and you want to
reset the state so you can interact with the instance again, there is a way
to do this.
The Nova command-line tool (also known as the Nova CLI or python-novaclient)
has a command, nova reset-state, that allows you to reset
the state of a server.
Here is the content of the help information about the command which shows the syntax:
$ nova help reset-state
        usage: nova reset-state [--active] <server> [<server> ...]

        Reset the state of a server.

        Positional arguments:
        <server>  Name or ID of server(s).

        Optional arguments:
        --active  Request the server be reset to "active" state instead of "error"
        state (the default).
If you had an instance that was stuck in a Rebooting
state you would use this command to reset it back to
Active:
nova reset-state --active <instance_id>
15.3.2 Troubleshooting nova-consoleauth #
The nova-consoleauth service runs by default on the first controller node,
that is, the host with consoleauth_host_index=0. If
nova-consoleauth fails on the first controller node, you can switch it to
another controller node by running the ansible playbook nova-start.yml and
passing it the index of the next controller node.
The command to switch nova-consoleauth to another controller node (controller 2 for instance) is:
ansible-playbook -i hosts/verb_hosts nova-start.yml --extra-vars "consoleauth_host_index=1"
After you run this command you may now see two instances of the
nova-consoleauth service, which will show as being in
disabled state, when you run the nova
service-list command. You can then delete the service using these
steps.
Obtain the service ID for the duplicated nova-consoleauth service:
nova
   service-list
Example:
$ nova service-list
+----+------------------+---------------------------+----------+----------+-------+----------------------------+-----------------+
| Id | Binary           | Host                      | Zone     | Status   | State | Updated_at                 | Disabled Reason |
+----+------------------+---------------------------+----------+----------+-------+----------------------------+-----------------+
| 1  | nova-conductor   | ...a-cp1-c1-m1-mgmt    | internal | enabled  | up    | 2016-08-25T12:11:48.000000 | -               |
| 10 | nova-conductor   | ...a-cp1-c1-m3-mgmt    | internal | enabled  | up    | 2016-08-25T12:11:47.000000 | -               |
| 13 | nova-conductor   | ...a-cp1-c1-m2-mgmt    | internal | enabled  | up    | 2016-08-25T12:11:48.000000 | -               |
| 16 | nova-scheduler   | ...a-cp1-c1-m1-mgmt    | internal | enabled  | up    | 2016-08-25T12:11:39.000000 | -               |
| 19 | nova-scheduler   | ...a-cp1-c1-m2-mgmt    | internal | enabled  | up    | 2016-08-25T12:11:41.000000 | -               |
| 22 | nova-scheduler   | ...a-cp1-c1-m3-mgmt    | internal | enabled  | up    | 2016-08-25T12:11:44.000000 | -               |
| 25 | nova-consoleauth | ...a-cp1-c1-m1-mgmt    | internal | enabled  | up    | 2016-08-25T12:11:45.000000 | -               |
| 49 | nova-compute     | ...a-cp1-comp0001-mgmt | nova     | enabled  | up    | 2016-08-25T12:11:48.000000 | -               |
| 52 | nova-compute     | ...a-cp1-comp0002-mgmt | nova     | enabled  | up    | 2016-08-25T12:11:41.000000 | -               |
| 55 | nova-compute     | ...a-cp1-comp0003-mgmt | nova     | enabled  | up    | 2016-08-25T12:11:43.000000 | -               |
| 70 | nova-consoleauth | ...a-cp1-c1-m3-mgmt    | internal | disabled | down  | 2016-08-25T12:10:40.000000 | -               |
+----+------------------+---------------------------+----------+----------+-------+----------------------------+-----------------+
Delete the disabled duplicate service with this command:
nova service-delete <service_ID>
Given the example in the previous step, the command could be:
nova service-delete 70
15.3.3 Enabling the migrate or resize functions in Nova post-installation when using encryption #
If you have used encryption for your data when running the configuration processor during your cloud deployment and are enabling the Nova resize and migrate functionality after the initial installation, there is an issue that arises if you have made additional configuration changes that required you to run the configuration processor before enabling these features.
You will only experience an issue if you have enabled encryption. If you
haven't enabled encryption, then there is no need to follow the procedure
below. If you are using encryption and you have made a configuration change
and run the configuration processor after your initial install or upgrade,
and you have run the ready-deployment.yml playbook, and
you want to enable migrate or resize in Nova, then the following steps will
allow you to proceed. Note that the ansible vault key referred to below is
the encryption key that you have provided to the configuration processor.
Log in to the Cloud Lifecycle Manager.
Checkout the ansible branch of your local git:
cd ~/openstack
git checkout ansible
Do a git log, and pick the previous commit:
git log
In this example below, the commit is
ac54d619b4fd84b497c7797ec61d989b64b9edb3:$ git log commit 69f95002f9bad0b17f48687e4d97b2a791476c6a Merge: 439a85e ac54d61 Author: git user <user@company.com> Date: Fri May 6 09:08:55 2016 +0000 Merging promotion of saved output commit 439a85e209aeeca3ab54d1a9184efb01604dbbbb Author: git user <user@company.com> Date: Fri May 6 09:08:24 2016 +0000 Saved output from CP run on 1d3976dac4fd7e2e78afad8d23f7b64f9d138778 commit ac54d619b4fd84b497c7797ec61d989b64b9edb3 Merge: a794083 66ffe07 Author: git user <user@company.com> Date: Fri May 6 08:32:04 2016 +0000 Merging promotion of saved outputCheckout the commit:
git checkout <commit_ID>
Using the same example above, here is the command:
$ git checkout ac54d619b4fd84b497c7797ec61d989b64b9edb3
              Note: checking out 'ac54d619b4fd84b497c7797ec61d989b64b9edb3'.

              You are in 'detached HEAD' state. You can look around, make experimental
              changes and commit them, and you can discard any commits you make in this
              state without impacting any branches by performing another checkout.

              If you want to create a new branch to retain commits you create, you may
              do so (now or later) by using -b with the checkout command again. Example:

              git checkout -b new_branch_name

              HEAD is now at ac54d61... Merging promotion of saved output
Change to the ansible output directory:
cd ~/openstack/my_cloud/stage/ansible/group_vars/
View the
group_varsfile from the ansible vault - it will be of the form below, with your compute cluster name being the indicator:<cloud name>-<control plane name>-<compute cluster name>
View this group_vars file from the ansible vault with this command which will prompt you for your vault password:
ansible-vault view <group_vars_file>
Search the contents of this file for the
nova_ssh_keysection which will contain both the private and public SSH keys which you should then save into a temporary file so you can use it in a later step.Here is an example snippet, with the bold part being what you need to save:
NOV_KVM:
                vars:
                              nova_ssh_key:
                  private: '-----BEGIN RSA PRIVATE KEY-----
                  MIIEpAIBAAKCAQEAv/hhekzykD2K8HnVNBKZcJWYrVlUyb6gR8cvE6hbh2ISzooA
                  jQc3xgglIwpt5TuwpTY3LL0C4PEHObxy9WwqXTHBZp8jg/02RzD02bEcZ1WT49x7
                  Rj8f5+S1zutHlDv7PwEIMZPAHA8lihfGFG5o+QHUmsUHgjShkWPdHXw1+6mCO9V/
                  eJVZb3nDbiunMOBvyyk364w+fSzes4UDkmCq8joDa5KkpTgQK6xfw5auEosyrh8D
                  zocN/JSdr6xStlT6yY8naWziXr7p/QhG44RPD9SSD7dhkyJh+bdCfoFVGdjmF8yA
                  h5DlcLu9QhbJ/scb7yMP84W4L5GwvuWCCFJTHQIDAQABAoIBAQCCH5O7ecMFoKG4
                  JW0uMdlOJijqf93oLk2oucwgUANSvlivJX4AGj9k/YpmuSAKvS4cnqZBrhDwdpCG
                  Q0XNM7d3mk1VCVPimNWc5gNiOBpftPNdBcuNryYqYq4WBwdq5EmGyGVMbbFPk7jH
                  ZRwAJ2MCPoplKl7PlGtcCMwNu29AGNaxCQEZFmztXcEFdMrfpTh3kuBI536pBlEi
                  Srh23mRILn0nvLXMAHwo94S6bI3JOQSK1DBCwtA52r5YgX0nkZbi2MvHISY1TXBw
                  SiWgzqW8dakzVu9UNif9nTDyaJDpU0kr0/LWtBQNdcpXnDSkHGjjnIm2pJVBC+QJ
                  SM9o8h1lAoGBANjGHtG762+dNPEUUkSNWVwd7tvzW9CZY35iMR0Rlux4PO+OXwNq
                  agldHeUpgG1MPl1ya+rkf0GD62Uf4LHTDgaEkUfiXkYtcJwHbjOnj3EjZLXaYMX2
                  LYBE0bMKUkQCBdYtCvZmo6+dfC2DBEWPEhvWi7zf7o0CJ9260aS4UHJzAoGBAOK1
                  P//K7HBWXvKpY1yV2KSCEBEoiM9NA9+RYcLkNtIy/4rIk9ShLdCJQVWWgDfDTfso
                  sJKc5S0OtOsRcomvv3OIQD1PvZVfZJLKpgKkt20/w7RwfJkYC/jSjQpzgDpZdKRU
                  vRY8P5iryptleyImeqV+Vhf+1kcH8t5VQMUU2XAvAoGATpfeOqqIXMpBlJqKjUI2
                  QNi1bleYVVQXp43QQrrK3mdlqHEU77cYRNbW7OwUHQyEm/rNN7eqj8VVhi99lttv
                  fVt5FPf0uDrnVhq3kNDSh/GOJQTNC1kK/DN3WBOI6hFVrmZcUCO8ewJ9MD8NQG7z
                  4NXzigIiiktayuBd+/u7ZxMCgYEAm6X7KaBlkn8KMypuyIsssU2GwHEG9OSYay9C
                  Ym8S4GAZKGyrakm6zbjefWeV4jMZ3/1AtXg4tCWrutRAwh1CoYyDJlUQAXT79Phi
                  39+8+6nSsJimQunKlmvgX7OK7wSp24U+SPzWYPhZYzVaQ8kNXYAOlezlquDfMxxv
                  GqBE5QsCgYA8K2p/z2kGXCNjdMrEM02reeE2J1Ft8DS/iiXjg35PX7WVIZ31KCBk
                  wgYTWq0Fwo2W/EoJVl2o74qQTHK0Bs+FTnR2nkVF3htEOAW2YXQTTN2rEsHmlQqE
                  A9iGTNwm9hvzbvrWeXtx8Zk/6aYfsXCoxq193KglS40shOCaXzWX0w==
                  -----END RSA PRIVATE KEY-----'
                  public: ssh-rsa AAAAB3NzaC1yc2EAAAADAQABAAABAQC/+GF6TPKQPYrwedU0Epl
                  wlZitWVTJvqBHxy8TqFuHYhLOigCNBzfGCCUjCm3lO7ClNjcsvQLg8Qc5vHL1bCpdMc
                  FmnyOD/TZHMPTZsRxnVZPj3HtGPx/n5LXO60eUO/s/AQgxk8AcDyWKF8YUbmj5Ad
                  SaxQeCNKGRY90dfDX7qYI71X94lVlvecNuK6cw4G/LKTfrjD59LN6zhQOSYKryOgNrkq
                  SlOBArrF/Dlq4SizKuHwPOhw38lJ2vrFK2VPrJjydpbOJevun9CEbjhE8P1JIPt2GTImH5t0
                  J+gVUZ2OYXzICHkOVwu71CFsn+xxvvIw/zhbgvkbC+5YIIUlMd
                  Generated Key for Nova User
                NTP_CLI:
Switch back to the
sitebranch by checking it out:cd ~/openstack git checkout site
Navigate to your group_vars directory in this branch:
cd ~/scratch/ansible/next/ardana/ansible/group_vars
Edit your compute group_vars file, which will prompt you for your vault password:
ansible-vault edit <group_vars_file>
              Vault password:
              Decryption successful
Search the contents of this file for the
nova_ssh_keysection and replace the private and public keys with the contents that you had saved in a temporary file in step #7 earlier.Remove the temporary file that you created earlier. You are now ready to run the deployment. For information about enabling Nova resizing and migration, see Section 5.4, “Enabling the Nova Resize and Migrate Features”.
15.3.4 Compute (ESX) #
Unable to Create Instance Snapshot when Instance is Active
There is a known issue with VMWare vCenter where if you have a compute
instance in Active state you will receive the error below
when attempting to take a snapshot of it:
An error occurred while saving the snapshot: Failed to quiesce the virtual machine
The workaround for this issue is to stop the instance. Here are steps to achieve this using the command line tool:
Stop the instance using the NovaClient:
nova stop <instance UUID>
Take the snapshot of the instance.
Start the instance back up:
nova start <instance UUID>
15.4 Network Service Troubleshooting #
Troubleshooting scenarios with resolutions for the Networking service.
15.4.1 Troubleshooting Network failures #
CVR HA - Split-brain result of failover of L3 agent when master comes back up This situation is specific to when L3 HA is configured and a network failure occurs to the node hosting the currently active l3 agent. L3 HA is intended to provide HA in situations where the l3-agent crashes or the node hosting an l3-agent crashes/restarts. In the case of a physical networking issue which isolates the active l3 agent, the stand-by l3-agent takes over but when the physical networking issue is resolved, traffic to the VMs is disrupted due to a "split-brain" situation in which traffic is split over the two L3 agents. The solution is to restart the L3-agent that was originally the master.
OVSvApp loses connectivity with vCenter If the OVSvApp loses connectivity with the vCenter cluster, you will receive the following errors:
The OVSvApp VM will go into ERROR state
The OVSvApp VM will not get IP address
When you see these symptoms:
Restart the OVSvApp agent on the OVSvApp VM.
Execute the following command to restart the Network (Neutron) service:
sudo service neutron-ovsvapp-agent restart
Fail over a plain CVR router because the node became unavailable:
Get a list of l3 agent UUIDs which can be used in the commands that follow
neutron agent-list | grep l3
Determine the current host
neutron l3-agent-list-hosting-router <router uuid>
Remove the router from the current host
neutron l3-agent-router-remove <current l3 agent uuid> <router uuid>
Add the router to a new host
neutron l3-agent-router-add <new l3 agent uuid> <router uuid>
Trouble setting maximum transmission units (MTU) Section 9.3.11, “Configuring Maximum Transmission Units in Neutron”
Floating IP on allowed_address_pair port with
DVR-routed networks allowed_address_pair
You may notice this issue: If you have an
allowed_address_pair associated with multiple virtual
machine (VM) ports, and if all the VM ports are ACTIVE, then the
allowed_address_pair port binding will have the last
ACTIVE VM's binding host as its bound host.
In addition, you may notice that if the
floating IP is assigned to the allowed_address_pair that
is bound to multiple VMs that are ACTIVE, then the floating IP will not work
with DVR routers. This is different from the centralized router behavior
where it can handle unbound allowed_address_pair ports
that are associated with floating IPs.
Currently we support allowed_address_pair ports with DVR
only if they have floating IPs enabled, and have just one ACTIVE port.
Using the CLI, you can follow these steps:
Create a network to add the host to:
$ neutron net-create vrrp-net
Attach a subnet to that network with a specified allocation-pool range:
$ neutron subnet-create --name vrrp-subnet --allocation-pool start=10.0.0.2,end=10.0.0.200 vrrp-net 10.0.0.0/24
Create a router, uplink the vrrp-subnet to it, and attach the router to an upstream network called public:
$ neutron router-create router1
$ neutron router-interface-add router1 vrrp-subnet
$ neutron router-gateway-set router1 public
Create a security group called vrrp-sec-group and add ingress rules to allow ICMP and TCP port 80 and 22:
$ neutron security-group-create vrrp-sec-group
$ neutron security-group-rule-create  --protocol icmp vrrp-sec-group
$ neutron security-group-rule-create  --protocol tcp  --port-range-min80 --port-range-max80 vrrp-sec-group
$ neutron security-group-rule-create  --protocol tcp  --port-range-min22 --port-range-max22 vrrp-sec-group
Next, boot two instances:
$ nova boot --num-instances 2 --image ubuntu-12.04 --flavor 1 --nic net-id=24e92ee1-8ae4-4c23-90af-accb3919f4d1 vrrp-node --security_groups vrrp-sec-group
When you create two instances, make sure that both the instances are not in ACTIVE state before you associate the
allowed_address_pair. The instances:$ nova list +--------------------------------------+-------------------------------------------------+--------+------------+-------------+--------------------------------------------------------+ | ID | Name | Status | Task State | Power State | Networks | +--------------------------------------+-------------------------------------------------+--------+------------+-------------+--------------------------------------------------------+ | 15b70af7-2628-4906-a877-39753082f84f | vrrp-node-15b70af7-2628-4906-a877-39753082f84f | ACTIVE | - | Running | vrrp-net=10.0.0.3 | | e683e9d1-7eea-48dd-9d3a-a54cf9d9b7d6 | vrrp-node-e683e9d1-7eea-48dd-9d3a-a54cf9d9b7d6 | DOWN | - | Running | vrrp-net=10.0.0.4 | +--------------------------------------+-------------------------------------------------+--------+------------+-------------+--------------------------------------------------------+
Create a port in the VRRP IP range that was left out of the ip-allocation range:
$ neutron port-create --fixed-ip ip_address=10.0.0.201 --security-group vrrp-sec-group vrrp-net
Created a new port:
+-----------------------+-----------------------------------------------------------------------------------+
| Field                 | Value                                                                             |
+-----------------------+-----------------------------------------------------------------------------------+
| admin_state_up        | True                                                                              |
| allowed_address_pairs |                                                                                   |
| device_id             |                                                                                   |
| device_owner          |                                                                                   |
| fixed_ips             | {"subnet_id": "94a0c371-d37c-4796-821e-57c2a8ec65ae", "ip_address": "10.0.0.201"} |
| id                    | 6239f501-e902-4b02-8d5c-69062896a2dd                                              |
| mac_address           | fa:16:3e:20:67:9f                                                                 |
| name                  |                                                                                   |
| network_id            | 24e92ee1-8ae4-4c23-90af-accb3919f4d1                                              |
| port_security_enabled | True                                                                              |
| security_groups       | 36c8131f-d504-4bcc-b708-f330c9f6b67a                                              |
| status                | DOWN                                                                              |
| tenant_id             | d4e4332d5f8c4a8eab9fcb1345406cb0                                                  |
+-----------------------+-----------------------------------------------------------------------------------+
Another thing to cross check after you associate the allowed_address_pair port to the VM port, is whether the
allowed_address_pairport has inherited the VM's host binding:$ neutron --os-username admin --os-password ZIy9xitH55 --os-tenant-name admin port-show f5a252b2-701f-40e9-a314-59ef9b5ed7de +-----------------------+--------------------------------------------------------------------------------------------------------+ | Field | Value | +-----------------------+--------------------------------------------------------------------------------------------------------+ | admin_state_up | True | | allowed_address_pairs | | | {color:red}binding:host_id{color} | ...-cp1-comp0001-mgmt | | binding:profile | {} | | binding:vif_details | {"port_filter": true, "ovs_hybrid_plug": true} | | binding:vif_type | ovs | | binding:vnic_type | normal | | device_id | | | device_owner | compute:None | | dns_assignment | {"hostname": "host-10-0-0-201", "ip_address": "10.0.0.201", "fqdn": "host-10-0-0-201.openstacklocal."} | | dns_name | | | extra_dhcp_opts | | | fixed_ips | {"subnet_id": "94a0c371-d37c-4796-821e-57c2a8ec65ae", "ip_address": "10.0.0.201"} | | id | 6239f501-e902-4b02-8d5c-69062896a2dd | | mac_address | fa:16:3e:20:67:9f | | name | | | network_id | 24e92ee1-8ae4-4c23-90af-accb3919f4d1 | | port_security_enabled | True | | security_groups | 36c8131f-d504-4bcc-b708-f330c9f6b67a | | status | DOWN | | tenant_id | d4e4332d5f8c4a8eab9fcb1345406cb0 | +-----------------------+--------------------------------------------------------------------------------------------------------+Note that you were allocated a port with the IP address 10.0.0.201 as requested. Next, associate a floating IP to this port to be able to access it publicly:
$ neutron floatingip-create --port-id=6239f501-e902-4b02-8d5c-69062896a2dd public
Created a new floatingip:
+---------------------+--------------------------------------+
| Field               | Value                                |
+---------------------+--------------------------------------+
| fixed_ip_address    | 10.0.0.201                           |
| floating_ip_address | 10.36.12.139                         |
| floating_network_id | 3696c581-9474-4c57-aaa0-b6c70f2529b0 |
| id                  | a26931de-bc94-4fd8-a8b9-c5d4031667e9 |
| port_id             | 6239f501-e902-4b02-8d5c-69062896a2dd |
| router_id           | 178fde65-e9e7-4d84-a218-b1cc7c7b09c7 |
| tenant_id           | d4e4332d5f8c4a8eab9fcb1345406cb0     |
+---------------------+--------------------------------------+
Now update the ports attached to your VRRP instances to include this IP address as an allowed-address-pair so they will be able to send traffic out using this address. First find the ports attached to these instances:
$ neutron port-list -- --network_id=24e92ee1-8ae4-4c23-90af-accb3919f4d1
+--------------------------------------+------+-------------------+-----------------------------------------------------------------------------------+
| id                                   | name | mac_address       | fixed_ips                                                                         |
+--------------------------------------+------+-------------------+-----------------------------------------------------------------------------------+
| 12bf9ea4-4845-4e2c-b511-3b8b1ad7291d |      | fa:16:3e:7a:7b:18 | {"subnet_id": "94a0c371-d37c-4796-821e-57c2a8ec65ae", "ip_address": "10.0.0.4"}   |
| 14f57a85-35af-4edb-8bec-6f81beb9db88 |      | fa:16:3e:2f:7e:ee | {"subnet_id": "94a0c371-d37c-4796-821e-57c2a8ec65ae", "ip_address": "10.0.0.2"}   |
| 6239f501-e902-4b02-8d5c-69062896a2dd |      | fa:16:3e:20:67:9f | {"subnet_id": "94a0c371-d37c-4796-821e-57c2a8ec65ae", "ip_address": "10.0.0.201"} |
| 87094048-3832-472e-a100-7f9b45829da5 |      | fa:16:3e:b3:38:30 | {"subnet_id": "94a0c371-d37c-4796-821e-57c2a8ec65ae", "ip_address": "10.0.0.1"}   |
| c080dbeb-491e-46e2-ab7e-192e7627d050 |      | fa:16:3e:88:2e:e2 | {"subnet_id": "94a0c371-d37c-4796-821e-57c2a8ec65ae", "ip_address": "10.0.0.3"}   |
+--------------------------------------+------+-------------------+-----------------------------------------------------------------------------------+
Add this address to the ports c080dbeb-491e-46e2-ab7e-192e7627d050 and 12bf9ea4-4845-4e2c-b511-3b8b1ad7291d which are 10.0.0.3 and 10.0.0.4 (your vrrp-node instances):
$ neutron port-update  c080dbeb-491e-46e2-ab7e-192e7627d050 --allowed_address_pairs list=truetype=dict ip_address=10.0.0.201
$ neutron port-update  12bf9ea4-4845-4e2c-b511-3b8b1ad7291d --allowed_address_pairs list=truetype=dict ip_address=10.0.0.201
The allowed-address-pair 10.0.0.201 now shows up on the port:
$ neutron port-show12bf9ea4-4845-4e2c-b511-3b8b1ad7291d
+-----------------------+---------------------------------------------------------------------------------+
| Field                 | Value                                                                           |
+-----------------------+---------------------------------------------------------------------------------+
| admin_state_up        | True                                                                            |
| allowed_address_pairs | {"ip_address": "10.0.0.201", "mac_address": "fa:16:3e:7a:7b:18"}                |
| device_id             | e683e9d1-7eea-48dd-9d3a-a54cf9d9b7d6                                            |
| device_owner          | compute:None                                                                    |
| fixed_ips             | {"subnet_id": "94a0c371-d37c-4796-821e-57c2a8ec65ae", "ip_address": "10.0.0.4"} |
| id                    | 12bf9ea4-4845-4e2c-b511-3b8b1ad7291d                                            |
| mac_address           | fa:16:3e:7a:7b:18                                                               |
| name                  |                                                                                 |
| network_id            | 24e92ee1-8ae4-4c23-90af-accb3919f4d1                                            |
| port_security_enabled | True                                                                            |
| security_groups       | 36c8131f-d504-4bcc-b708-f330c9f6b67a                                            |
| status                | ACTIVE                                                                          |
| tenant_id             | d4e4332d5f8c4a8eab9fcb1345406cb0                                                |
OpenStack traffic that must traverse VXLAN tunnel dropped when using HPE 5930 switch Cause: UDP destination port 4789 is conflicting with OpenStack VXLAN traffic.
There is a configuration setting you can use in the switch to configure the port number the HPN kit will use for its own VXLAN tunnels. Setting this to a port number other than the one Neutron will use by default (4789) will keep the HPN kit from absconding with Neutron's VXLAN traffic. Specifically:
Parameters:
port-number: Specifies a UDP port number in the range of 1 to 65535. As a best practice, specify a port number in the range of 1024 to 65535 to avoid conflict with well-known ports.
Usage guidelines:
You must configure the same destination UDP port number on all VTEPs in a VXLAN.
Examples
# Set the destination UDP port number to 6666 for VXLAN packets.
<Sysname> system-view
[Sysname] vxlan udp-port 6666
Use vxlan udp-port to configure the destination UDP port number of VXLAN packets. Mandatory for all VXLAN packets to specify a UDP port Default The destination UDP port number is 4789 for VXLAN packets.
OVS can be configured to use a different port number itself:
# (IntOpt) The port number to utilize if tunnel_types includes 'vxlan'. By
# default, this will make use of the Open vSwitch default value of '4789' if
# not specified.
#
# vxlan_udp_port =
# Example: vxlan_udp_port = 8472
#
15.4.1.1 Issue: PCI-PT virtual machine gets stuck at boot #
If you are using a machine that uses Intel NICs, if the PCI-PT virtual machine gets stuck at boot, the boot agent should be disabled.
When Intel cards are used for PCI-PT, sometimes the tenant virtual machine gets stuck at boot. If this happens, you should download Intel bootutils and use it to disable the bootagent.
Use the following steps:
Download
preebot.tar.gzfrom the Intel website.Untar the
preboot.tar.gzfile on the compute host where the PCI-PT virtual machine is to be hosted.Go to path
~/APPS/BootUtil/Linux_x64and then run following command:./bootutil64e -BOOTENABLE disable -all
Now boot the PCI-PT virtual machine and it should boot without getting stuck.
15.5 Troubleshooting the Image (Glance) Service #
Troubleshooting scenarios with resolutions for the Glance service. We have gathered some of the common issues and troubleshooting steps that will help when resolving issues that occur with the Glance service.
15.5.1 Images Created in Horizon UI Get Stuck in a Queued State #
When creating a new image in the Horizon UI you will see the option for
Image Location which allows you to enter a HTTP source to
use when creating a new image for your cloud. However, this option is
disabled by default for security reasons. This results in any new images
created via this method getting stuck in a Queued state.
We cannot guarantee the security of any third party sites you use as image sources and the traffic goes over HTTP (non-SSL) traffic.
Resolution: You will need your cloud administrator to enable the HTTP store option in Glance for your cloud.
Here are the steps to enable this option:
Log in to the Cloud Lifecycle Manager.
Edit the file below:
~/openstack/ardana/ansible/roles/GLA-API/templates/glance-api.conf.j2
Locate the Glance store options and add the
httpvalue in thestoresfield. It will look like this:[glance_store] stores = {{ glance_stores }}Change this to:
[glance_store] stores = {{ glance_stores }},httpCommit your configuration to the Book “Installing with Cloud Lifecycle Manager”, Chapter 10 “Using Git for Configuration Management”, as follows:
cd ~/openstack/ardana/ansible
git add -A
git commit -m "adding HTTP option to Glance store list"
Run the configuration processor with this command:
cd ~/openstack/ardana/ansible
ansible-playbook -i hosts/localhost config-processor-run.yml
Use the playbook below to create a deployment directory:
cd ~/openstack/ardana/ansible
ansible-playbook -i hosts/localhost ready-deployment.yml
Run the Glance service reconfigure playbook which will update these settings:
cd ~/scratch/ansible/next/ardana/ansible/
ansible-playbook -i hosts/verb_hosts glance-reconfigure.yml
15.6 Storage Troubleshooting #
Troubleshooting scenarios with resolutions for Swift services.
15.6.1 Block Storage Troubleshooting #
The block storage service utilizes OpenStack Cinder and can integrate with multiple back-ends including 3Par. Failures may exist at the Cinder API level, an operation may fail, or you may see an alarm trigger in the monitoring service. These may be caused by configuration problems, network issues, or issues with your servers or storage back-ends. The purpose of this page and section is to describe how the service works, where to find additional information, some of the common problems that come up, and how to address them.
15.6.1.1 Where to find information #
When debugging block storage issues it is helpful to understand the deployment topology and know where to locate the logs with additional information.
The Cinder service consists of:
An API service, typically deployed and active on the controller nodes.
A scheduler service, also typically deployed and active on the controller nodes.
A volume service, which is deployed on all of the controller nodes but only active on one of them.
A backup service, which is deployed on the same controller node as the volume service.
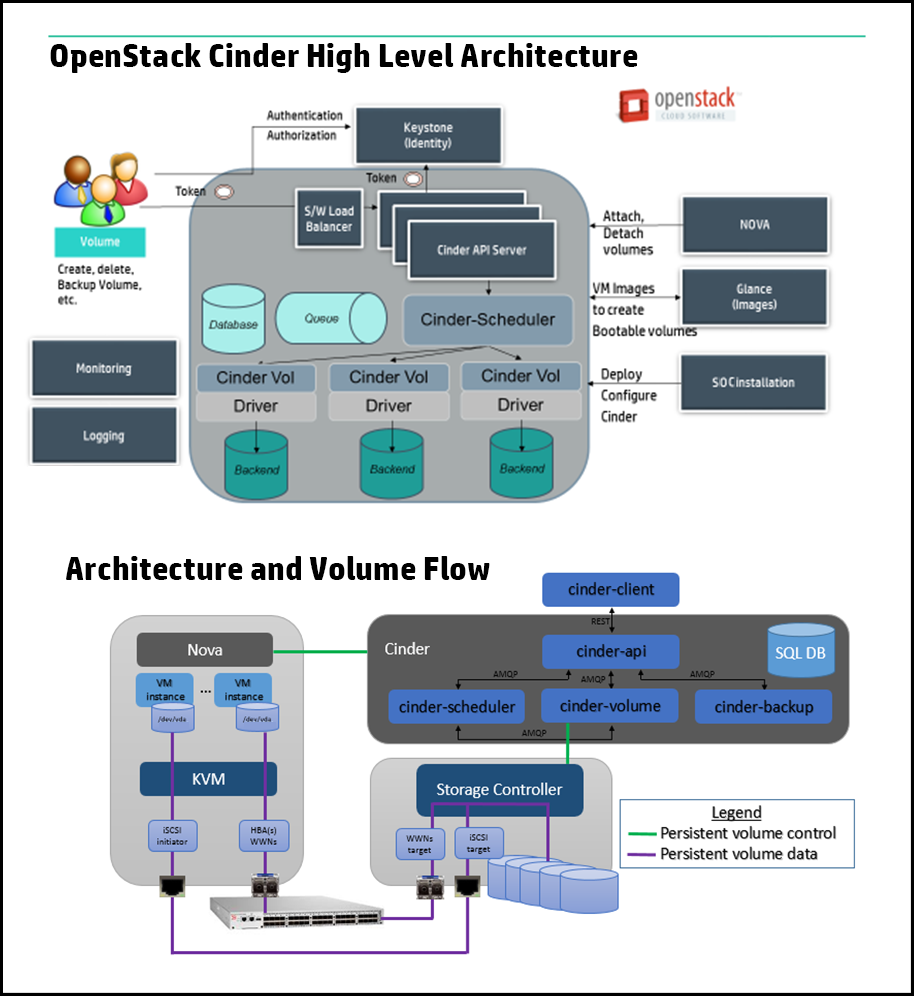
You can refer to your configuration files (usually located in
~/openstack/my_cloud/definition/ on the Cloud Lifecycle Manager) for
specifics about where your services are located. They will usually be
located on the controller nodes.
Cinder uses a MariaDB database and communicates between components by consuming messages from a RabbitMQ message service.
The Cinder API service is layered underneath a HAProxy service and accessed using a virtual IP address maintained using keepalived.
If any of the Cinder components is not running on its intended host then an
alarm will be raised. Details on how to resolve these alarms can be found on
our Section 15.1.1, “Alarm Resolution Procedures” page. You should check the logs for
the service on the appropriate nodes. All Cinder logs are stored in
/var/log/cinder/ and all log entries above
INFO level are also sent to the centralized logging
service. For details on how to change the logging level of the Cinder
service, see Section 12.2.6, “Configuring Settings for Other Services”.
In order to get the full context of an error you may need to examine the full log files on individual nodes. Note that if a component runs on more than one node you will need to review the logs on each of the nodes that component runs on. Also remember that as logs rotate that the time interval you are interested in may be in an older log file.
Log locations:
/var/log/cinder/cinder-api.log - Check this log if you
have endpoint or connectivity issues
/var/log/cinder/cinder-scheduler.log - Check this log if
the system cannot assign your volume to a back-end
/var/log/cinder/cinder-backup.log - Check this log if you
have backup or restore issues
/var/log/cinder-cinder-volume.log - Check here for
failures during volume creation
/var/log/nova/nova-compute.log - Check here for failures
with attaching volumes to compute instances
You can also check the logs for the database and/or the RabbitMQ service if your cloud exhibits database or messaging errors.
If the API servers are up and running but the API is not reachable then checking the HAProxy logs on the active keepalived node would be the place to look.
If you have errors attaching volumes to compute instances using the Nova API then the logs would be on the compute node associated with the instance. You can use the following command to determine which node is hosting the instance:
nova show <instance_uuid>
Then you can check the logs located at
/var/log/nova/nova-compute.log on that compute node.
15.6.1.2 Understanding the Cinder volume states #
Once the topology is understood, if the issue with the Cinder service relates to a specific volume then you should have a good understanding of what the various states a volume can be in are. The states are:
attaching
available
backing-up
creating
deleting
downloading
error
error attaching
error deleting
error detaching
error extending
error restoring
in-use
extending
restoring
restoring backup
retyping
uploading
The common states are in-use which indicates a volume is
currently attached to a compute instance and available
means the volume is created on a back-end and is free to be attached to an
instance. All -ing states are transient and represent a
transition. If a volume stays in one of those states for too long indicating
it is stuck, or if it fails and goes into an error state, you should check
for failures in the logs.
15.6.1.3 Initial troubleshooting steps #
These should be the initial troubleshooting steps you go through.
If you have noticed an issue with the service, you should check your monitoring system for any alarms that may have triggered. See Section 15.1.1, “Alarm Resolution Procedures” for resolution steps for those alarms.
Check if the Cinder API service is active by listing the available volumes from the Cloud Lifecycle Manager:
source ~/service.osrc
openstack volume list
Run a basic diagnostic from the Cloud Lifecycle Manager:
cd ~/scratch/ansible/next/ardana/ansible
ansible-playbook -i hosts/verb_hosts _cinder_post_check.yml
This ansible playbook will list all volumes, create a 1 GB volume and then delete it using the v1 and v2 APIs, which will exercise basic Cinder capability.
15.6.1.4 Common failures #
Alerts from the Cinder service
Check for alerts associated with the block storage service, noting that these could include alerts related to the server nodes being down, alerts related to the messaging and database services, or the HAProxy and keepalived services, as well as alerts directly attributed to the block storage service.
The Operations Console provides a web UI method for checking alarms. See Book “User Guide”, Chapter 1 “Using the Operations Console”, Section 1.1 “Operations Console Overview” for details on how to connect to the Operations Console.
Cinder volume service is down
The Cinder volume service could be down if the server hosting the
volume service fails. (Running the command cinder
service-list will show the state of the volume service.) In this
case you should follow the documented procedure linked below to start the
volume service on another controller node. See Section 7.1.3, “Managing Cinder Volume and Backup Services” for details.
Creating a Cinder bootable volume fails
When creating a bootable volume from an image, your Cinder volume must be larger than the Virtual Size (raw size) of your image or creation will fail with an error.
An error like this error would appear in
cinder-volume.log file:
'2016-06-14 07:44:00.954 25834 ERROR oslo_messaging.rpc.dispatcher ImageCopyFailure: Failed to copy image to volume: qemu-img: /dev/disk/by-path/ip-192.168.92.5:3260-iscsi-iqn.2003-10.com.lefthandnetworks:mg-ses:146:volume-c0e75c66-a20a-4368-b797-d70afedb45cc-lun-0: error while converting raw: Device is too small
2016-06-14 07:44:00.954 25834 ERROR oslo_messaging.rpc.dispatcher'
In an example where creating a 1GB bootable volume fails, your image may look like this:
$ qemu-img info /tmp/image.qcow2
image: /tmp/image.qcow2
file format: qcow2
virtual size: 1.5G (1563295744 bytes)
disk size: 354M
cluster_size: 65536
...
In this case, note that the image format is qcow2 and hte virtual size is 1.5GB, which is greater than the size of the bootable volume. Even though the compressed image size is less than 1GB, this bootable volume creation will fail.
When creating your disk model for nodes that will have the cinder volume role make sure that there is sufficient disk space allocated for a temporary space for image conversion if you will be creating bootable volumes. You should allocate enough space to the filesystem as would be needed to cater for the raw size of images to be used for bootable volumes - for example Windows images can be quite large in raw format.
By default, Cinder uses /var/lib/cinder for image
conversion and this will be on the root filesystem unless it is explicitly
separated. You can ensure there is enough space by ensuring that the root
file system is sufficiently large, or by creating a logical volume mounted
at /var/lib/cinder in the disk model when installing the
system.
If your system is already installed, use these steps to update this:
Edit the configuration item
image_conversion_dirincinder.conf.j2to point to another location with more disk space. Make sure that the new directory location has the same ownership and permissions as/var/lib/cinder(owner:cinder group:cinder. mode 0750).Then run this playbook:
cd ~/scratch/ansible/next/ardana/ansible ansible-playbook -i hosts/verb_hosts cinder-reconfigure.yml
API-level failures
If the API is inaccessible, determine if the API service is running on the target node. If it is not, check to see why the API service is not running in the log files. If it is running okay, check if the HAProxy service is functioning properly.
Note
After a controller node is rebooted, you must make sure to run the
ardana-start.yml playbook to ensure all the services are
up and running. For more information, see
Section 13.2.2.1, “Restarting Controller Nodes After a Reboot”.
If the API service is returning an error code, look for the error message in the API logs on all API nodes. Successful completions would be logged like this:
2016-04-25 10:09:51.107 30743 INFO eventlet.wsgi.server [req-a14cd6f3-6c7c-4076-adc3-48f8c91448f6 dfb484eb00f94fb39b5d8f5a894cd163 7b61149483ba4eeb8a05efa92ef5b197 - - -] 192.168.186.105 - - [25/Apr/2016 10:09:51] "GET /v2/7b61149483ba4eeb8a05efa92ef5b197/volumes/detail HTTP/1.1" 200 13915 0.235921
where 200 represents HTTP status 200 for a successful
completion. Look for a line with your status code and then examine all
entries associated with the request id. The request ID in the successful
completion is highlighted in bold above.
The request may have failed at the scheduler or at the volume or backup service and you should also check those logs at the time interval of interest, noting that the log file of interest may be on a different node.
Operations that do not complete
If you have started an operation, such as creating or deleting a volume, that does not complete, the Cinder volume may be stuck in a state. You should follow the procedures for detaling with stuck volumes.
There are six transitory states that a volume can get stuck in:
| State | Description |
|---|---|
| creating | The Cinder volume manager has sent a request to a back-end driver to create a volume, but has not received confirmation that the volume is available. |
| attaching | Cinder has received a request from Nova to make a volume available for attaching to an instance but has not received confirmation from Nova that the attachment is complete. |
| detaching | Cinder has received notification from Nova that it will detach a volume from an instance but has not received notification that the detachment is complete. |
| deleting | Cinder has received a request to delete a volume but has not completed the operation. |
| backing-up | Cinder backup manager has started to back a volume up to Swift, or some other backup target, but has not completed the operation. |
| restoring | Cinder backup manager has started to restore a volume from Swift, or some other backup target, but has not completed the operation. |
At a high level, the steps that you would take to address any of these states are similar:
Confirm that the volume is actually stuck, and not just temporarily blocked.
Where possible, remove any resources being held by the volume. For example, if a volume is stuck detaching it may be necessary to remove associated iSCSI or DM devices on the compute node.
Reset the state of the volume to an appropriate state, for example to
availableorerror.Do any final cleanup. For example, if you reset the state to
erroryou can then delete the volume.
The next sections will describe specific steps you can take for volumes stuck in each of the transitory states.
Volumes stuck in Creating
Broadly speaking, there are two possible scenarios where a volume would get
stuck in creating. The cinder-volume
service could have thrown an exception while it was attempting to create the
volume, and failed to handle the exception correctly. Or the volume back-end
could have failed, or gone offline, after it received the request from
Cinder to create the volume.
These two cases are different in that for the second case you will need to
determine the reason the back-end is offline and restart it. Often, when the
back-end has been restarted, the volume will move from
creating to available so your issue
will be resolved.
If you can create volumes successfully on the same back-end as the volume
stuck in creating then the back-end is not down. So you
will need to reset the state for the volume and then delete it.
To reset the state of a volume you can use the cinder
reset-state command. You can use either the UUID or the volume
name of the stuck volume.
For example, here is a volume list where we have a stuck volume:
$ cinder list +--------------------------------------+-----------+------+------+-------------+------------+ | ID | Status | Name | Size | Volume Type |Attached to | +--------------------------------------+-----------+------+------+-------------+------------+ | 14b76133-e076-4bd3-b335-fa67e09e51f6 | creating | vol1 | 1 | - | | +--------------------------------------+-----------+------+------+-------------+------------+
You can reset the state by using the cinder reset-state
command, like this:
cinder reset-state --state error 14b76133-e076-4bd3-b335-fa67e09e51f6
Confirm that with another listing:
$ cinder list +--------------------------------------+-----------+------+------+-------------+------------+ | ID | Status | Name | Size | Volume Type |Attached to | +--------------------------------------+-----------+------+------+-------------+------------+ | 14b76133-e076-4bd3-b335-fa67e09e51f6 | error | vol1 | 1 | - | | +--------------------------------------+-----------+------+------+-------------+------------+
You can then delete the volume:
$ cinder delete 14b76133-e076-4bd3-b335-fa67e09e51f6 Request to delete volume 14b76133-e076-4bd3-b335-fa67e09e51f6 has been accepted.
Volumes stuck in Deleting
If a volume is stuck in the deleting state then the request to delete the volume may or may not have been sent to and actioned by the back-end. If you can identify volumes on the back-end then you can examine the back-end to determine whether the volume is still there or not. Then you can decide which of the following paths you can take. It may also be useful to determine whether the back-end is responding, either by checking for recent volume create attempts, or creating and deleting a test volume.
The first option is to reset the state of the volume to
available and then attempt to delete the volume again.
The second option is to reset the state of the volume to
error and then delete the volume.
If you have reset the volume state to error then the volume
may still be consuming storage on the back-end. If that is the case then you
will need to delete it from the back-end using your back-end's specific tool.
Volumes stuck in Attaching
The most complicated situation to deal with is where a volume is stuck either in attaching or detaching, because as well as dealing with the state of the volume in Cinder and the back-end, you have to deal with exports from the back-end, imports to the compute node, and attachments to the compute instance.
The two options you have here are to make sure that all exports and imports
are deleted and to reset the state of the volume to
available or to make sure all of the exports and imports
are correct and to reset the state of the volume to
in-use.
A volume that is in attaching state should never have been made available to
a compute instance and therefore should not have any data written to it, or
in any buffers between the compute instance and the volume back-end. In that
situation, it is often safe to manually tear down the devices exported on
the back-end and imported on the compute host and then reset the volume state
to available.
You can use the management features of the back-end you are using to locate the compute host to where the volume is being exported.
Volumes stuck in Detaching
The steps in dealing with a volume stuck in detaching
state are very similar to those for a volume stuck in
attaching. However, there is the added consideration that
the volume was attached to, and probably servicing, I/O from a compute
instance. So you must take care to ensure that all buffers are properly
flushed before detaching the volume.
When a volume is stuck in detaching, the output from a
cinder list command will include the UUID for the
instance to which the volume was attached. From that you can identify the
compute host that is running the instance using the nova
show command.
For example, here are some snippets:
$ cinder list +--------------------------------------+-----------+-----------------------+-----------------+ | ID | Status | Name | Attached to | +--------------------------------------+-----------+-----------------------+-----------------+ | 85384325-5505-419a-81bb-546c69064ec2 | detaching | vol1 | 4bedaa76-78ca-… | +--------------------------------------+-----------+-----------------------+-----------------+
$ nova show 4bedaa76-78ca-4fe3-806a-3ba57a9af361|grep host | OS-EXT-SRV-ATTR:host | mycloud-cp1-comp0005-mgmt | OS-EXT-SRV-ATTR:hypervisor_hostname | mycloud-cp1-comp0005-mgmt | hostId | 61369a349bd6e17611a47adba60da317bd575be9a900ea590c1be816
The first thing to check in this case is whether the instance is still
importing the volume. Use virsh list and virsh
dumpxml as described in the section above. If the XML for the
instance has a reference to the device, then you should reset the volume
state to in-use and attempt the cinder
detach operation again.
$ cinder reset-state --state in-use --attach-status attached 85384325-5505-419a-81bb-546c69064ec2
If the volume gets stuck detaching again, there may be a more fundamental problem, which is outside the scope of this document and you should contact the Support team.
If the volume is not referenced in the XML for the instance then you should
remove any devices on the compute node and back-end and then reset the state
of the volume to available.
$ cinder reset-state --state available --attach-status detached 85384325-5505-419a-81bb-546c69064ec2
You can use the management features of the back-end you are using to locate the compute host to where the volume is being exported.
Volumes stuck in restoring
Restoring a Cinder volume from backup will be as slow as backing it up. So
you must confirm that the volume is actually stuck by examining the
cinder-backup.log. For example:
# tail -f cinder-backup.log |grep 162de6d5-ba92-4e36-aba4-e37cac41081b 2016-04-27 12:39:14.612 6689 DEBUG swiftclient [req-0c65ec42-8f9d-430a-b0d5-05446bf17e34 - - 2016-04-27 12:39:15.533 6689 DEBUG cinder.backup.chunkeddriver [req-0c65ec42-8f9d-430a-b0d5- 2016-04-27 12:39:15.566 6689 DEBUG requests.packages.urllib3.connectionpool [req-0c65ec42- 2016-04-27 12:39:15.567 6689 DEBUG swiftclient [req-0c65ec42-8f9d-430a-b0d5-05446bf17e34 - - -
If you determine that the volume is genuinely stuck in
detaching then you must follow the procedure described in
the detaching section above to remove any volumes that remain exported from
the back-end and imported on the controller node. Remember that in this case
the volumes will be imported and mounted on the controller node running
cinder-backup. So you do not have to search for the
correct compute host. Also remember that no instances are involved so you do
not need to confirm that the volume is not imported to any instances.
15.6.1.5 Debugging volume attachment #
In an error case, it is possible for a Cinder volume to fail to complete an operation and revert back to its initial state. For example, attaching a Cinder volume to a Nova instance, so you would follow the steps above to examine the Nova compute logs for the attach request.
15.6.1.6 Errors creating volumes #
If you are creating a volume and it goes into the ERROR
state, a common error to see is No valid host was found.
This means that the scheduler could not schedule your volume to a back-end.
You should check that the volume service is up and running. You can use this
command:
$ sudo cinder-manage service list Binary Host Zone Status State Updated At cinder-scheduler ha-volume-manager nova enabled :-) 2016-04-25 11:39:30 cinder-volume ha-volume-manager@ses1 nova enabled XXX 2016-04-25 11:27:26 cinder-backup ha-volume-manager nova enabled :-) 2016-04-25 11:39:28
In this example, the state of XXX indicates that the
service is down.
If the service is up, next check that the back-end has sufficient space. You can use this command to show the available and total space on each back-end:
cinder get-pools –detail
If your deployment is using volume types, verify that the
volume_backend_name in your
cinder.conf file matches the
volume_backend_name for the volume type you selected.
You can verify the back-end name on your volume type by using this command:
openstack volume type list
Then list the details about your volume type. For example:
$ openstack volume type show dfa8ecbd-8b95-49eb-bde7-6520aebacde0 +---------------------------------+--------------------------------------+ | Field | Value | +---------------------------------+--------------------------------------+ | description | None | | id | dfa8ecbd-8b95-49eb-bde7-6520aebacde0 | | is_public | True | | name | my3par | | os-volume-type-access:is_public | True | | properties | volume_backend_name='3par' | +---------------------------------+--------------------------------------+
15.6.1.7 Diagnosing back-end issues #
You can find further troubleshooting steps for specific back-end types by vising these pages:
15.6.2 Swift Storage Troubleshooting #
Troubleshooting scenarios with resolutions for the Swift service. You can use these guides to help you identify and resolve basic problems you may experience while deploying or using the Object Storage service. It contains the following troubleshooting scenarios:
15.6.2.1 Deployment Fails With “MSDOS Disks Labels Do Not Support Partition Names” #
Description
If a disk drive allocated to Swift uses the MBR partition table type, the
deploy process refuses to label and format the drive. This is to prevent
potential data loss. (For more information, see Book “Planning an Installation with Cloud Lifecycle Manager”, Chapter 11 “Modifying Example Configurations for Object Storage using Swift”, Section 11.5 “Allocating Disk Drives for Object Storage”. If you intend to use the disk drive for
Swift, you must convert the MBR partition table to GPT on the drive using
/sbin/sgdisk.
Note
This process only applies to Swift drives. It does not apply to the operating system or boot drive.
Resolution
You must install gdisk, before using
sgdisk:
Run the following command to install
gdisk:sudo zypper install gdisk
Convert to the GPT partition type. Following is an example for converting
/dev/sddto the GPT partition type:sudo sgdisk -g /dev/sdd
Reboot the node to take effect. You may then resume the deployment (repeat the playbook that reported the error).
15.6.2.2 Examining Planned Ring Changes #
Before making major changes to your rings, you can see the planned layout of Swift rings using the following steps:
Log in to the Cloud Lifecycle Manager.
Run the
swift-compare-model-rings.ymlplaybook:cd ~/scratch/ansible/next/ardana/ansible ansible-playbook -i hosts/verb_hosts swift-compare-model-rings.yml --extra-vars "drive_detail=yes"
Validate the following in the output:
Drives are being added to all rings in the ring specifications.
Servers are being used as expected (for example, you may have a different set of servers for the account/container rings than the object rings.)
The drive size is the expected size.
15.6.2.3 Interpreting Swift Input Model Validation Errors #
The following examples provide an error message, description, and resolution.
Note
To resolve an error, you must first modify the input model and re-run the configuration processor. (For instructions, see Book “Installing with Cloud Lifecycle Manager”, Chapter 10 “Using Git for Configuration Management”.) Then, continue with the deployment.
Example Message - Model Mismatch: Cannot find drive /dev/sdt on padawan-ccp-c1-m2 (192.168.245.3))
Description The disk model used for node padawan-ccp-c1-m2 has drive /dev/sdtlisted in the devices list of a device-group where Swift is the consumer. However, thedev/sdtdevice does not exist on that node.Resolution If a drive or controller is failed on a node, the operating system does not see the drive and so the corresponding block device may not exist. Sometimes this is transitory and a reboot may resolve the problem. The problem may not be with
/dev/sdt, but with another drive. For example, if/dev/sdsis failed, when you boot the node, the drive that you expect to be called/dev/sdtis actually called/dev/sds.Alternatively, there may not be enough drives installed in the server. You can add drives. Another option is to remove
/dev/sdtfrom the appropriate disk model. However, this removes the drive for all servers using the disk model.Example Message - Model Mismatch: Cannot find drive /dev/sdd2 on padawan-ccp-c1-m2 (192.168.245.3)
Description The disk model used for node padawan-ccp-c1-m2 has drive /dev/sdtlisted in the devices list of a device-group where Swift is the consumer. However, the partition number (2) has been specified in the model. This is not supported - only specify the block device name (for example/dev/sdd), not partition names in disk models.Resolution Remove the partition number from the disk model. Example Message - Cannot find IP address of padawan-ccp-c1-m3-swift for ring: account host: padawan-ccp-c1-m3-mgmt
Description The service (in this example, swift-account) is running on the node padawan-ccp-c1-m3. However, this node does not have a connection to the network designated for the swift-accountservice (that is, the SWIFT network).Resolution Check the input model for which networks are configured for each node type. Example Message - Ring: object-2 has specified replication_policy and erasure_coding_policy. Only one may be specified.
Description Only either replication-policyorerasure-coding-policymay be used inring-specifications.Resolution Remove one of the policy types. Example Message - Ring: object-3 is missing a policy type (replication-policy or erasure-coding-policy)
Description There is no replication-policyorerasure-coding-policysection inring-specificationsfor the object-0 ring.Resolution Add a policy type to the input model file.
15.6.2.4 Identifying the Swift Ring Building Server #
15.6.2.4.1 Identify the Swift Ring Building server #
Perform the following steps to identify the Swift ring building server:
Log in to the Cloud Lifecycle Manager.
Run the following command:
cd ~/scratch/ansible/next/ardana/ansible ansible-playbook -i hosts/verb_hosts swift-status.yml --limit SWF-ACC[0]
Examine the output of this playbook. The last line underneath the play recap will give you the server name which is your Swift ring building server.
PLAY RECAP ******************************************************************** _SWF_CMN | status | Check systemd service running ----------------------- 1.61s _SWF_CMN | status | Check systemd service running ----------------------- 1.16s _SWF_CMN | status | Check systemd service running ----------------------- 1.09s _SWF_CMN | status | Check systemd service running ----------------------- 0.32s _SWF_CMN | status | Check systemd service running ----------------------- 0.31s _SWF_CMN | status | Check systemd service running ----------------------- 0.26s ------------------------------------------------------------------------------- Total: ------------------------------------------------------------------ 7.88s ardana-cp1-c1-m1-mgmt : ok=7 changed=0 unreachable=0 failed=0In the above example, the first swift proxy server is
ardana-cp1-c1-m1-mgmt.
Important
For the purposes of this document, any errors you see in the output of this playbook can be ignored if all you are looking for is the server name for your Swift ring builder server.
15.6.2.5 Verifying a Swift Partition Label #
Warning
For a system upgrade do NOT clear the label before starting the upgrade.
This topic describes how to check whether a device has a label on a partition.
15.6.2.5.1 Check Partition Label #
To check whether a device has label on a partition, perform the following step:
Log on to the node and use the
partedcommand:sudo parted -l
The output lists all of the block devices. Following is an example output for
/dev/sdcwith a single partition and a label of c0a8f502h000. Because the partition has a label, if you are about to install and deploy the system, you must clear this label before starting the deployment. As part of the deployment process, the system will label the partition.. . . Model: QEMU QEMU HARDDISK (scsi) Disk /dev/sdc: 20.0GB Sector size (logical/physical): 512B/512B Partition Table: gpt Disk Flags: Number Start End Size File system Name Flags 1 1049kB 20.0GB 20.0GB xfs c0a8f502h000 . . .
15.6.2.6 Verifying a Swift File System Label #
Warning
For a system upgrade do NOT clear the label before starting the upgrade.
This topic describes how to check whether a file system in a partition has a label.
To check whether a file system in a partition has a label, perform the following step:
Log on to the server and execute the
xfs_admincommand (where/dev/sdc1is the partition where the file system is located):sudo xfs_admin -l /dev/sdc1
The output shows if a file system has a label. For example, this shows a label of c0a8f502h000:
$ sudo xfs_admin -l /dev/sdc1 label = "c0a8f502h000"If no file system exists, the result is as follows:
$ sudo xfs_admin -l /dev/sde1 xfs_admin: /dev/sde is not a valid XFS file system (unexpected SB magic number 0x00000000)
If you are about to install and deploy the system, you must delete the label before starting the deployment. As part of the deployment process, the system will label the partition.
15.6.2.7 Recovering Swift Builder Files #
When you execute the deploy process for a system, a copy of the builder files are stored on the following nodes and directories:
On the Swift ring building node, the primary reference copy is stored in the
/etc/swiftlm/<cloud-name>/<control-plane-name>/builder_dir/directory.On the next node after the Swift ring building node, a backup copy is stored in the
/etc/swiftlm/<cloud-name>/<control-plane-name>/builder_dir/directory.In addition, in the deploy process, the builder files are also copied to the
/etc/swiftlm/deploy_dir/<cloud-name>directory on every Swift node.
If a copy of the builder files are found in the
/etc/swiftlm/<cloud-name>/<control-plane-name>/builder_dir/
then no further recover action is needed. However, if all nodes running the
Swift account (SWF-ACC) are lost, then you need to copy the files from the
/etc/swiftlm/deploy_dir/<cloud-name> directory from
an intact Swift node to the
/etc/swiftlm/<cloud-name>/<control-plane-name>/builder_dir/
directory on the primary Swift ring building node.
If you have no intact /etc/swiftlm directory on any Swift
node, you may be able to restore from Freezer. See
Section 13.2.2.2, “Recovering the Control Plane”.
To restore builder files from the /etc/swiftlm/deploy_dir
directory, use the following process:
Log in to the Swift ring building server (To identify the Swift ring building server, see Section 15.6.2.4, “Identifying the Swift Ring Building Server”).
Create the
/etc/swiftlm/CLOUD_NAME/CONTROL_PLANE_NAME/builder_dirdirectory structure with these commands:Replace CLOUD_NAME with the name of your cloud and CONTROL_PLANE_NAME with the name of your control plane.
tux >sudo mkdir -p /etc/swiftlm/<cloud-name>/<control-plane-name>/builder_dir/tux >sudo chown -R ardana.ardana /etc/swiftlm/Log in to a Swift node where an intact
/etc/swiftlm/deploy_dirdirectory exists.Copy the builder files to the Swift ring building node. In the example below we use scp to transfer the files, where
swpac-c1-m1-mgmtis the ring building node,cloud1is the cloud, andcp1is the control plane name:ardana >scp /etc/swiftlm//cloud1/cp1/* swpac-ccp-c1-m1-mgmt:/etc/swiftlm/cloud1/cp1/builder_dir/Log in to the Cloud Lifecycle Manager.
Run the Swift reconfigure playbook to make sure every Swift node has the same rings:
ardana >cd ~/scratch/ansible/next/ardana/ansibleardana >ansible-playbook -i hosts/verb_hosts swift-reconfigure.yml
15.6.2.8 Restarting the Object Storage Deployment #
This page describes the various operational procedures performed by Swift.
15.6.2.8.1 Restart the Swift Object Storage Deployment #
The structure of ring is built in an incremental stages. When you modify a
ring, the new ring uses the state of the old ring as a basis for the new
ring. Rings are stored in the builder file. The
swiftlm-ring-supervisor stores builder files in the
/etc/swiftlm/cloud1/cp1/builder_dir/
directory on the Ring-Builder node. The builder files are named
<ring-name> builder. Prior versions of the builder files are stored in
the
/etc/swiftlm/cloud1/cp1/builder_dir/backups
directory.
Generally, you use an existing builder file as the basis for changes to a ring. However, at initial deployment, when you create a ring there will be no builder file. Instead, the first step in the process is to build a builder file. The deploy playbook does this as a part of the deployment process. If you have successfully deployed some of the system, the ring builder files will exist.
If you change your input model (for example, by adding servers) now, the process assumes you are modifying a ring and behaves differently than while creating a ring from scratch. In this case, the ring is not balanced. So, if the cloud model contains an error or you decide to make substantive changes, it is a best practice to start from scratch and build rings using the steps below.
15.6.2.8.2 Reset Builder Files #
You must reset the builder files during the initial deployment process (only). This process should be used only when you want to restart a deployment from scratch. If you reset the builder files after completing your initial deployment, then you are at a risk of losing critical system data.
Delete the builder files in the
/etc/swiftlm/cloud1/cp1/builder-dir/
directory. For example, for the region0 Keystone region (the default single
region designation), do the following:
sudo rm /etc/swiftlm/cloud1/cp1/builder_dir/*.builder
Note
If you have successfully deployed a system and accidentally delete the builder files, you can recover to the correct state. For instructions, see Section 15.6.2.7, “Recovering Swift Builder Files”.
15.6.2.9 Increasing the Swift Node Timeout Value #
On a heavily loaded Object Storage system timeouts may occur when transferring data to or from Swift, particularly large objects.
The following is an example of a timeout message in the log
(/var/log/swift/swift.log) on a Swift proxy server:
Jan 21 16:55:08 ardana-cp1-swpaco-m1-mgmt proxy-server: ERROR with Object server 10.243.66.202:6000/disk1 re: Trying to write to /v1/AUTH_1234/testcontainer/largeobject: ChunkWriteTimeout (10s)
If this occurs, it may be necessary to increase the
node_timeout parameter in the
proxy-server.conf configuration file.
The node_timeout parameter in the Swift
proxy-server.conf file is the maximum amount of time the
proxy server will wait for a response from the account, container, or object
server. The default value is 10 seconds.
In order to modify the timeout you can use these steps:
Log in to the Cloud Lifecycle Manager.
Edit the
~/openstack/my_cloud/config/swift/proxy-server.conf.j2file and add a line specifying thenode_timeoutinto the[app:proxy-server]section of the file.Example, in bold, increasing the timeout to 30 seconds:
[app:proxy-server] use = egg:swift#proxy . . node_timeout = 30Commit your configuration to the Book “Installing with Cloud Lifecycle Manager”, Chapter 10 “Using Git for Configuration Management”, as follows:
cd ~/openstack/ardana/ansible git add -A git commit -m "My config or other commit message"
Run the configuration processor:
cd ~/openstack/ardana/ansible ansible-playbook -i hosts/localhost config-processor-run.yml
Use the playbook below to create a deployment directory:
cd ~/openstack/ardana/ansible ansible-playbook -i hosts/localhost ready-deployment.yml
Change to the deployment directory and run the Swift reconfigure playbook:
cd ~/scratch/ansible/next/ardana/ansible ansible-playbook -i hosts/verb_hosts swift-reconfigure.yml
15.6.2.10 Troubleshooting Swift File System Usage Issues #
If you have recycled your environment to do a re-installation and you haven't
run the wipe_disks.yml playbook in the process, you may
experience an issue where your file system usage continues to grow
exponentially even though you are not adding any files to your Swift system.
This is likely occurring because the quarantined directory is getting filled
up. You can find this directory at
/srv/node/disk0/quarantined.
You can resolve this issue by following these steps:
SSH to each of your Swift nodes and stop the replication processes on each of them. The following commands must be executed on each of your Swift nodes. Make note of the time that you performed this action as you will reference it in step three.
sudo systemctl stop swift-account-replicator sudo systemctl stop swift-container-replicator sudo systemctl stop swift-object-replicator
Examine the
/var/log/swift/swift.logfile for events that indicate when the auditor processes have started and completed audit cycles. For more details, see Section 15.6.2.10, “Troubleshooting Swift File System Usage Issues”.Wait until you see that the auditor processes have finished two complete cycles since the time you stopped the replication processes (from step one). You must check every Swift node, which on a lightly loaded system that was recently installed this should take less than two hours.
At this point you should notice that your quarantined directory has stopped growing. You may now delete the files in that directory on each of your nodes.
Restart the replication processes using the Swift start playbook:
Log in to the Cloud Lifecycle Manager.
Run the Swift start playbook:
cd ~/scratch/ansible/next/ardana/ansible ansible-playbook -i hosts/verb_hosts swift-start.yml
15.6.2.10.1 Examining the Swift Log for Audit Event Cycles #
Below is an example of the object-server start and end
cycle details. They were taken by using the following command on a Swift
node:
sudo grep object-auditor /var/log/swift/swift.log|grep ALL
Example output:
$ sudo grep object-auditor /var/log/swift/swift.log|grep ALL ... Apr 1 13:31:18 padawan-ccp-c1-m1-mgmt object-auditor: Begin object audit "forever" mode (ALL) Apr 1 13:31:18 padawan-ccp-c1-m1-mgmt object-auditor: Object audit (ALL). Since Fri Apr 1 13:31:18 2016: Locally: 0 passed, 0 quarantined, 0 errors files/sec: 0.00 , bytes/sec: 0.00, Total time: 0.00, Auditing time: 0.00, Rate: 0.00 Apr 1 13:51:32 padawan-ccp-c1-m1-mgmt object-auditor: Object audit (ALL) "forever" mode completed: 1213.78s. Total quarantined: 0, Total errors: 0, Total files/sec: 7.02, Total bytes/sec: 9999722.38, Auditing time: 1213.07, Rate: 1.00
In this example, the auditor started at 13:31 and ended
at 13:51.
In this next example, the account-auditor and
container-auditor use similar message structure, so we
only show the container auditor. You can substitute
account for container as well:
$ sudo grep container-auditor /var/log/swift/swift.log ... Apr 1 14:07:00 padawan-ccp-c1-m1-mgmt container-auditor: Begin container audit pass. Apr 1 14:07:00 padawan-ccp-c1-m1-mgmt container-auditor: Since Fri Apr 1 13:07:00 2016: Container audits: 42 passed audit, 0 failed audit Apr 1 14:37:00 padawan-ccp-c1-m1-mgmt container-auditor: Container audit pass completed: 0.10s
In the example, the container auditor started a cycle at
14:07 and the cycle finished at 14:37.
15.7 Monitoring, Logging, and Usage Reporting Troubleshooting #
Troubleshooting scenarios with resolutions for the Monitoring, Logging, and Usage Reporting services.
15.7.1 Troubleshooting Centralized Logging #
This section contains the following scenarios:
15.7.1.1 Reviewing Log Files #
You can troubleshoot service-specific issues by reviewing the logs. After logging into Kibana, follow these steps to load the logs for viewing:
Navigate to the Settings menu to configure an index pattern to search for.
In the Index name or pattern field, you can enter
logstash-*to query all Elasticsearch indices.Click the green Create button to create and load the index.
Navigate to the Discover menu to load the index and make it available to search.
Note
If you want to search specific Elasticsearch indices, you can run the following command from the control plane to get a full list of available indices:
curl localhost:9200/_cat/indices?v
Once the logs load you can change the timeframe from the dropdown in the upper-righthand corner of the Kibana window. You have the following options to choose from:
Quick - a variety of time frame choices will be available here
Relative - allows you to select a start time relative to the current time to show this range
Absolute - allows you to select a date range to query
When searching there are common fields you will want to use, such as:
type - this will include the service name, such as
keystoneorceilometerhost - you can specify a specific host to search for in the logs
file - you can specify a specific log file to search
For more details on using Kibana and Elasticsearch to query logs, see https://www.elastic.co/guide/en/kibana/3.0/working-with-queries-and-filters.html
15.7.1.2 Monitoring Centralized Logging #
To help keep ahead of potential logging issues and resolve issues before they affect logging, you may want to monitor the Centralized Logging Alarms.
To monitor logging alarms:
Log in to Operations Console.
From the menu button in the upper left corner, navigate to the Alarm Definitions page.
Find the alarm definitions that are applied to the various hosts. See the Section 15.1.1, “Alarm Resolution Procedures” for the Centralized Logging Alarm Definitions.
Navigate to the Alarms page
Find the alarm definitions applied to the various hosts. These should match the alarm definitions in the Section 15.1.1, “Alarm Resolution Procedures”.
See if the alarm is green (good) or is in a bad state. If any are in a bad state, see the possible actions to perform in the Section 15.1.1, “Alarm Resolution Procedures”.
You can use this filtering technique in the "Alarms" page to look for the following:
To look for processes that may be down, filter for "Process" then make sure the process are up:
Elasticsearch
Logstash
Beaver
Apache (Kafka)
Kibana
Monasca
To look for sufficient disk space, filter for "Disk"
To look for sufficient RAM memory, filter for "Memory"
15.7.1.3 Situations In Which Logs Might Not Be Collected #
Centralized logging might not collect log data under the following circumstances:
If the Beaver service is not running on one or more of the nodes (controller or compute), logs from these nodes will not be collected.
15.7.1.4 Error When Creating a Kibana Visualization #
When creating a visualization in Kibana you may get an error similiar to this:
"logstash-*" index pattern does not contain any of the following field types: number
To resolve this issue:
Log in to Kibana.
Navigate to the
Settingspage.In the left panel, select the
logstash-*index.Click the Refresh button. You may see a mapping conflict warning after refreshing the index.
Re-create the visualization.
15.7.1.5 After Deploying Logging-API, Logs Are Not Centrally Stored #
If you are using the Logging-API and logs are not being centrally stored, use the following checklist to troubleshoot Logging-API.
| ☐ | Item |
|---|---|
|
Ensure Monasca is running. | |
|
Check any alarms Monasca has triggered. | |
|
Check to see if the Logging-API (monasca-log-api) process alarm has triggered. | |
|
Run an Ansible playbook to get status of the Cloud Lifecycle Manager: ansible-playbook -i hosts/verb_hosts ardana-status.yml | |
|
Troubleshoot all specific tasks that have failed on the Cloud Lifecycle Manager. | |
| Ensure that the Logging-API daemon is up. | |
|
Run an Ansible playbook to try and bring the Logging-API daemon up: ansible-playbook –I hosts/verb_hosts logging-start.yml | |
|
If you get errors trying to bring up the daemon, resolve them. | |
|
Verify the Logging-API configuration settings are correct in the configuration file: roles/kronos-api/templates/kronos-apache2.conf.j2 |
The following is a sample Logging-API configuration file:
{#
# (c) Copyright 2015-2016 Hewlett Packard Enterprise Development LP
# Licensed under the Apache License, Version 2.0 (the "License"); you may
# not use this file except in compliance with the License. You may obtain
# a copy of the License at
#
# http://www.apache.org/licenses/LICENSE-2.0
#
# Unless required by applicable law or agreed to in writing, software
# distributed under the License is distributed on an "AS IS" BASIS, WITHOUT
# WARRANTIES OR CONDITIONS OF ANY KIND, either express or implied. See the
# License for the specific language governing permissions and limitations
# under the License.
#
#}
Listen {{ kronos_api_host }}:{{ kronos_api_port }}
<VirtualHost *:{{ kronos_api_port }}>
WSGIDaemonProcess log-api processes=4 threads=4 socket-timeout=300 user={{ kronos_user }} group={{ kronos_group }} python-path=/opt/stack/service/kronos/venv:/opt/stack/service/kronos/venv/bin/../lib/python2.7/site-packages/ display-name=monasca-log-api
WSGIProcessGroup log-api
WSGIApplicationGroup log-api
WSGIScriptAlias / {{ kronos_wsgi_dir }}/app.wsgi
ErrorLog /var/log/kronos/wsgi.log
LogLevel info
CustomLog /var/log/kronos/wsgi-access.log combined
<Directory /opt/stack/service/kronos/venv/bin/../lib/python2.7/site-packages/monasca_log_api>
Options Indexes FollowSymLinks MultiViews
Require all granted
AllowOverride None
Order allow,deny
allow from all
LimitRequestBody 102400
</Directory>
SetEnv no-gzip 1
</VirtualHost>15.7.1.6 Re-enabling Slow Logging #
MariaDB slow logging was enabled by default in earlier versions. Slow
logging logs slow MariaDB queries to
/var/log/mysql/mysql-slow.log on
FND-MDB hosts.
As it is possible for temporary tokens to be logged to the slow log, we have disabled slow log in this version for security reasons.
To re-enable slow logging follow the following procedure:
Login to the Cloud Lifecycle Manager and set a mariadb service configurable to enable slow logging.
cd ~/openstack/my_cloud
Check slow_query_log is currently disabled with a value of 0:
grep slow ./config/percona/my.cfg.j2 slow_query_log = 0 slow_query_log_file = /var/log/mysql/mysql-slow.log
Enable slow logging in the server configurable template file and confirm the new value:
sed -e 's/slow_query_log = 0/slow_query_log = 1/' -i ./config/percona/my.cfg.j2 grep slow ./config/percona/my.cfg.j2 slow_query_log = 1 slow_query_log_file = /var/log/mysql/mysql-slow.log
Commit the changes:
git add -A git commit -m "Enable Slow Logging"
Run the configuration procesor.
cd ~/openstack/ardana/ansible/ ansible-playbook -i hosts/localhost config-processor-run.yml
You will be prompted for an encryption key, and also asked if you want to change the encryption key to a new value, and it must be a different key. You can turn off encryption by typing the following:
ansible-playbook -i hosts/localhost config-processor-run.yml -e encrypt="" -e rekey=""
Create a deployment directory.
ansible-playbook -i hosts/localhost ready-deployment.yml
Reconfigure Percona (note this will restart your mysqld server on your cluster hosts).
ansible-playbook -i hosts/verb_hosts percona-reconfigure.yml
15.7.2 Usage Reporting Troubleshooting #
Troubleshooting scenarios with resolutions for the Ceilometer service.
This page describes troubleshooting scenarios for Ceilometer.
15.7.2.1 Logging #
Logs for the various running components in the Overcloud Controllers can be found at /var/log/ceilometer.log
The Upstart for the services also logs data at /var/log/upstart
15.7.2.2 Modifying #
Change the level of debugging in Ceilometer by editing the ceilometer.conf file located at /etc/ceilometer/ceilometer.conf. To log the maximum amount of information, change the level entry to DEBUG.
Note: When the logging level for a service is changed, that service must be re-started before the change will take effect.
This is an excerpt of the ceilometer.conf configuration file showing where to make changes:
[loggers] keys: root [handlers] keys: watchedfile, logstash [formatters] keys: context, logstash [logger_root] qualname: root handlers: watchedfile, logstash level: NOTSET
15.7.2.3 Messaging/Queuing Errors #
Ceilometer relies on a message bus for passing data between the various components. In high-availability scenarios, RabbitMQ servers are used for this purpose. If these servers are not available, the Ceilometer log will record errors during "Connecting to AMQP" attempts.
These errors may indicate that the RabbitMQ messaging nodes are not running as expected and/or the RPC publishing pipeline is stale. When these errors occur, re-start the instances.
Example error:
Error: unable to connect to node 'rabbit@xxxx-rabbitmq0000': nodedown
Use the RabbitMQ CLI to re-start the instances and then the host.
Restart the downed cluster node.
sudo invoke-rc.d rabbitmq-server start
Restart the RabbitMQ host
sudo rabbitmqctl start_app
15.8 Backup and Restore Troubleshooting #
Troubleshooting scenarios with resolutions for the Backup and Restore service.
The following logs will help you troubleshoot Freezer functionality:
| Component | Description |
| Freezer Client |
/var/log/freezer-agent/freezer-agent.log |
| Freezer Scheduler | /var/log/freezer-agent/freezer-scheduler.log |
| Freezer API | /var/log/freezer-api/freezer-api-access.log/var/log/freezer-api/freezer-api-modwsgi.log /var/log/freezer-api/freezer-api.log |
The following issues apply to the Freezer UI and the backup and restore process:
The UI for backup and restore is supported only if you log in as "ardana_backup". All other users will see the UI panel but the UI will not work.
If a backup or restore action fails via the UI, you must check the Freezer logs for details of the failure.
Job Status and Job Result on the UI and backend (CLI) are not in sync.
For a given "Action" the following modes are not supported from the UI:
Microsoft SQL Server
Cinder
Nova
Start and end dates and times available for job creation should not be used due to a known issue. Please refrain from using those fields.
Once a backup is created. A listing of the contents is needed to verify if the backup of any single item was done.
15.9 Orchestration Troubleshooting #
Troubleshooting scenarios with resolutions for the Orchestration services. Troubleshooting scenarios with resolutions for the Orchestration services.
15.9.1 Heat Troubleshooting #
Troubleshooting scenarios with resolutions for the Heat service. This page describes troubleshooting scenarios for Heat.
15.9.1.1 RPC timeout on Heat stack creation #
If you exerience a remote procedure call (RPC) timeout failure when attempting heat stack-create, you can work around the issue by increasing the timeout value and purging records of deleted stacks from the database. To do so, follow the steps below. An example of the error is:
MessagingTimeout: resources.XXX-LCP-Pair01.resources[0]: Timed out waiting for a reply to message ID e861c4e0d9d74f2ea77d3ec1984c5cb6
Increase the timeout value.
cd ~/openstack/my_cloud/config/heat
Make changes to heat config files. In heat.conf.j2 add this timeout value:
rpc_response_timeout=300
Commit your changes
git commit -a -m "some message"
Move to ansible directory and run the following playbooks:
cd ~/openstack/ardana/ansible ansible-playbook -i hosts/localhost config-processor-run.yml ansible-playbook -i hosts/localhost ready-deployment.yml
Change to the scratch directory and run heat-reconfigure:
cd ~/scratch/ansible/next/ardana/ansible ansible-playbook -i hosts/verb_hosts heat-reconfigure.yml
Purge records of deleted stacks from the database. First delete all stacks that are in failed state. Then execute the following
sudo /opt/stack/venv/heat-20151116T000451Z/bin/python2 /opt/stack/service/heat-engine/venv/bin/heat-manage --config-file /opt/stack/service/heat-engine-20151116T000451Z/etc/heat/heat.conf --config-file /opt/stack/service/heat-engine-20151116T000451Z/etc/heat/engine.conf purge_deleted 0
15.9.1.2 General Heat stack creation errors #
In Heat, in general when a timeout occurs it means that the underlying resource service such as Nova, Neutron, or Cinder, fails to complete the required action. No matter what error this underlying service reports, Heat simply reports it back. So in the case of time-out in Heat stack create, you should look at the logs of the underlying services, most importantly the Nova service, to understand the reason for the timeout.
15.9.1.3 Multiple Heat stack create failure #
The Monasca AlarmDefinition resource,
OS::Monasca::AlarmDefinition used for Heat autoscaling,
consists of an optional property
name for
defining the alarm name. In case this optional property being specified in
the Heat template, this name must be unique in the same project of the
system. Otherwise, multiple heat stack create using this heat template will
fail with the following conflict:
| cpu_alarm_low | 5fe0151b-5c6a-4a54-bd64-67405336a740 | HTTPConflict: resources.cpu_alarm_low: An alarm definition already exists for project / tenant: 835d6aeeb36249b88903b25ed3d2e55a named: CPU utilization less than 15 percent | CREATE_FAILED | 2016-07-29T10:28:47 |
This is due to the fact that the Monasca registers the alarm definition name using this name property when it is defined in the Heat template. This name must be unique.
To avoid this problem, if you want to define an alarm name using this property in the template, you must be sure this name is unique within a project in the system. Otherwise, you can leave this optional property undefined in your template. In this case, the system will create an unique alarm name automatically during heat stack create.
15.9.1.4 Unable to Retrieve QOS Policies #
Launching the Orchestration Template Generator may trigger the message:
Unable to retrieve resources Qos Policies. This is a
known upstream
bug. This information message can be ignored.
15.9.2 Troubleshooting Magnum Service #
Troubleshooting scenarios with resolutions for the Magnum service. Magnum Service provides container orchestration engines such as Docker Swarm, Kubernetes, and Apache Mesos available as first class resources. You can use this guide to help with known issues and troubleshooting of Magnum services.
15.9.2.1 Magnum cluster fails to create #
Typically, small size clusters need about 3-5 minutes to stand up. If cluster stand up takes longer, you may proceed with troubleshooting, not waiting for status to turn to CREATE_FAILED after timing out.
Use
heat resource-list -n2to identify which Heat stack resource is stuck in CREATE_IN_PROGRESS.Note
The main Heat stack has nested stacks, one for kubemaster(s) and one for kubeminion(s). These stacks are visible as resources of type OS::Heat::ResourceGroup (in parent stack) and file:///... in nested stack. If any resource remains in CREATE_IN_PROGRESS state within the nested stack, the overall state of the resource will be CREATE_IN_PROGRESS.
$ heat resource-list -n2 22385a42-9e15-49d9-a382-f28acef36810 +-------------------------------+--------------------------------------+--------------------------------------+--------------------+----------------------+------------------------------------------------------------------+ | resource_name | physical_resource_id | resource_type | resource_status | updated_time | stack_name | +-------------------------------+--------------------------------------+--------------------------------------+--------------------+----------------------+------------------------------------------------------------------+ | api_address_floating_switch | 06b2cc0d-77f9-4633-8d96-f51e2db1faf3 | Magnum::FloatingIPAddressSwitcher | CREATE_COMPLETE | 2017-04-10T21:25:10Z | my-cluster-z4aquda2mgpv | . . . | fixed_subnet | d782bdf2-1324-49db-83a8-6a3e04f48bb9 | OS::Neutron::Subnet | CREATE_COMPLETE | 2017-04-10T21:25:11Z | my-cluster-z4aquda2mgpv | | kube_masters | f0d000aa-d7b1-441a-a32b-17125552d3e0 | OS::Heat::ResourceGroup | CREATE_IN_PROGRESS | 2017-04-10T21:25:10Z | my-cluster-z4aquda2mgpv | | 0 | b1ff8e2c-23dc-490e-ac7e-14e9f419cfb6 | file:///opt/s...ates/kubemaster.yaml | CREATE_IN_PROGRESS | 2017-04-10T21:25:41Z | my-cluster-z4aquda2mgpv-kube_masters-utyggcbucbhb | | kube_master | 4d96510e-c202-4c62-8157-c0e3dddff6d5 | OS::Nova::Server | CREATE_IN_PROGRESS | 2017-04-10T21:25:48Z | my-cluster-z4aquda2mgpv-kube_masters-utyggcbucbhb-0-saafd5k7l7im | . . .
If stack creation failed on some native OpenStack resource, like OS::Nova::Server or OS::Neutron::Router, proceed with respective service troubleshooting. This type of error usually does not cause time out, and cluster turns into status CREATE_FAILED quickly. The underlying reason of the failure, reported by Heat, can be checked via the
magnum cluster-showcommand.If stack creation stopped on resource of type OS::Heat::WaitCondition, Heat is not receiving notification from cluster VM about bootstrap sequence completion. Locate corresponding resource of type OS::Nova::Server and use its physical_resource_id to get information about the VM (which should be in status CREATE_COMPLETE)
$ nova show 4d96510e-c202-4c62-8157-c0e3dddff6d5 +--------------------------------------+---------------------------------------------------------------------------------------------------------------+ | Property | Value | +--------------------------------------+---------------------------------------------------------------------------------------------------------------+ | OS-DCF:diskConfig | MANUAL | | OS-EXT-AZ:availability_zone | nova | | OS-EXT-SRV-ATTR:host | comp1 | | OS-EXT-SRV-ATTR:hypervisor_hostname | comp1 | | OS-EXT-SRV-ATTR:instance_name | instance-00000025 | | OS-EXT-STS:power_state | 1 | | OS-EXT-STS:task_state | - | | OS-EXT-STS:vm_state | active | | OS-SRV-USG:launched_at | 2017-04-10T22:10:40.000000 | | OS-SRV-USG:terminated_at | - | | accessIPv4 | | | accessIPv6 | | | config_drive | | | created | 2017-04-10T22:09:53Z | | flavor | m1.small (2) | | hostId | eb101a0293a9c4c3a2d79cee4297ab6969e0f4ddd105f4d207df67d2 | | id | 4d96510e-c202-4c62-8157-c0e3dddff6d5 | | image | fedora-atomic-26-20170723.0.x86_64 (4277115a-f254-46c0-9fb0-fffc45d2fd38) | | key_name | testkey | | metadata | {} | | name | my-zaqshggwge-0-sqhpyez4dig7-kube_master-wc4vv7ta42r6 | | os-extended-volumes:volumes_attached | [{"id": "24012ce2-43dd-42b7-818f-12967cb4eb81"}] | | private network | 10.0.0.14, 172.31.0.6 | | progress | 0 | | security_groups | my-cluster-z7ttt2jvmyqf-secgroup_base-gzcpzsiqkhxx, my-cluster-z7ttt2jvmyqf-secgroup_kube_master-27mzhmkjiv5v | | status | ACTIVE | | tenant_id | 2f5b83ab49d54aaea4b39f5082301d09 | | updated | 2017-04-10T22:10:40Z | | user_id | 7eba6d32db154d4790e1d3877f6056fb | +--------------------------------------+---------------------------------------------------------------------------------------------------------------+Use the floating IP of the master VM to log into first master node. Use the appropriate username below for your VM type. Passwords should not be required as the VMs should have public ssh key installed.
VM Type Username Kubernetes or Swarm on Fedora Atomic fedora Kubernetes on CoreOS core Mesos on Ubuntu ubuntu Useful dianostic commands
Kubernetes cluster on Fedora Atomic
sudo journalctl --system sudo journalctl -u cloud-init.service sudo journalctl -u etcd.service sudo journalctl -u docker.service sudo journalctl -u kube-apiserver.service sudo journalctl -u kubelet.service sudo journalctl -u wc-notify.service
Kubernetes cluster on CoreOS
sudo journalctl --system sudo journalctl -u oem-cloudinit.service sudo journalctl -u etcd2.service sudo journalctl -u containerd.service sudo journalctl -u flanneld.service sudo journalctl -u docker.service sudo journalctl -u kubelet.service sudo journalctl -u wc-notify.service
Swarm cluster on Fedora Atomic
sudo journalctl --system sudo journalctl -u cloud-init.service sudo journalctl -u docker.service sudo journalctl -u swarm-manager.service sudo journalctl -u wc-notify.service
Mesos cluster on Ubuntu
sudo less /var/log/syslog sudo less /var/log/cloud-init.log sudo less /var/log/cloud-init-output.log sudo less /var/log/os-collect-config.log sudo less /var/log/marathon.log sudo less /var/log/mesos-master.log
15.10 Troubleshooting Tools #
Tools to assist with troubleshooting issues in your cloud. Additional troubleshooting information is available at Section 15.1, “General Troubleshooting”.
15.10.1 Retrieving the SOS Report #
The SOS report provides debug level information about your environment to assist in troubleshooting issues. When troubleshooting and debugging issues in your HPE Helion OpenStack environment you can run an ansible playbook that will provide you with a full debug report, referred to as a SOS report. These reports can be sent to the support team when seeking assistance.
15.10.1.1 Retrieving the SOS Report #
Log in to the Cloud Lifecycle Manager.
Run the SOS report ansible playbook:
cd ~/scratch/ansible/next/ardana/ansible ansible-playbook -i hosts/verb_hosts sosreport-run.yml
Retrieve the SOS report tarballs, which will be in the following directories on your Cloud Lifecycle Manager:
/tmp /tmp/sosreport-report-archives/
You can then use these reports to troubleshoot issues further or provide to the support team when you reach out to them.
Warning
The SOS Report may contain sensitive information because service configuration file data is included in the report. Please remove any sensitive information before sending the SOSReport tarball externally.