Operations Guide
- 1 Operations Overview
- 2 Tutorials
- 3 Third-Party Integrations
- 4 Managing Identity
- 5 Managing Compute
- 6 Managing ESX
- 7 Managing Block Storage
- 8 Managing Object Storage
- 9 Managing Networking
- 10 Managing the Dashboard
- 11 Managing Orchestration
- 12 Managing Monitoring, Logging, and Usage Reporting
- 13 System Maintenance
- 14 Backup and Restore
- 15 Troubleshooting Issues
6 Managing ESX
- 6.1 Networking for ESXi Hypervisor (OVSvApp)
- 6.2 Validating the Neutron Installation
- 6.3 Removing a Cluster from the Compute Resource Pool
- 6.4 Removing an ESXi Host from a Cluster
- 6.5 Configuring Debug Logging
- 6.6 Making Scale Configuration Changes
- 6.7 Monitoring vCenter Clusters
- 6.8 Monitoring Integration with OVSvApp Appliance
Information about managing and configuring the ESX service.
6.1 Networking for ESXi Hypervisor (OVSvApp) #
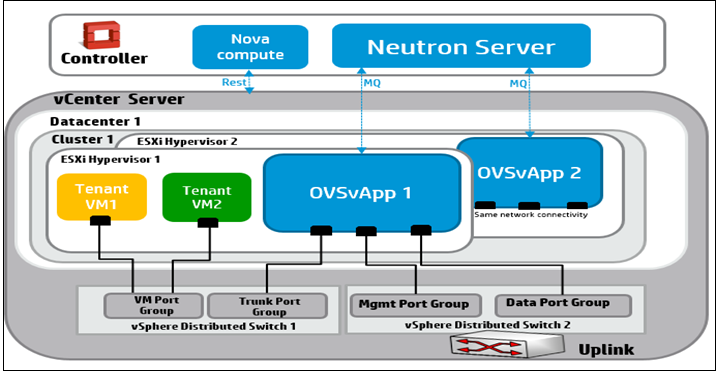
To provide the network as a service for tenant VM's hosted on ESXi Hypervisor, a service VM named OVSvApp VM is deployed on each ESXi Hypervisor within a cluster managed by OpenStack Nova, as shown in the following figure.
The OVSvApp VM runs SLES as a guest operating system, and has Open vSwitch 2.1.0 or above installed. It also runs an agent called OVSvApp agent, which is responsible for dynamically creating the port groups for the tenant VMs and manages OVS bridges, which contain the flows related to security groups and L2 networking.
To facilitate fault tolerance and mitigation of data path loss for tenant
VMs, run the neutron-ovsvapp-agent-monitor
process as part of the neutron-ovsvapp-agent
service, responsible for monitoring the Open vSwitch module within
the OVSvApp VM. It also uses a nginx server to provide the
health status of the Open vSwitch module to the Neutron server for mitigation
actions. There is a mechanism to keep the
neutron-ovsvapp-agent service alive through
a systemd script.
When a OVSvApp Service VM crashes, an agent monitoring mechanism starts a cluster mitigation process. You can mitigate data path traffic loss for VMs on the failed ESX host in that cluster by putting the failed ESX host in the maintenance mode. This, in turn, triggers the vCenter DRS migrates tenant VMs to other ESX hosts within the same cluster. This ensures data path continuity of tenant VMs traffic.
To View Cluster Mitigation
An administrator can view the cluster mitigation status using the following commands.
neutron ovsvapp-mitigated-cluster-listLists all the clusters where at least one round of host mitigation has happened.
Example:
neutron ovsvapp-mitigated-cluster-list
+----------------+--------------+-----------------------+---------------------------+
| vcenter_id     | cluster_id   | being_mitigated       | threshold_reached         |
+----------------+--------------+-----------------------+---------------------------+
| vcenter1       | cluster1     | True                  | False                     |
| vcenter2       | cluster2     | False                 | True                      |
+---------------+------------+-----------------+------------------------------------+
neutron ovsvapp-mitigated-cluster-show --vcenter-id
    <VCENTER_ID> --cluster-id <CLUSTER_ID>
Shows the status of a particular cluster.
Example :
neutron ovsvapp-mitigated-cluster-show --vcenter-id vcenter1 --cluster-id cluster1
+---------------------------+-------------+
| Field                     | Value       |
+---------------------------+-------------+
| being_mitigated           | True        |
| cluster_id                | cluster1    |
| threshold_reached         | False       |
| vcenter_id                | vcenter1    |
+---------------------------+-------------+
There can be instances where a triggered mitigation may not succeed and the neutron server is not informed of such failure (for example, if the selected agent which had to mitigate the host, goes down before finishing the task). In this case, the cluster will be locked. To unlock the cluster for further mitigations, use the update command.
neutron ovsvapp-mitigated-cluster-update --vcenter-id
    <VCENTER_ID> --cluster-id <CLUSTER_ID>
Update the status of a mitigated cluster:
Modify the values of being-mitigated from True to False to unlock the cluster.
Example:
neutron ovsvapp-mitigated-cluster-update --vcenter-id vcenter1 --cluster-id cluster1 --being-mitigated False
Update the threshold value:
Update the threshold-reached value to True, if no further migration is required in the selected cluster.
Example :
neutron ovsvapp-mitigated-cluster-update --vcenter-id vcenter1 --cluster-id cluster1 --being-mitigated False --threshold-reached True
Rest API
curl -i -X GET http://<ip>:9696/v2.0/ovsvapp_mitigated_clusters \
  -H "User-Agent: python-neutronclient" -H "Accept: application/json" -H \
  "X-Auth-Token: <token_id>"
6.1.1 More Information #
For more information on the Networking for ESXi Hypervisor (OVSvApp), see the following references:
VBrownBag session in Vancouver OpenStack Liberty Summit:
https://www.youtube.com/watch?v=icYA_ixhwsM&feature=youtu.be
Wiki Link:
Codebase:
Whitepaper:
https://github.com/hp-networking/ovsvapp/blob/master/OVSvApp_Solution.pdf
6.2 Validating the Neutron Installation #
You can validate that the ESX compute cluster is added to the cloud successfully using the following command:
# neutron agent-list

+------------------+----------------------+-----------------------+-------------------+-------+----------------+---------------------------+
| id               | agent_type           | host                  | availability_zone | alive | admin_state_up | binary                    |
+------------------+----------------------+-----------------------+-------------------+-------+----------------+---------------------------+
| 05ca6ef...999c09 | L3 agent             | doc-cp1-comp0001-mgmt | nova              | :-)   | True           | neutron-l3-agent          |
| 3b9179a...28e2ef | Metadata agent       | doc-cp1-comp0001-mgmt |                   | :-)   | True           | neutron-metadata-agent    |
| 3d756d7...a719a2 | Loadbalancerv2 agent | doc-cp1-comp0001-mgmt |                   | :-)   | True           | neutron-lbaasv2-agent     |
| 4e8f84f...c9c58f | Metadata agent       | doc-cp1-comp0002-mgmt |                   | :-)   | True           | neutron-metadata-agent    |
| 55a5791...c17451 | L3 agent             | doc-cp1-c1-m1-mgmt    | nova              | :-)   | True           | neutron-vpn-agent         |
| 5e3db8f...87f9be | Open vSwitch agent   | doc-cp1-c1-m1-mgmt    |                   | :-)   | True           | neutron-openvswitch-agent |
| 6968d9a...b7b4e9 | L3 agent             | doc-cp1-c1-m2-mgmt    | nova              | :-)   | True           | neutron-vpn-agent         |
| 7b02b20...53a187 | Metadata agent       | doc-cp1-c1-m2-mgmt    |                   | :-)   | True           | neutron-metadata-agent    |
| 8ece188...5c3703 | Open vSwitch agent   | doc-cp1-comp0002-mgmt |                   | :-)   | True           | neutron-openvswitch-agent |
| 8fcb3c7...65119a | Metadata agent       | doc-cp1-c1-m1-mgmt    |                   | :-)   | True           | neutron-metadata-agent    |
| 9f48967...36effe | OVSvApp agent        | doc-cp1-comp0002-mgmt |                   | :-)   | True           | ovsvapp-agent             |
| a2a0b78...026da9 | Open vSwitch agent   | doc-cp1-comp0001-mgmt |                   | :-)   | True           | neutron-openvswitch-agent |
| a2fbd4a...28a1ac | DHCP agent           | doc-cp1-c1-m2-mgmt    | nova              | :-)   | True           | neutron-dhcp-agent        |
| b2428d5...ee60b2 | DHCP agent           | doc-cp1-c1-m1-mgmt    | nova              | :-)   | True           | neutron-dhcp-agent        |
| c0983a6...411524 | Open vSwitch agent   | doc-cp1-c1-m2-mgmt    |                   | :-)   | True           | neutron-openvswitch-agent |
| c32778b...a0fc75 | L3 agent             | doc-cp1-comp0002-mgmt | nova              | :-)   | True           | neutron-l3-agent          |
+------------------+----------------------+-----------------------+-------------------+-------+----------------+---------------------------+
6.3 Removing a Cluster from the Compute Resource Pool #
6.3.1 Prerequisites #
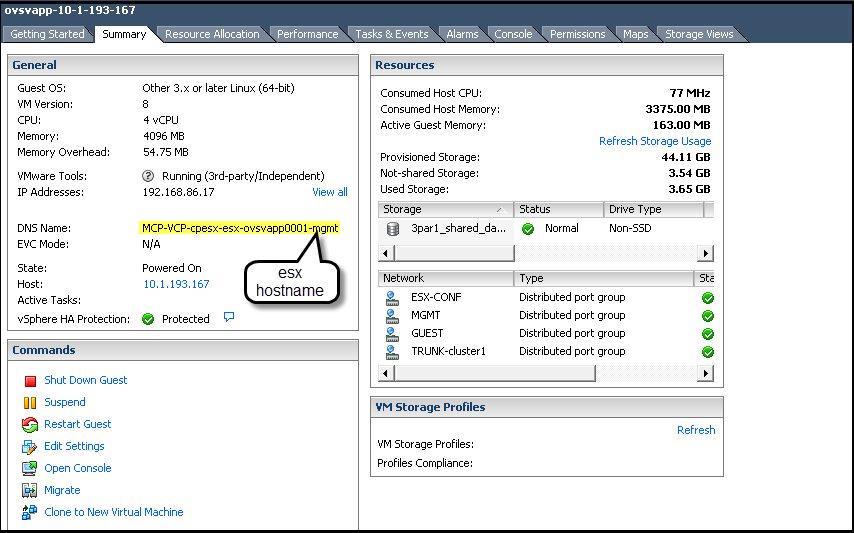
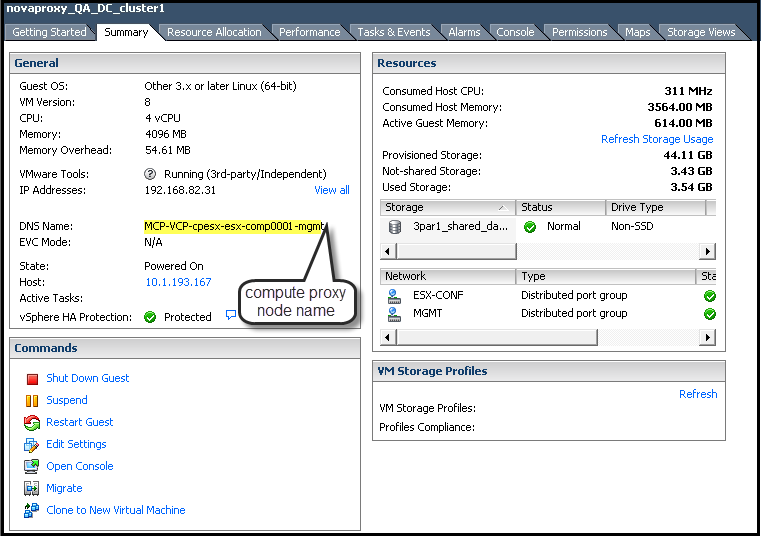
Write down the Hostname and ESXi configuration IP addresses of OVSvAPP VMs of that ESX cluster before deleting the VMs. These IP address and Hostname will be used to cleanup Monasca alarm definitions.
Perform the following steps:
6.3.2 Removing an existing cluster from the compute resource pool #
Perform the following steps to remove an existing cluster from the compute resource pool.
Run the following command to check for the instances launched in that cluster:
# nova list --host <hostname>
+--------------------------------------+------+--------+------------+-------------+------------------+
| ID                                   | Name | Status | Task State | Power State | Networks         |
+--------------------------------------+------+--------+------------+-------------+------------------+
| 80e54965-758b-425e-901b-9ea756576331 | VM1  | ACTIVE | -          | Running     | private=10.0.0.2 |
+--------------------------------------+------+--------+------------+-------------+------------------+
where:
hostname: Specifies hostname of the compute proxy present in that cluster.
Delete all instances spawned in that cluster:
# nova delete <server> [<server ...>]
where:
server: Specifies the name or ID of server (s)
OR
Migrate all instances spawned in that cluster.
# nova migrate <server>
Run the following playbooks for stop the Compute (Nova) and Networking (Neutron) services:
ansible-playbook -i hosts/verb_hosts nova-stop --limit <hostname>;
ansible-playbook -i hosts/verb_hosts neutron-stop --limit <hostname>;
where:
hostname: Specifies hostname of the compute proxy present in that cluster.
6.3.3 Cleanup Monasca Agent for OVSvAPP Service #
Perform the following procedure to cleanup Monasca agents for ovsvapp-agent service.
If Monasca-API is installed on different node, copy the
service.orscfrom Cloud Lifecycle Manager to Monasca API server.scp service.orsc $USER@ardana-cp1-mtrmon-m1-mgmt:
SSH to Monasca API server. You must SSH to each Monasca API server for cleanup.
For example:
ssh ardana-cp1-mtrmon-m1-mgmt
Edit
/etc/monasca/agent/conf.d/host_alive.yamlfile to remove the reference to the OVSvAPP you removed. This requiressudoaccess.sudo vi /etc/monasca/agent/conf.d/host_alive.yaml
A sample of
host_alive.yaml:- alive_test: ping built_by: HostAlive host_name: esx-cp1-esx-ovsvapp0001-mgmt name: esx-cp1-esx-ovsvapp0001-mgmt ping target_hostname: esx-cp1-esx-ovsvapp0001-mgmt
where HOST_NAME and TARGET_HOSTNAME is mentioned at the DNS name field at the vSphere client. (Refer to Section 6.3.1, “Prerequisites”).
After removing the reference on each of the Monasca API servers, restart the monasca-agent on each of those servers by executing the following command.
tux >sudo service openstack-monasca-agent restartWith the OVSvAPP references removed and the monasca-agent restarted, you can delete the corresponding alarm to complete the cleanup process. We recommend using the Monasca CLI which is installed on each of your Monasca API servers by default. Execute the following command from the Monasca API server (for example:
ardana-cp1-mtrmon-mX-mgmt).monasca alarm-list --metric-name host_alive_status --metric-dimensions hostname=<ovsvapp deleted>
For example: You can execute the following command to get the alarm ID, if the OVSvAPP appears as a preceding example.
monasca alarm-list --metric-name host_alive_status --metric-dimensions hostname=MCP-VCP-cpesx-esx-ovsvapp0001-mgmt
+--------------------------------------+--------------------------------------+-----------------------+-------------------+-------------------------------------------+----------+-------+-----------------+------+--------------------------+--------------------------+--------------------------+
| id                                   | alarm_definition_id                  | alarm_definition_name | metric_name       | metric_dimensions                         | severity | state | lifecycle_state | link | state_updated_timestamp  | updated_timestamp        | created_timestamp        |
+--------------------------------------+--------------------------------------+-----------------------+-------------------+-------------------------------------------+----------+-------+-----------------+------+--------------------------+--------------------------+--------------------------+
| cfc6bfa4-2485-4319-b1e5-0107886f4270 | cca96c53-a927-4b0a-9bf3-cb21d28216f3 | Host Status           | host_alive_status | service: system                           | HIGH     | OK    | None            | None | 2016-10-27T06:33:04.256Z | 2016-10-27T06:33:04.256Z | 2016-10-23T13:41:57.258Z |
|                                      |                                      |                       |                   | cloud_name: entry-scale-kvm-esx-mml       |          |       |                 |      |                          |                          |                          |
|                                      |                                      |                       |                   | test_type: ping                           |          |       |                 |      |                          |                          |                          |
|                                      |                                      |                       |                   | hostname: ardana-cp1-esx-ovsvapp0001-mgmt |          |       |                 |      |                          |                          |                          |
|                                      |                                      |                       |                   | control_plane: control-plane-1            |          |       |                 |      |                          |                          |                          |
|                                      |                                      |                       |                   | cluster: mtrmon                           |          |       |                 |      |                          |                          |                          |
|                                      |                                      |                       |                   | observer_host: ardana-cp1-mtrmon-m1-mgmt  |          |       |                 |      |                          |                          |                          |
|                                      |                                      |                       | host_alive_status | service: system                           |          |       |                 |      |                          |                          |                          |
|                                      |                                      |                       |                   | cloud_name: entry-scale-kvm-esx-mml       |          |       |                 |      |                          |                          |                          |
|                                      |                                      |                       |                   | test_type: ping                           |          |       |                 |      |                          |                          |                          |
|                                      |                                      |                       |                   | hostname: ardana-cp1-esx-ovsvapp0001-mgmt |          |       |                 |      |                          |                          |                          |
|                                      |                                      |                       |                   | control_plane: control-plane-1            |          |       |                 |      |                          |                          |                          |
|                                      |                                      |                       |                   | cluster: mtrmon                           |          |       |                 |      |                          |                          |                          |
|                                      |                                      |                       |                   | observer_host: ardana-cp1-mtrmon-m3-mgmt  |          |       |                 |      |                          |                          |                          |
|                                      |                                      |                       | host_alive_status | service: system                           |          |       |                 |      |                          |                          |                          |
|                                      |                                      |                       |                   | cloud_name: entry-scale-kvm-esx-mml       |          |       |                 |      |                          |                          |                          |
|                                      |                                      |                       |                   | test_type: ping                           |          |       |                 |      |                          |                          |                          |
|                                      |                                      |                       |                   | hostname: ardana-cp1-esx-ovsvapp0001-mgmt |          |       |                 |      |                          |                          |                          |
|                                      |                                      |                       |                   | control_plane: control-plane-1            |          |       |                 |      |                          |                          |                          |
|                                      |                                      |                       |                   | cluster: mtrmon                           |          |       |                 |      |                          |                          |                          |
|                                      |                                      |                       |                   | observer_host: ardana-cp1-mtrmon-m2-mgmt  |          |       |                 |      |                          |                          |                          |
+--------------------------------------+--------------------------------------+-----------------------+-------------------+-------------------------------------------+----------+-------+-----------------+------+--------------------------+--------------------------+--------------------------+
Delete the Monasca alaram.
monasca alarm-delete <alarm ID>
For example:
monasca alarm-delete cfc6bfa4-2485-4319-b1e5-0107886f4270Successfully deleted alarm
After deleting the alarms and updating the monasca-agent configuration, those alarms will be removed from the Operations Console UI. You can login to Operations Console and view the status.
6.3.4 Removing the Compute Proxy from Monitoring #
Once you have removed the Compute proxy, the alarms against them will still trigger. Therefore to resolve this, you must perform the following steps.
SSH to Monasca API server. You must SSH to each Monasca API server for cleanup.
For example:
ssh ardana-cp1-mtrmon-m1-mgmt
Edit
/etc/monasca/agent/conf.d/host_alive.yamlfile to remove the reference to the Compute proxy you removed. This requiressudoaccess.sudo vi /etc/monasca/agent/conf.d/host_alive.yaml
A sample of
host_alive.yamlfile.- alive_test: ping built_by: HostAlive host_name: MCP-VCP-cpesx-esx-comp0001-mgmt name: MCP-VCP-cpesx-esx-comp0001-mgmt ping
Once you have removed the references on each of your Monasca API servers, execute the following command to restart the monasca-agent on each of those servers.
tux >sudo service openstack-monasca-agent restartWith the Compute proxy references removed and the monasca-agent restarted, delete the corresponding alarm to complete this process. complete the cleanup process. We recommend using the Monasca CLI which is installed on each of your Monasca API servers by default.
monasca alarm-list --metric-dimensions hostname= <compute node deleted>
For example: You can execute the following command to get the alarm ID, if the Compute proxy appears as a preceding example.
monasca alarm-list --metric-dimensions hostname=ardana-cp1-comp0001-mgmt
Delete the Monasca alarm
monasca alarm-delete <alarm ID>
6.3.5 Cleaning the Monasca Alarms Related to ESX Proxy and vCenter Cluster #
Perform the following procedure:
Using the ESX proxy hostname, execute the following command to list all alarms.
monasca alarm-list --metric-dimensions hostname=COMPUTE_NODE_DELETED
where COMPUTE_NODE_DELETED - hostname is taken from the vSphere client (refer to Section 6.3.1, “Prerequisites”).
Note
Ensure to make a note of all the alarm IDs that is displayed after executing the preceding command.
For example, the compute proxy hostname is
MCP-VCP-cpesx-esx-comp0001-mgmt.monasca alarm-list --metric-dimensions hostname=MCP-VCP-cpesx-esx-comp0001-mgmt ardana@R28N6340-701-cp1-c1-m1-mgmt:~$ monasca alarm-list --metric-dimensions hostname=R28N6340-701-cp1-esx-comp0001-mgmt +--------------------------------------+--------------------------------------+------------------------+------------------------+--------------------------------------------------+----------+-------+-----------------+------+--------------------------+--------------------------+--------------------------+ | id | alarm_definition_id | alarm_definition_name | metric_name | metric_dimensions | severity | state | lifecycle_state | link | state_updated_timestamp | updated_timestamp | created_timestamp | +--------------------------------------+--------------------------------------+------------------------+------------------------+--------------------------------------------------+----------+-------+-----------------+------+--------------------------+--------------------------+--------------------------+ | 02342bcb-da81-40db-a262-09539523c482 | 3e302297-0a36-4f0e-a1bd-03402b937a4e | HTTP Status | http_status | service: compute | HIGH | OK | None | None | 2016-11-11T06:58:11.717Z | 2016-11-11T06:58:11.717Z | 2016-11-10T08:55:45.136Z | | | | | | cloud_name: entry-scale-esx-kvm | | | | | | | | | | | | | url: https://10.244.209.9:8774 | | | | | | | | | | | | | hostname: R28N6340-701-cp1-esx-comp0001-mgmt | | | | | | | | | | | | | component: nova-api | | | | | | | | | | | | | control_plane: control-plane-1 | | | | | | | | | | | | | cluster: esx-compute | | | | | | | | | 04cb36ce-0c7c-4b4c-9ebc-c4011e2f6c0a | 15c593de-fa54-4803-bd71-afab95b980a4 | Disk Usage | disk.space_used_perc | mount_point: /proc/sys/fs/binfmt_misc | HIGH | OK | None | None | 2016-11-10T08:52:52.886Z | 2016-11-10T08:52:52.886Z | 2016-11-10T08:51:29.197Z | | | | | | service: system | | | | | | | | | | | | | cloud_name: entry-scale-esx-kvm | | | | | | | | | | | | | hostname: R28N6340-701-cp1-esx-comp0001-mgmt | | | | | | | | | | | | | control_plane: control-plane-1 | | | | | | | | | | | | | cluster: esx-compute | | | | | | | | | | | | | device: systemd-1 | | | | | | | | +--------------------------------------+--------------------------------------+------------------------+------------------------+--------------------------------------------------+----------+-------+-----------------+------+--------------------------+--------------------------+--------------------------+
Delete the alarm using the alarm IDs.
monasca alarm-delete <alarm ID>
This step has to be performed for all alarm IDs listed from the preceding step (Step 1).
For Example:
monasca alarm-delete 1cc219b1-ce4d-476b-80c2-0cafa53e1a12
6.4 Removing an ESXi Host from a Cluster #
This topic describes how to remove an existing ESXi host from a cluster and clean up of services for OVSvAPP VM.
Note
Before performing this procedure, wait until VCenter migrates all the tenant VMs to other active hosts in that same cluster.
6.4.1 Prerequisite #
Write down the Hostname and ESXi configuration IP addresses of OVSvAPP VMs of that ESX cluster before deleting the VMs. These IP address and Hostname will be used to clean up Monasca alarm definitions.
Login to vSphere client.
Select the ovsvapp node running on the ESXi host and click Summary tab.
6.4.2 Procedure #
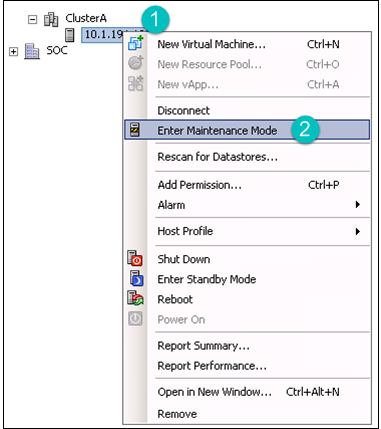
Right-click and put the host in the maintenance mode. This will automatically migrate all the tenant VMs except OVSvApp.
Cancel the maintenance mode task.
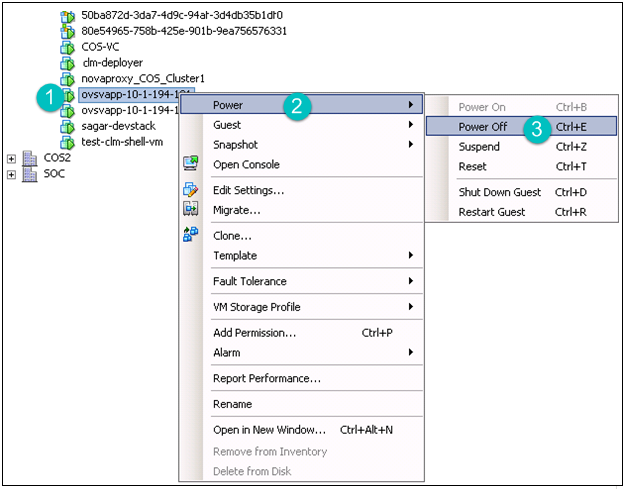
Right-click the ovsvapp VM (IP Address) node, select Power, and then click Power Off.
Right-click the node and then click Delete from Disk.
Right-click the Host, and then click Enter Maintenance Mode.
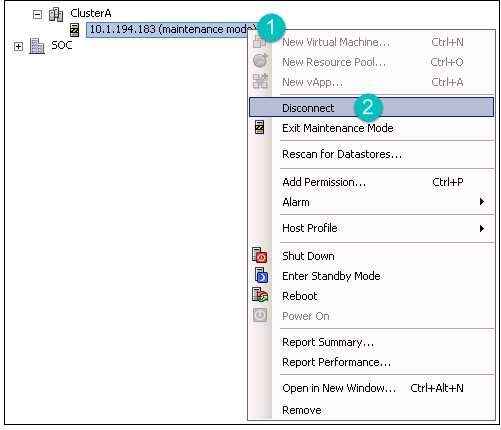
Disconnect the VM. Right-click the VM, and then click Disconnect.
The ESXi node is removed from the vCenter.
6.4.3 Clean up Neutron Agent for OVSvAPP Service #
After removing ESXi node from a vCenter, perform the following procedure to clean up neutron agents for ovsvapp-agent service.
Login to Cloud Lifecycle Manager.
Source the credentials.
source service.osrc
Execute the following command.
neutron agent-list | grep <OVSvapp hostname>
For example:
neutron agent-list | grep MCP-VCP-cpesx-esx-ovsvapp0001-mgmt
| 92ca8ada-d89b-43f9-b941-3e0cd2b51e49 | OVSvApp Agent      | MCP-VCP-cpesx-esx-ovsvapp0001-mgmt |                   | :-)   | True           | ovsvapp-agent             |
Delete the OVSvAPP agent.
neutron agent-delete <Agent -ID>
For example:
neutron agent-delete 92ca8ada-d89b-43f9-b941-3e0cd2b51e49
If you have more than one host, perform the preceding procedure for all the hosts.
6.4.4 Clean up Monasca Agent for OVSvAPP Service #
Perform the following procedure to clean up Monasca agents for ovsvapp-agent service.
If Monasca-API is installed on different node, copy the
service.orscfrom Cloud Lifecycle Manager to Monasca API server.scp service.orsc $USER@ardana-cp1-mtrmon-m1-mgmt:
SSH to Monasca API server. You must SSH to each Monasca API server for cleanup.
For example:
ssh ardana-cp1-mtrmon-m1-mgmt
Edit
/etc/monasca/agent/conf.d/host_alive.yamlfile to remove the reference to the OVSvAPP you removed. This requiressudoaccess.sudo vi /etc/monasca/agent/conf.d/host_alive.yaml
A sample of
host_alive.yaml:- alive_test: ping built_by: HostAlive host_name: MCP-VCP-cpesx-esx-ovsvapp0001-mgmt name: MCP-VCP-cpesx-esx-ovsvapp0001-mgmt ping target_hostname: MCP-VCP-cpesx-esx-ovsvapp0001-mgmt
where
host_nameandtarget_hostnameare mentioned at the DNS name field at the vSphere client. (Refer to Section 6.4.1, “Prerequisite”).After removing the reference on each of the Monasca API servers, restart the monasca-agent on each of those servers by executing the following command.
tux >sudo service openstack-monasca-agent restartWith the OVSvAPP references removed and the monasca-agent restarted, you can delete the corresponding alarm to complete the cleanup process. We recommend using the Monasca CLI which is installed on each of your Monasca API servers by default. Execute the following command from the Monasca API server (for example:
ardana-cp1-mtrmon-mX-mgmt).monasca alarm-list --metric-name host_alive_status --metric-dimensions hostname=<ovsvapp deleted>
For example: You can execute the following command to get the alarm ID, if the OVSvAPP appears as a preceding example.
monasca alarm-list --metric-name host_alive_status --metric-dimensions hostname=MCP-VCP-cpesx-esx-ovsvapp0001-mgmt
+--------------------------------------+--------------------------------------+-----------------------+-------------------+-------------------------------------------+----------+-------+-----------------+------+--------------------------+--------------------------+--------------------------+
| id                                   | alarm_definition_id                  | alarm_definition_name | metric_name       | metric_dimensions                         | severity | state | lifecycle_state | link | state_updated_timestamp  | updated_timestamp        | created_timestamp        |
+--------------------------------------+--------------------------------------+-----------------------+-------------------+-------------------------------------------+----------+-------+-----------------+------+--------------------------+--------------------------+--------------------------+
| cfc6bfa4-2485-4319-b1e5-0107886f4270 | cca96c53-a927-4b0a-9bf3-cb21d28216f3 | Host Status           | host_alive_status | service: system                           | HIGH     | OK    | None            | None | 2016-10-27T06:33:04.256Z | 2016-10-27T06:33:04.256Z | 2016-10-23T13:41:57.258Z |
|                                      |                                      |                       |                   | cloud_name: entry-scale-kvm-esx-mml       |          |       |                 |      |                          |                          |                          |
|                                      |                                      |                       |                   | test_type: ping                           |          |       |                 |      |                          |                          |                          |
|                                      |                                      |                       |                   | hostname: ardana-cp1-esx-ovsvapp0001-mgmt |          |       |                 |      |                          |                          |                          |
|                                      |                                      |                       |                   | control_plane: control-plane-1            |          |       |                 |      |                          |                          |                          |
|                                      |                                      |                       |                   | cluster: mtrmon                           |          |       |                 |      |                          |                          |                          |
|                                      |                                      |                       |                   | observer_host: ardana-cp1-mtrmon-m1-mgmt  |          |       |                 |      |                          |                          |                          |
|                                      |                                      |                       | host_alive_status | service: system                           |          |       |                 |      |                          |                          |                          |
|                                      |                                      |                       |                   | cloud_name: entry-scale-kvm-esx-mml       |          |       |                 |      |                          |                          |                          |
|                                      |                                      |                       |                   | test_type: ping                           |          |       |                 |      |                          |                          |                          |
|                                      |                                      |                       |                   | hostname: ardana-cp1-esx-ovsvapp0001-mgmt |          |       |                 |      |                          |                          |                          |
|                                      |                                      |                       |                   | control_plane: control-plane-1            |          |       |                 |      |                          |                          |                          |
|                                      |                                      |                       |                   | cluster: mtrmon                           |          |       |                 |      |                          |                          |                          |
|                                      |                                      |                       |                   | observer_host: ardana-cp1-mtrmon-m3-mgmt  |          |       |                 |      |                          |                          |                          |
|                                      |                                      |                       | host_alive_status | service: system                           |          |       |                 |      |                          |                          |                          |
|                                      |                                      |                       |                   | cloud_name: entry-scale-kvm-esx-mml       |          |       |                 |      |                          |                          |                          |
|                                      |                                      |                       |                   | test_type: ping                           |          |       |                 |      |                          |                          |                          |
|                                      |                                      |                       |                   | hostname: ardana-cp1-esx-ovsvapp0001-mgmt |          |       |                 |      |                          |                          |                          |
|                                      |                                      |                       |                   | control_plane: control-plane-1            |          |       |                 |      |                          |                          |                          |
|                                      |                                      |                       |                   | cluster: mtrmon                           |          |       |                 |      |                          |                          |                          |
|                                      |                                      |                       |                   | observer_host: ardana-cp1-mtrmon-m2-mgmt  |          |       |                 |      |                          |                          |                          |
+--------------------------------------+--------------------------------------+-----------------------+-------------------+-------------------------------------------+----------+-------+-----------------+------+--------------------------+--------------------------+--------------------------+
Delete the Monasca alaram.
monasca alarm-delete <alarm ID>
For example:
monasca alarm-delete cfc6bfa4-2485-4319-b1e5-0107886f4270Successfully deleted alarm
After deleting the alarms and updating the monasca-agent configuration, those alarms will be removed from the Operations Console UI. You can login to Operations Console and view the status.
6.4.5 Clean up the entries of OVSvAPP VM from /etc/host #
Perform the following procedure to clean up the entries of OVSvAPP VM from
/etc/host.
Login to Cloud Lifecycle Manager.
Edit
/etc/host.vi /etc/host
For example:
MCP-VCP-cpesx-esx-ovsvapp0001-mgmtVM is present in the/etc/host.192.168.86.17 MCP-VCP-cpesx-esx-ovsvapp0001-mgmt
Delete the OVSvAPP entries from
/etc/host.
6.4.6 Remove the OVSVAPP VM from the servers.yml and pass_through.yml files and run the Configuration Processor #
Complete these steps from the Cloud Lifecycle Manager to remove the OVSvAPP VM:
Log in to the Cloud Lifecycle Manager
Edit
servers.ymlfile to remove references to the OVSvAPP VM(s) you want to remove:~/openstack/my_cloud/definition/data/servers.yml
For example:
- ip-addr:192.168.86.17
  server-group: AZ1    role:
  OVSVAPP-ROLE    id:
  6afaa903398c8fc6425e4d066edf4da1a0f04388
Edit
~/openstack/my_cloud/definition/data/pass_through.ymlfile to remove the OVSvAPP VM references using the server-id above section to find the references.- data: vmware: vcenter_cluster: Clust1 cluster_dvs_mapping: 'DC1/host/Clust1:TRUNK-DVS-Clust1' esx_hostname: MCP-VCP-cpesx-esx-ovsvapp0001-mgmt vcenter_id: 0997E2ED9-5E4F-49EA-97E6-E2706345BAB2 id: 6afaa903398c8fc6425e4d066edf4da1a0f04388
Commit the changes to git:
git commit -a -m "Remove ESXi host <name>"
Run the configuration processor. You may want to use the
remove_deleted_serversandfree_unused_addressesswitches to free up the resources when running the configuration processor. See Book “Planning an Installation with Cloud Lifecycle Manager”, Chapter 7 “Other Topics”, Section 7.3 “Persisted Data” for more details.cd ~/openstack/ardana/ansible ansible-playbook -i hosts/localhost config-processor-run.yml -e remove_deleted_servers="y" -e free_unused_addresses="y"
Update your deployment directory:
cd ~/openstack/ardana/ansible
ansible-playbook -i hosts/localhost ready-deployment.yml
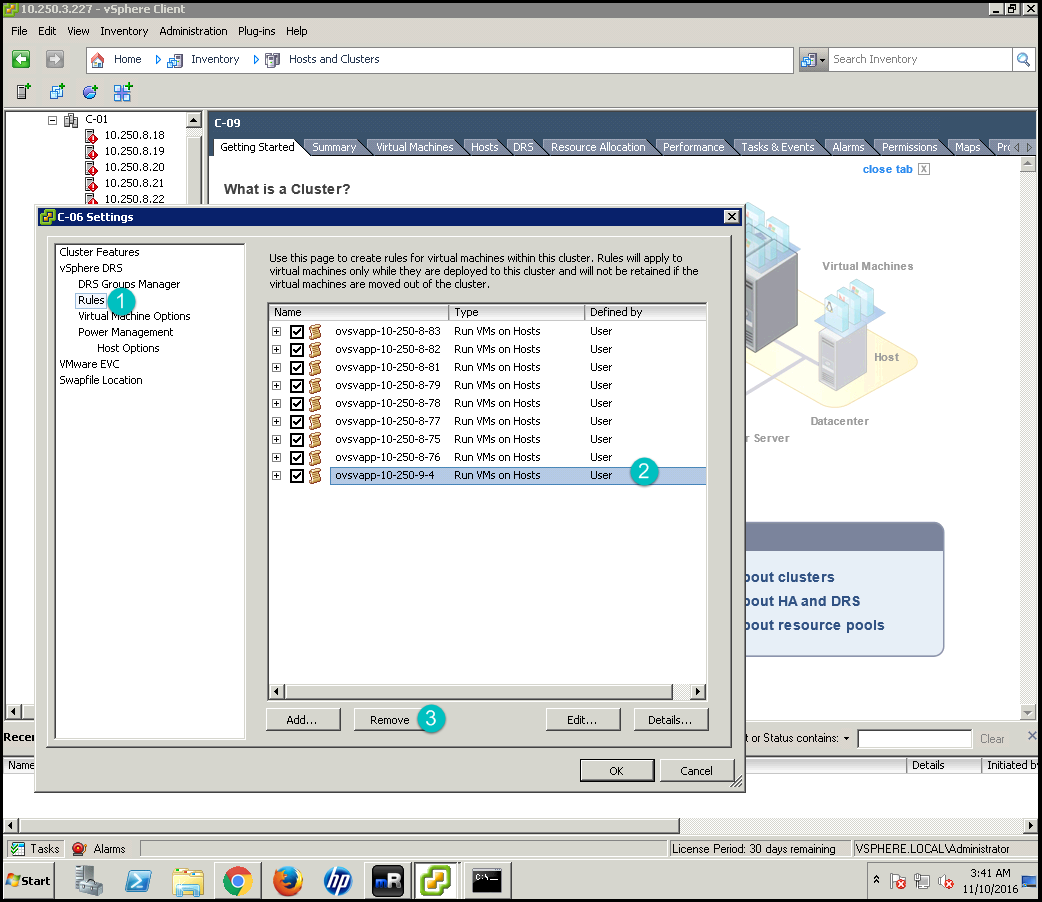
6.4.7 Remove Distributed Resource Scheduler (DRS) Rules #
Perform the following procedure to remove DRS rules, which is added by OVSvAPP installer to ensure that OVSvAPP does not get migrated to other hosts.
Login to vCenter.
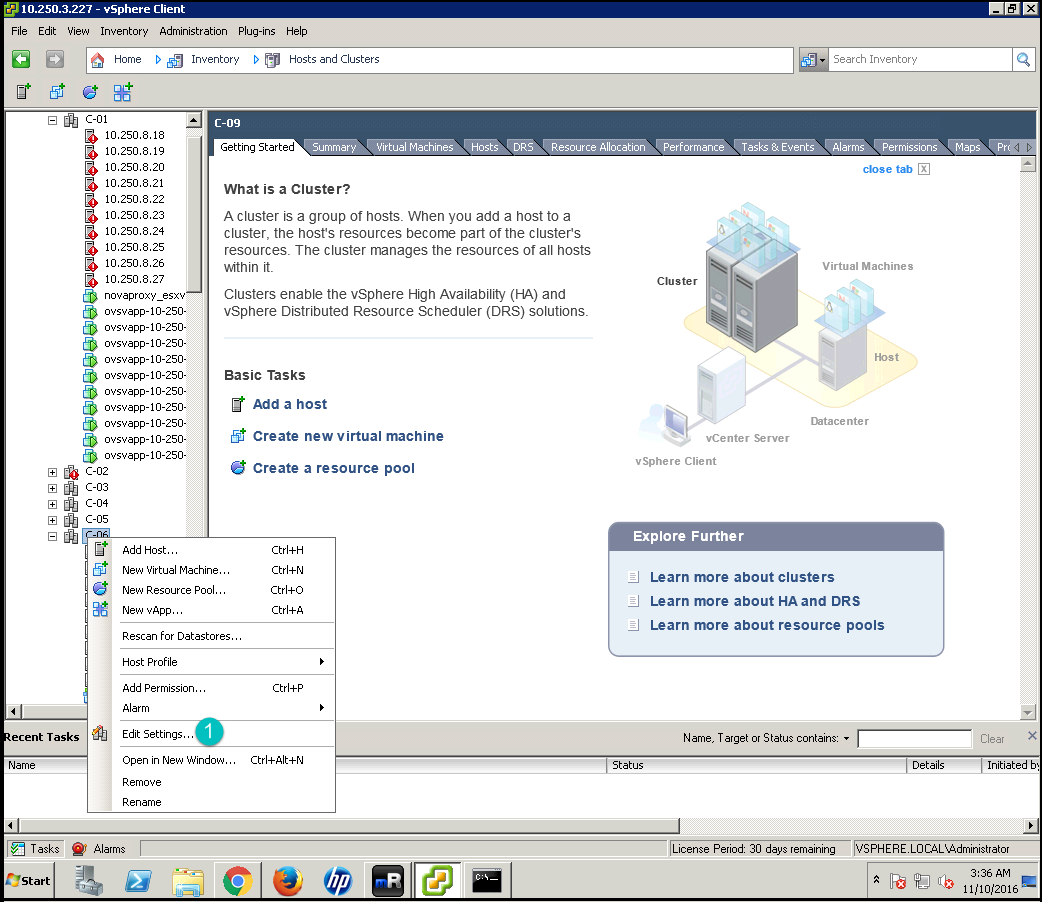
Right click on cluster and select Edit settings.
A cluster settings page appears.
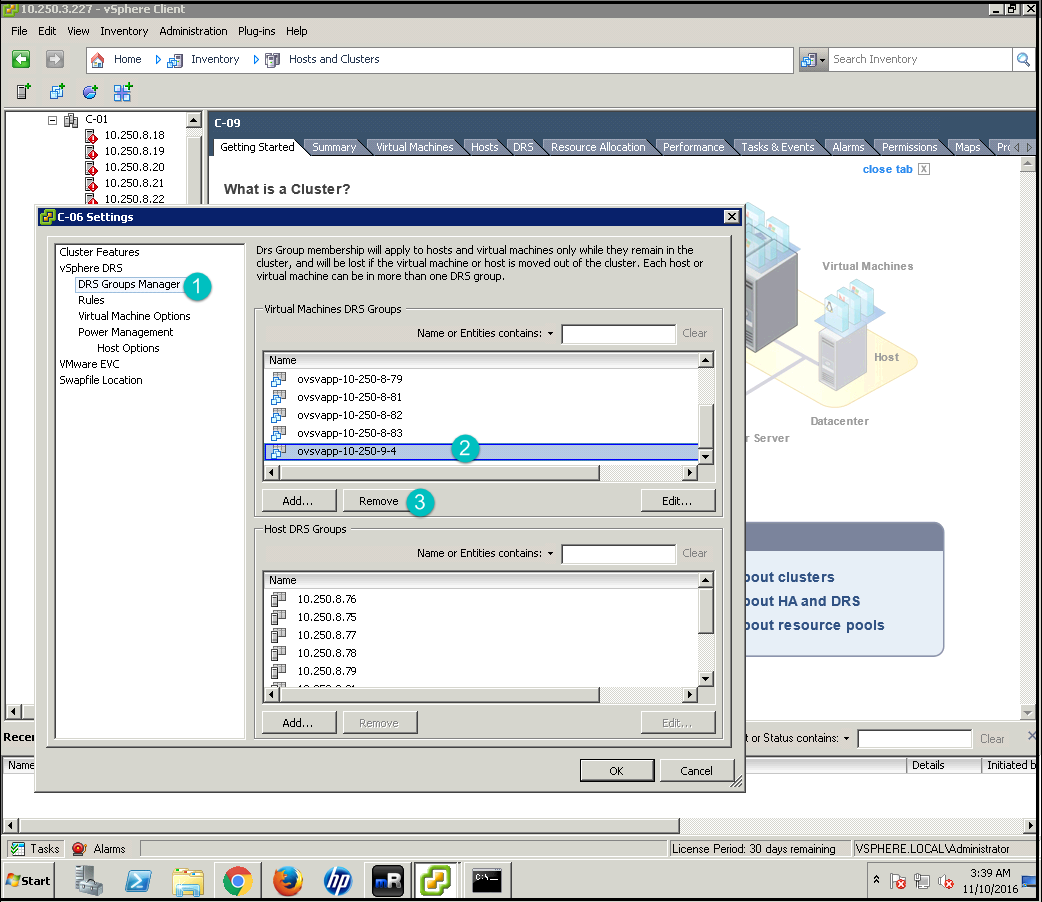
Click DRS Groups Manager on the left hand side of the pop-up box. Select the group which is created for deleted OVSvAPP and click Remove.
Click Rules on the left hand side of the pop-up box and select the checkbox for deleted OVSvAPP and click Remove.
Click OK.
6.5 Configuring Debug Logging #
6.5.1 To Modify the OVSVAPP VM Log Level #
To change the OVSVAPP log level to DEBUG, do the following:
Log in to the Cloud Lifecycle Manager.
Edit the file below:
~/openstack/ardana/ansible/roles/neutron-common/templates/ovsvapp-agent-logging.conf.j2
Set the logging level value of the
logger_rootsection toDEBUG, like this:[logger_root] qualname: root handlers: watchedfile, logstash level: DEBUG
Commit your configuration to the Git repository (Book “Installing with Cloud Lifecycle Manager”, Chapter 10 “Using Git for Configuration Management”), as follows:
cd ~/openstack/ardana/ansible
git add -A
git commit -m "My config or other commit message"
Run the configuration processor:
cd ~/openstack/ardana/ansible
ansible-playbook -i hosts/localhost config-processor-run.yml
Update your deployment directory:
cd ~/openstack/ardana/ansible
ansible-playbook -i hosts/localhost ready-deployment.yml
Deploy your changes:
cd ~/scratch/ansible/next/hos/ansible
ansible-playbook -i hosts/verb_hosts neutron-reconfigure.yml
6.5.2 To Enable OVSVAPP Service for Centralized Logging #
To enable OVSVAPP Service for centralized logging:
Log in to the Cloud Lifecycle Manager.
Edit the file below:
~/openstack/my_cloud/config/logging/vars/neutron-ovsvapp-clr.yml
Set the value of
centralized_loggingto true as shown in the following sample:logr_services: neutron-ovsvapp: logging_options: - centralized_logging: enabled: true format: json ...Commit your configuration to the Git repository (Book “Installing with Cloud Lifecycle Manager”, Chapter 10 “Using Git for Configuration Management”), as follows:
cd ~/openstack/ardana/ansible
git add -A
git commit -m "My config or other commit message"
Run the configuration processor:
cd ~/openstack/ardana/ansible
ansible-playbook -i hosts/localhost config-processor-run.yml
Update your deployment directory:
cd ~/openstack/ardana/ansible
ansible-playbook -i hosts/localhost ready-deployment.yml
Deploy your changes, specifying the hostname for your OVSAPP host:
cd ~/scratch/ansible/next/ardana/ansible
ansible-playbook -i hosts/verb_hosts neutron-reconfigure.yml --limit <hostname>
The hostname of the node can be found in the list generated from the output of the following command:
grep hostname ~/openstack/my_cloud/info/server_info.yml
6.6 Making Scale Configuration Changes #
This procedure describes how to make the recommended configuration changes to achieve 8,000 virtual machine instances.
Note
In a scale environment for ESX computes, the configuration of vCenter Proxy VM has to be increased to 8 vCPUs and 16 GB RAM. By default it is 4 vCPUs and 4 GB RAM.
Change the directory. The
nova.conf.j2file is present in following directories:cd ~/openstack/ardana/ansible/roles/nova-common/templates
Edit the DEFAULT section in the
nova.conf.j2file as below:[DEFAULT] rpc_responce_timeout = 180 server_down_time = 300 report_interval = 30
Commit your configuration:
cd ~/openstack/ardana/ansible
git add -A
git commit -m "<commit message>"
Prepare your environment for deployment:
ansible-playbook -i hosts/localhost ready-deployment.yml;
cd ~/scratch/ansible/next/ardana/ansible;
Execute the
nova-reconfigureplaybook:ansible-playbook -i hosts/verb_hosts nova-reconfigure.yml
6.7 Monitoring vCenter Clusters #
Remote monitoring of activated ESX cluster is enabled through vCenter Plugin of Monasca. The Monasca-agent running in each ESX Compute proxy node is configured with the vcenter plugin, to monitor the cluster.
Alarm definitions are created with the default threshold values and whenever the threshold limit breaches respective alarms (OK/ALARM/UNDETERMINED) are generated.
The configuration file details is given below:
init_config: {}
instances:
  - vcenter_ip: <vcenter-ip>
      username: <vcenter-username>
      password: <center-password>
      clusters: <[cluster list]>
Metrics List of metrics posted to monasca by vCenter Plugin are listed below:
vcenter.cpu.total_mhz
vcenter.cpu.used_mhz
vcenter.cpu.used_perc
vcenter.cpu.total_logical_cores
vcenter.mem.total_mb
vcenter.mem.used_mb
vcenter.mem.used_perc
vcenter.disk.total_space_mb
vcenter.disk.total_used_space_mb
vcenter.disk.total_used_space_perc
monasca measurement-list --dimensions esx_cluster_id=domain-c7.D99502A9-63A8-41A2-B3C3-D8E31B591224 vcenter.disk.total_used_space_mb 2016-08-30T11:20:08
+----------------------------------------------+----------------------------------------------------------------------------------------------+-----------------------------------+------------------+-----------------+
| name                                         | dimensions                                                                                   | timestamp                         | value            | value_meta      |
+----------------------------------------------+----------------------------------------------------------------------------------------------+-----------------------------------+------------------+-----------------+
| vcenter.disk.total_used_space_mb             | vcenter_ip: 10.1.200.91                                                                      | 2016-08-30T11:20:20.703Z          | 100371.000       |                 |
|                                              | esx_cluster_id: domain-c7.D99502A9-63A8-41A2-B3C3-D8E31B591224                               | 2016-08-30T11:20:50.727Z          | 100371.000       |                 |
|                                              | hostname: MCP-VCP-cpesx-esx-comp0001-mgmt                                                    | 2016-08-30T11:21:20.707Z          | 100371.000       |                 |
|                                              |                                                                                              | 2016-08-30T11:21:50.700Z          | 100371.000       |                 |
|                                              |                                                                                              | 2016-08-30T11:22:20.700Z          | 100371.000       |                 |
|                                              |                                                                                              | 2016-08-30T11:22:50.700Z          | 100371.000       |                 |
|                                              |                                                                                              | 2016-08-30T11:23:20.620Z          | 100371.000       |                 |
+----------------------------------------------+-----------------------------------------------------------------------------------------------+-----------------------------------+------------------+-----------------+
Dimensions
Each metric will have the dimension as below
- vcenter_ip
FQDN/IP Address of the registered vCenter
- server esx_cluster_id
clusterName.vCenter-id, as seen in the nova hypervisor-list
- hostname
ESX compute proxy name
Alarms
Alarms are created for monitoring cpu, memory and disk usages for each activated clusters. The alarm definitions details are
| Name | Expression | Severity | Match_by |
|---|---|---|---|
| ESX cluster CPU Usage | avg(vcenter.cpu.used_perc) > 90 times 3 | High | esx_cluster_id |
| ESX cluster Memory Usage | avg(vcenter.mem.used_perc) > 90 times 3 | High | esx_cluster_id |
| ESX cluster Disk Usage | vcenter.disk.total_used_space_perc > 90 | High | esx_cluster_id |
6.8 Monitoring Integration with OVSvApp Appliance #
6.8.1 Processes Monitored with Monasca Agent #
Using the Monasca agent, the following services are monitored on the OVSvApp appliance:
Neutron_ovsvapp_agent service - This is the Neutron agent which runs in the appliance which will help enable networking for the tenant virtual machines.
Openvswitch - This service is used by the neutron_ovsvapp_agent service for enabling the datapath and security for the tenant virtual machines.
Ovsdb-server - This service is used by the neutron_ovsvapp_agent service.
If any of the above three processes fail to run on the OVSvApp appliance it will lead to network disruption for the tenant virtual machines. This is why they are monitored.
The monasca-agent periodically reports the status of these processes and metrics data ('load' - cpu.load_avg_1min, 'process' - process.pid_count, 'memory' - mem.usable_perc, 'disk' - disk.space_used_perc, 'cpu' - cpu.idle_perc for examples) to the Monasca server.
6.8.2 How It Works #
Once the vApp is configured and up, the monasca-agent will attempt to register with the Monasca server. After successful registration, the monitoring begins on the processes listed above and you will be able to see status updates on the server side.
The monasca-agent monitors the processes at the system level so, in the case of failures of any of the configured processes, updates should be seen immediately from Monasca.
To check the events from the server side, log into the Operations Console. For more details on how to use the Operations Console, see Book “User Guide”, Chapter 1 “Using the Operations Console”, Section 1.1 “Operations Console Overview”.

