11 Using Trento Web #
The left sidebar in the Trento Web contains the following entries:
Dashboard Determine at a glance the health status of your SAP environment.
Hosts Overview of all registered hosts running the Trento Agent.
Clusters Overview of all discovered Pacemaker clusters.
SAP Systems Overview of all discovered SAP Systems; identified by the corresponding system IDs.
HANA Databases Overview of all discovered SAP HANA databases; identified by the corresponding system IDs.
Checks catalog Overview of the catalog of configuration checks that Trento may perform on the different targets (hosts or clusters), cluster types (HANA scale up, HANA scale out or ASCS/ERS) and supported platforms (Azure, AWS, GCP, Nutanix, on-premises/KVM or VMware).
Settings Allows you to modify user-defined settings.
About Shows the current server version, a link to the GitHub repository of the Trento Web component, and the number of registered SUSE Linux Enterprise Server for SAP applications subscriptions that has been discovered.
11.1 Getting the global health state #
The dashboard allows you to determine at a glance the health status of your SAP environment. It is the main page of the Trento Web, and you can always switch to it by clicking on Dashboard in the left sidebar.
The health status of a registered SAP system is the sum of its health status at three different layers representing the SAP architecture:
Hosts Reflects the heartbeat of the Trento Agent and the tuning status returned by saptune (where applicable).
Pacemaker Clusters The status based on the running status of the cluster and the results of the configuration checks.
Database Collects the status of the HANA instances as returned by
sapcontrol.Application instances Summarizes the status of the application instances as returned by
sapcontrol.
In addition to the operating system layer, there is also information about the health status of the HA components, where they exist:
Database cluster The status based on the running status of the database cluster and the results of the selected configuration checks.
Application cluster The status based on the running status of the ASCS/ERS cluster and, eventually, the results of the selected configuration checks.
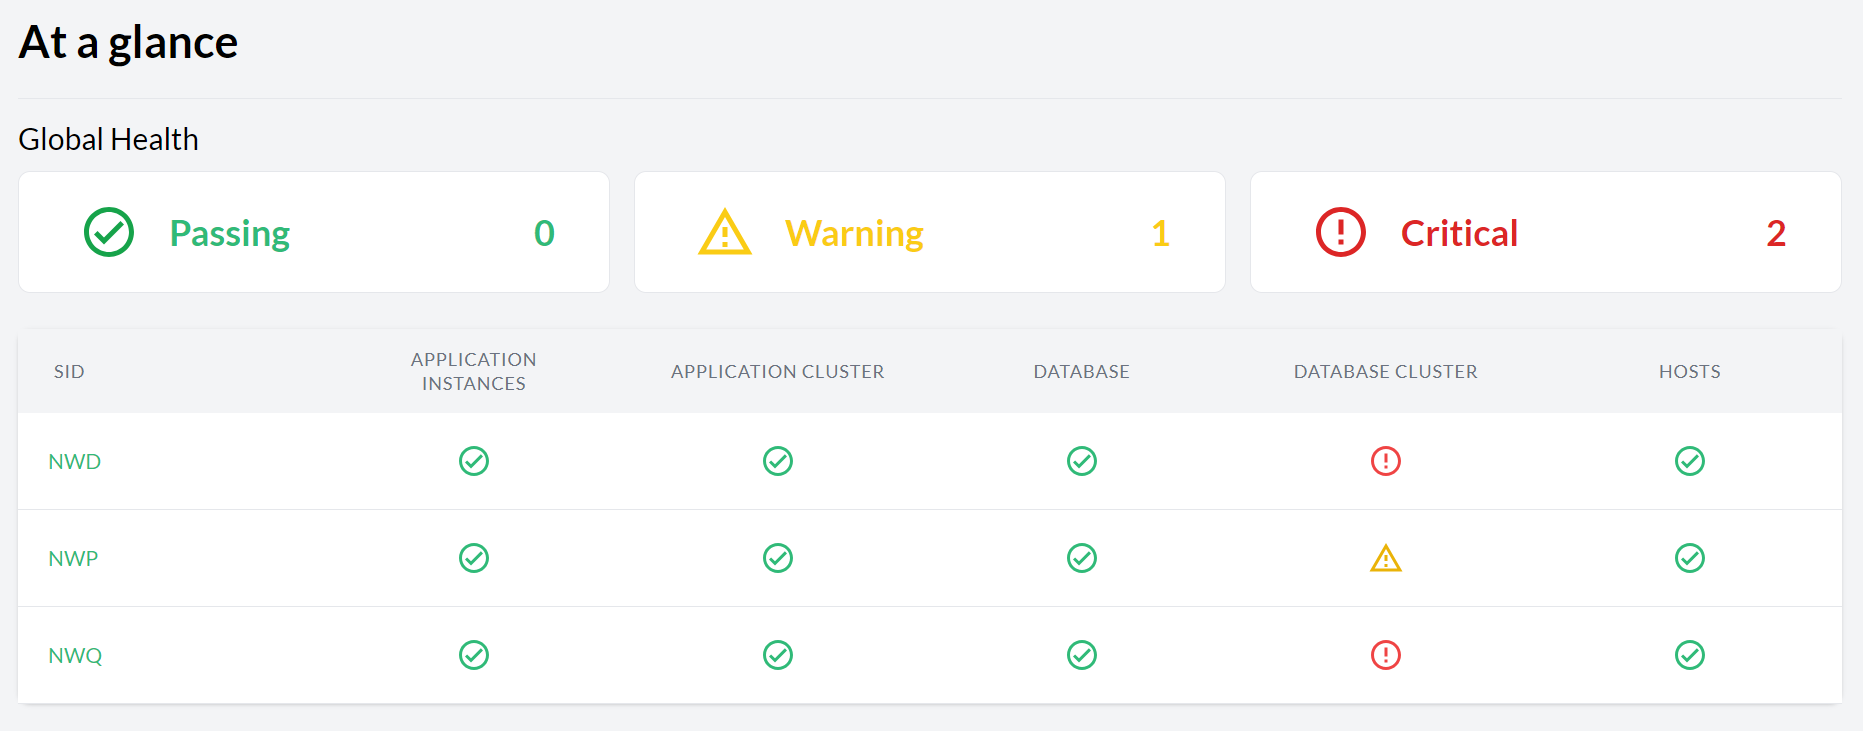
The dashboard groups systems in three different health boxes (see Dashboard with the global health state):
- Passing
Shows the number of systems with all layers with passing (green) status.
- Warning
Shows the number of systems with at least one layer with warning (yellow) status and the rest with passing (green) status.
- Critical
Shows the number of systems with at least one layer with critical (red) status.
The health boxes in the dashboard are clickable. Clicking on a box filters the dashboard by systems with the corresponding health status. In large SAP environments, this feature can help the SAP administrator to determine which systems are in a given status.
The icons representing the health summary of a particular layer contain links to the views in the Trento console that can help determine the source of the issue:
Hosts health icon: Link to the Hosts overview filtered by SID equal to the SAPSID and the DBSID of the corresponding SAP system.
Database cluster health icon: Link to the corresponding SAP HANA Cluster Details view.
Database health icon: Link to the corresponding HANA Database Details view.
Application cluster health icon: Link to the corresponding ASCS/ERS Cluster Details view.
Application Instances health icon: Link to the corresponding SAP System Details view.
Grey status is returned when either a component does not exist, or it is
stopped (as returned by sapcontrol), or its status is unknown (for
instance, if a command to determine the status fails).
Grey statuses are not yet counted in the calculation of the global health status.
11.2 Viewing the status #
The status allows you to see if any of the systems need to be examined further.
The following subsection gives you an overview of specific parts of your SAP Landscape to show their state. Each status site shows an overview of the health states.
11.3 Viewing the status of hosts #
To display the lists of registered hosts and their details, proceed as follows:
Log in to the Trento Web.
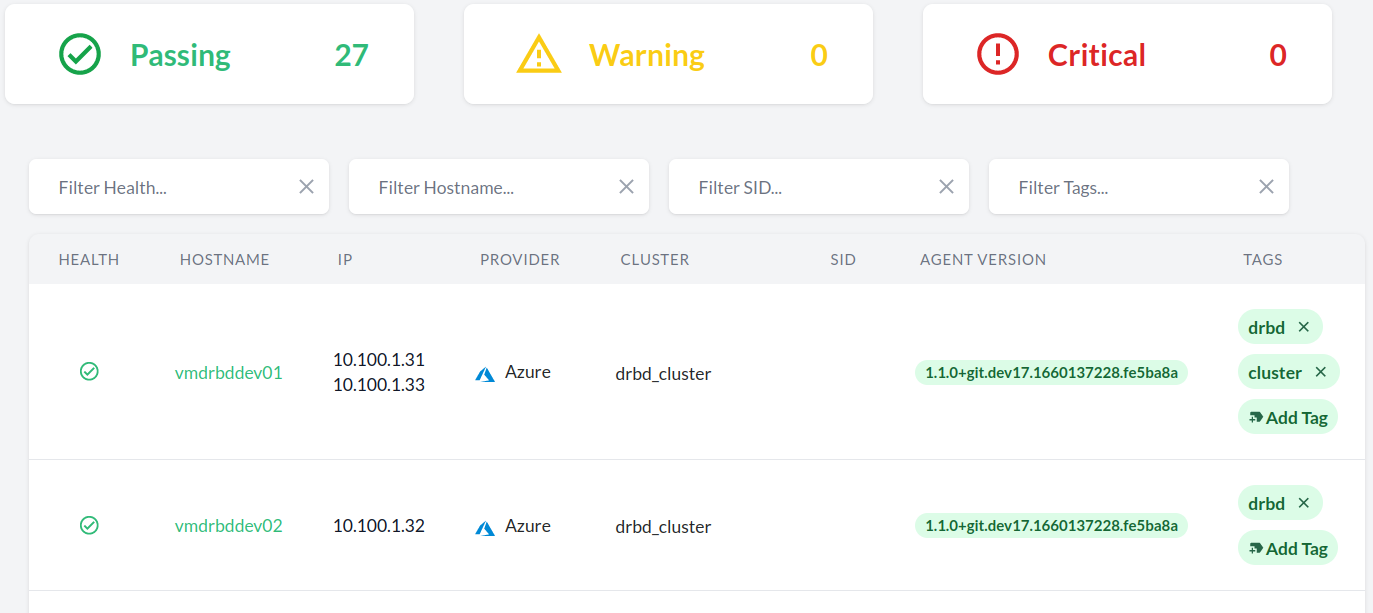
Click the Hosts entry in the left sidebar to show a summary of the state for all hosts.
Figure 11.2: Hosts entry #To look into the specific host details, click the host name in the respective column to open the corresponding Host details view. If the list is too long, shorten it using the filters.
Clicking on a host name opens the corresponding Host details view the following information:
Hosts Details section shows the status of both the Trento Agent and the Node Exporter and provides the host name, the cluster name (when applicable), the Trento Agent version and the host IP addresses.
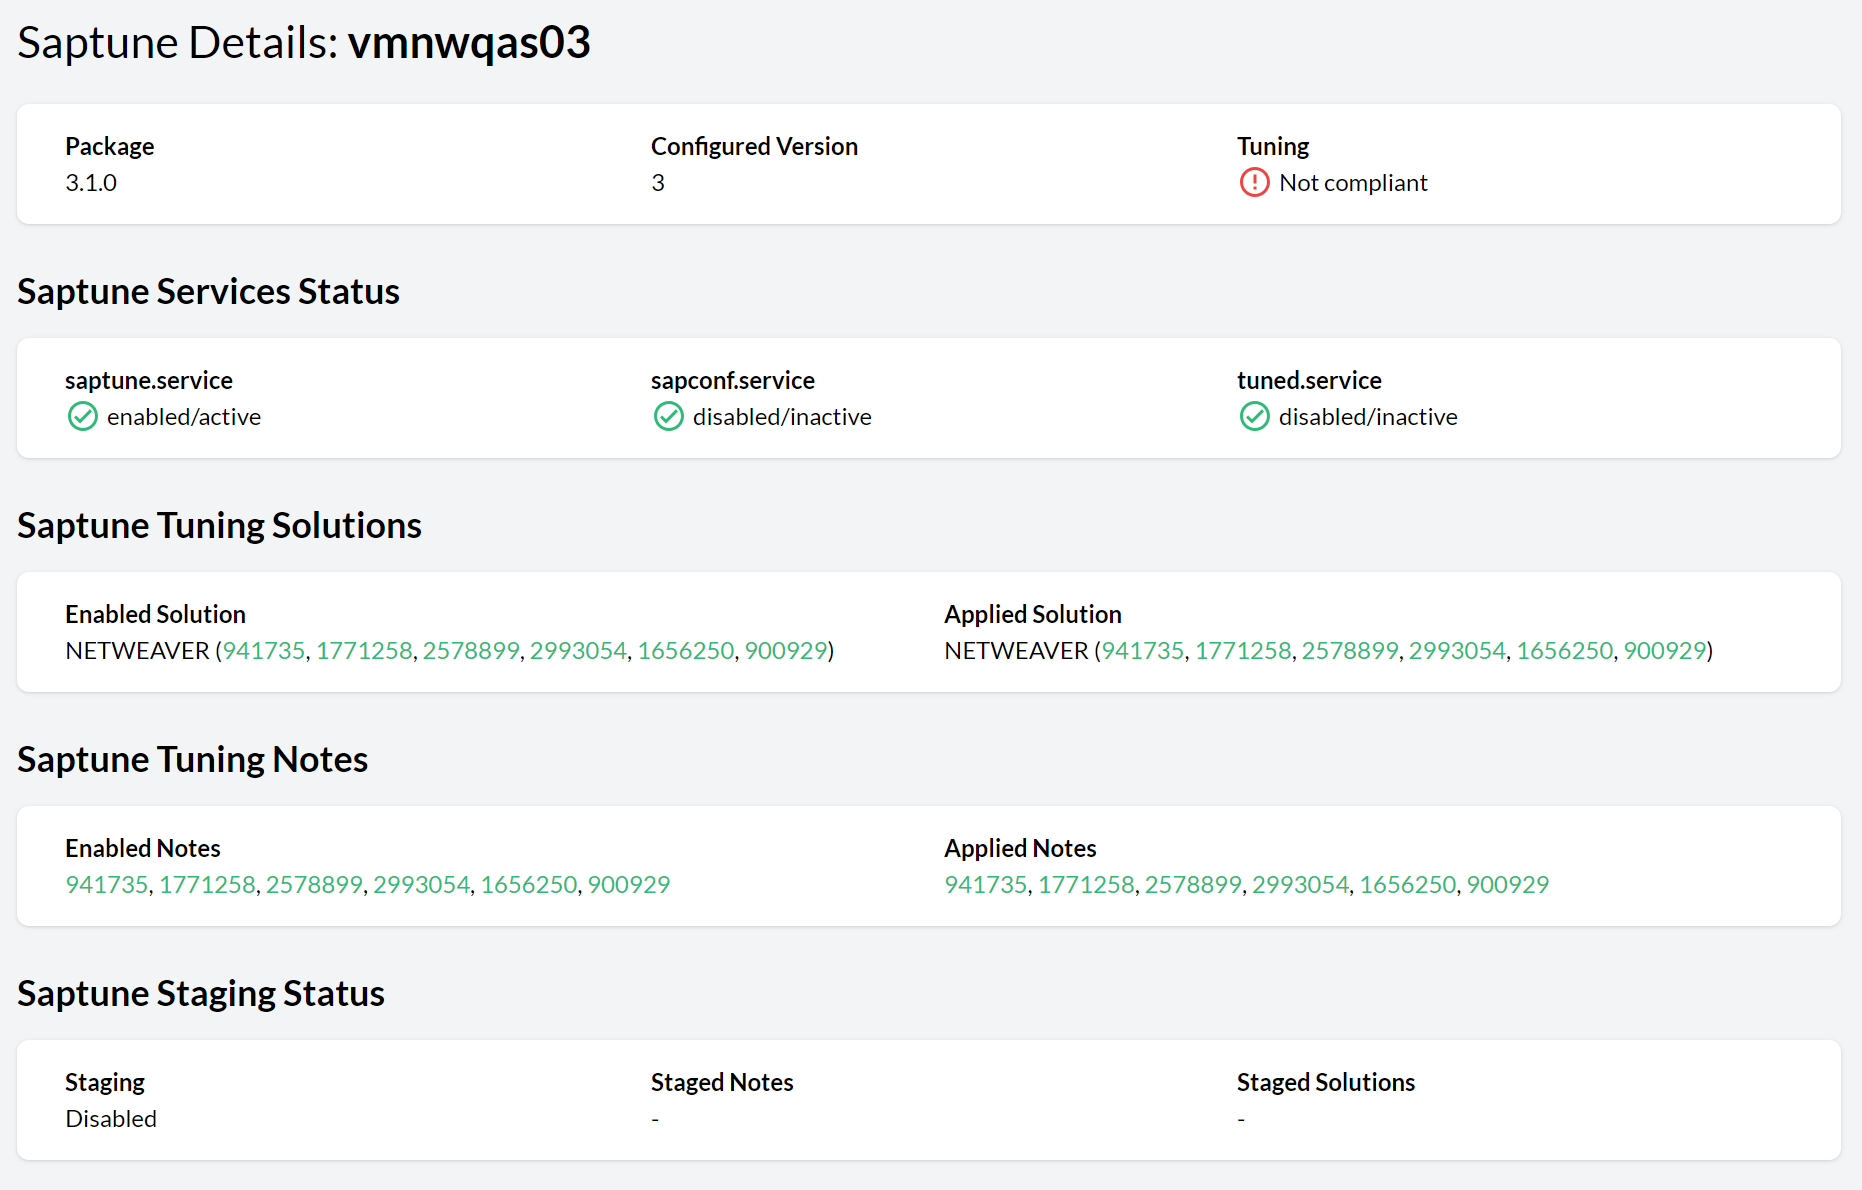
saptune Summary section provides information generated by saptune. saptune comes with SUSE Linux Enterprise Server for SAP applications, and it allows SAP administrators to ensure that their SAP hosts are properly configured to run the corresponding SAP workloads. The integration of saptune in the Trento console gives the SAP administrator access to the saptune information even when they are not working at operating system level. The integration supports saptune 3.1.0 and higher, and includes the addition of the host tuning status in the aggregated health status of the host.
Figure 11.3: saptune Summary section #If an SAP workload is running on the host but no saptune or a version lower than 3.1.0 is installed, a warning is added to the aggregated health status of the host. When saptune version 3.1.0 or higher is installed, a details view shows detailed information about the saptune status:
Figure 11.4: saptune details view #Check Results summary section shows a summary of the checks execution results for the current host.
Available Software Updates section shows a summary of the available patches and upgradable packages for the current host when settings for SUSE Multi-Linux Manager are maintained and the host is managed by the SUSE Multi-Linux Manager instance for which connection data has been provided. Refer to section Chapter 12, Integration with SUSE Multi-Linux Manager. for further details.
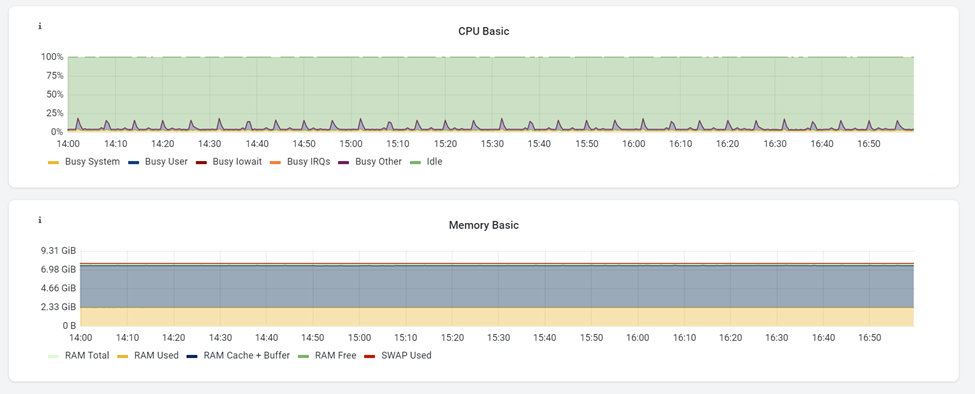
Monitoring dashboard shows the CPU and memory usage for the specific hosts.
Provider Details section shows the name of the cloud provider, the name of the virtual machine, the name of the resource group it belongs to, the location, the size of the virtual machine, and other information.
SAP Instances section lists the ID, SID, type, features, and instance number of any SAP instance running on the host (SAP NetWeaver or SAP HANA).
SUSE Subscription Details section lists the different components or modules that are part of the subscription. For each component and module, the section shows the architecture, the version and type, the registration and subscription status as well as the start and end dates of the subscription.
11.4 Viewing the Pacemaker cluster status #
To display a list of all available Pacemaker clusters and their details, proceed as follows:
Log in to the Trento Web.
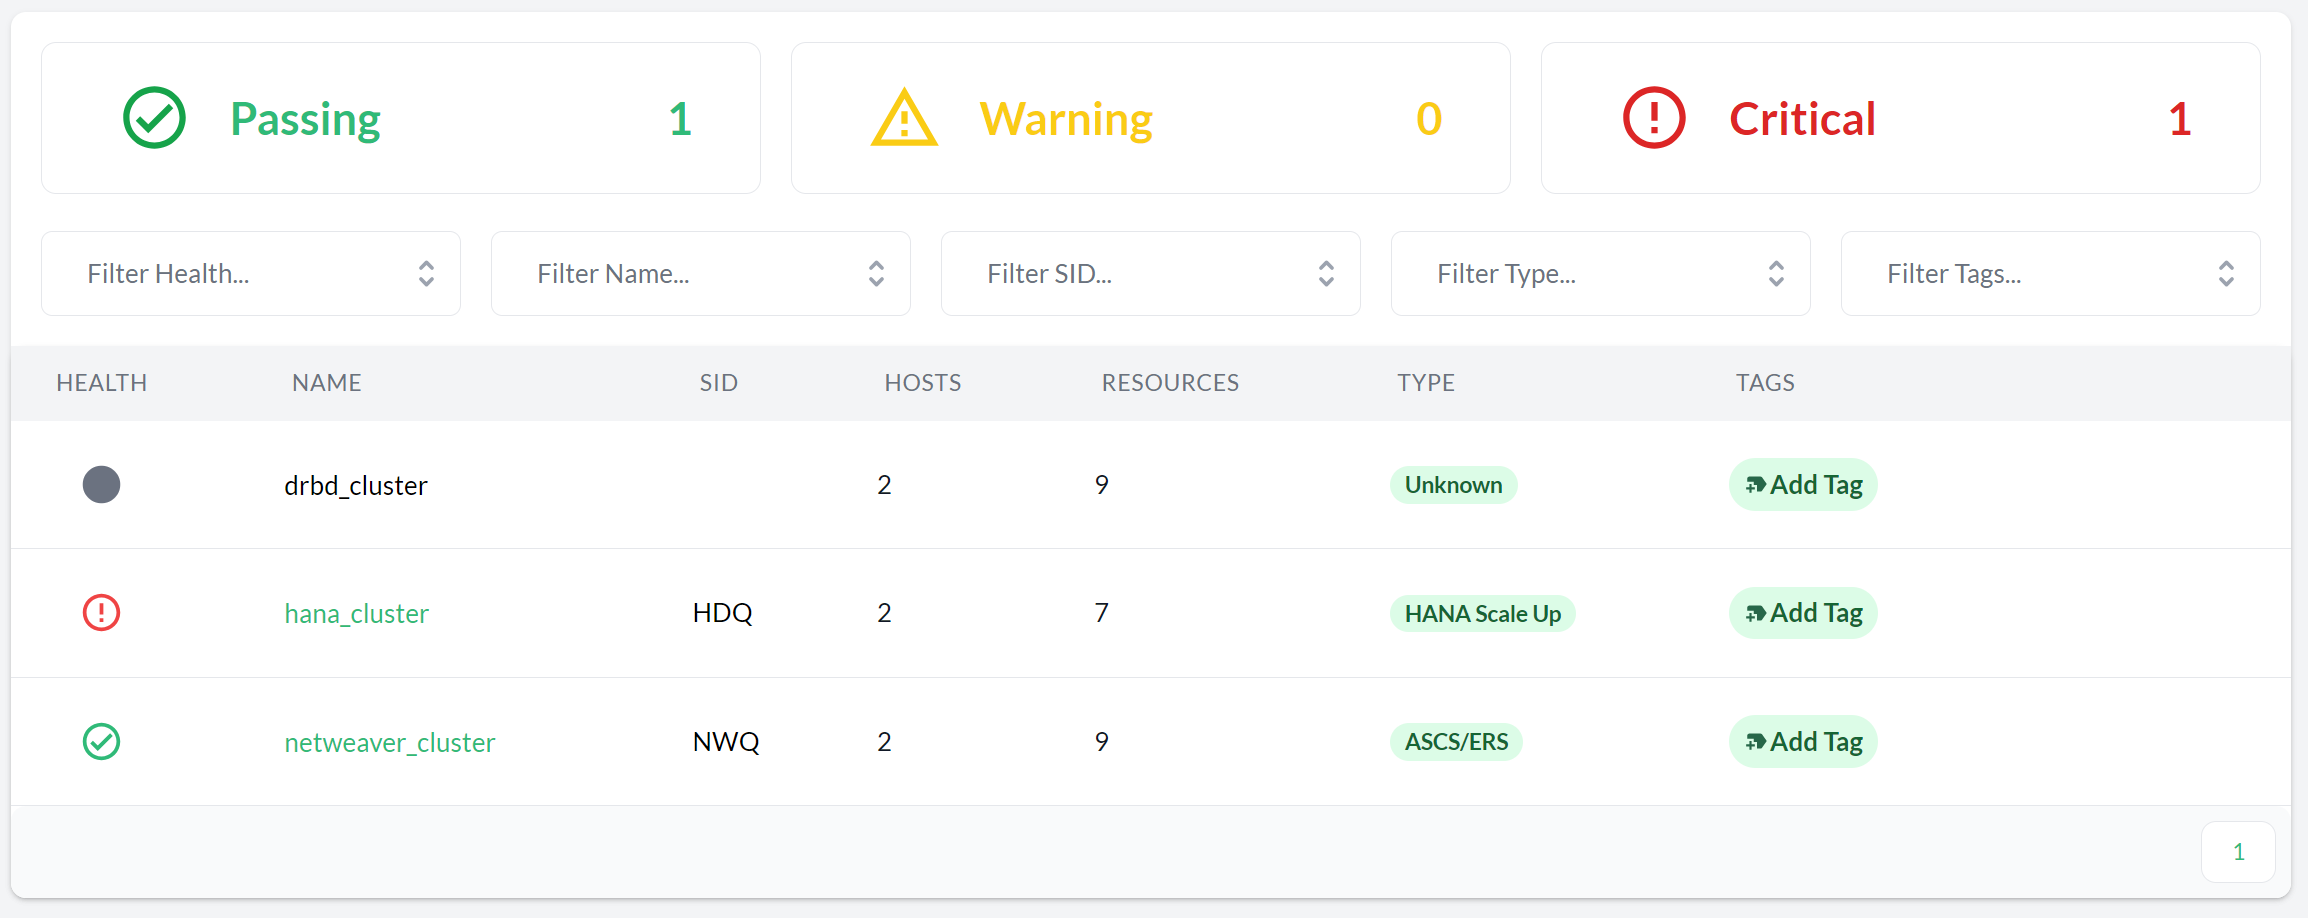
Click the Clusters entry in the left sidebar to show a state summary for all Pacemaker clusters.
Figure 11.5: Pacemaker clusters #To view the specific Pacemaker cluster details, click the cluster name in the appropriate column to open the corresponding Pacemaker cluster details view. If the list is too long, shorten it using filters.
The detail views of a HANA cluster and an ASCS/ERS cluster are different:
The Settings, Show Results, and Start Execution buttons are used to enable or disable checks and to start them. To execute specific checks, follow the instructions in Step 5 of the Performing configuration checks procedure.
Top section displays the cloud provider, the cluster type, the HANA log replication mode, the DBSID, the cluster maintenance status, the HANA secondary sync state, the fencing type, when the CIB was last written, and the HANA log operation mode.
The Checks Results section provides a summary of the check execution results for the particular cluster.
The Pacemaker Site Details section is split in three subsections: one for each HANA site, and another one for cluster nodes without a HANA workload. For example, in case of a majority maker in a HANA scale out cluster, each HANA site subsection informs about the site role (Primary or Secondary or Failed) and lists the different nodes in the site. Each node entry displays the node status (Online or Maintenance or Other), the roles of the nameserver and indexserver services in that node, the local IPs and any assigned virtual IP address. To view the attributes of that node, the resources running on it and their statuses, click the Details button. Close the view using the key.
The Stopped Resources section provides a summary of resources which have been stopped on the cluster.
The SBD/Fencing section shows the status of each SBD device when applicable.
A top section on the left shows the cloud provider, the cluster type, fencing type, when the CIB was last written and the cluster maintenance status.
The next top-center multi-tab section shows the SAP SID, the Enqueue Server version, whether the ASCS and ERS are running on different hosts or not, and whether the instance filesystems are resource based or not. When multiple systems share the same cluster, there is a tab for each system in the cluster, and you can scroll left and right to go through the different systems.
The Checks Results section shows a summary of the results of the last check execution, when applicable.
The Node Details section shows the following for each node in the cluster: the node status (Online or Maintenance or Other), the host name, the role of the node in the cluster, the assigned virtual IP address and, in case of resource managed filesystems, the full mounting path. To view the attributes and resources associated to that particular node, click Details. Close the view using the key.
This section is system-specific. It shows the information corresponding to the system selected in the multi-tab section above.
The Stopped Resources section displays a summary of resources which have been stopped on the cluster.
The SBD/Fencing section shows the status of each SBD device when applicable.
11.5 Viewing the SAP Systems status #
To display a list of all available SAP Systems and their details, proceed as follows:
Log in to the Trento Web.
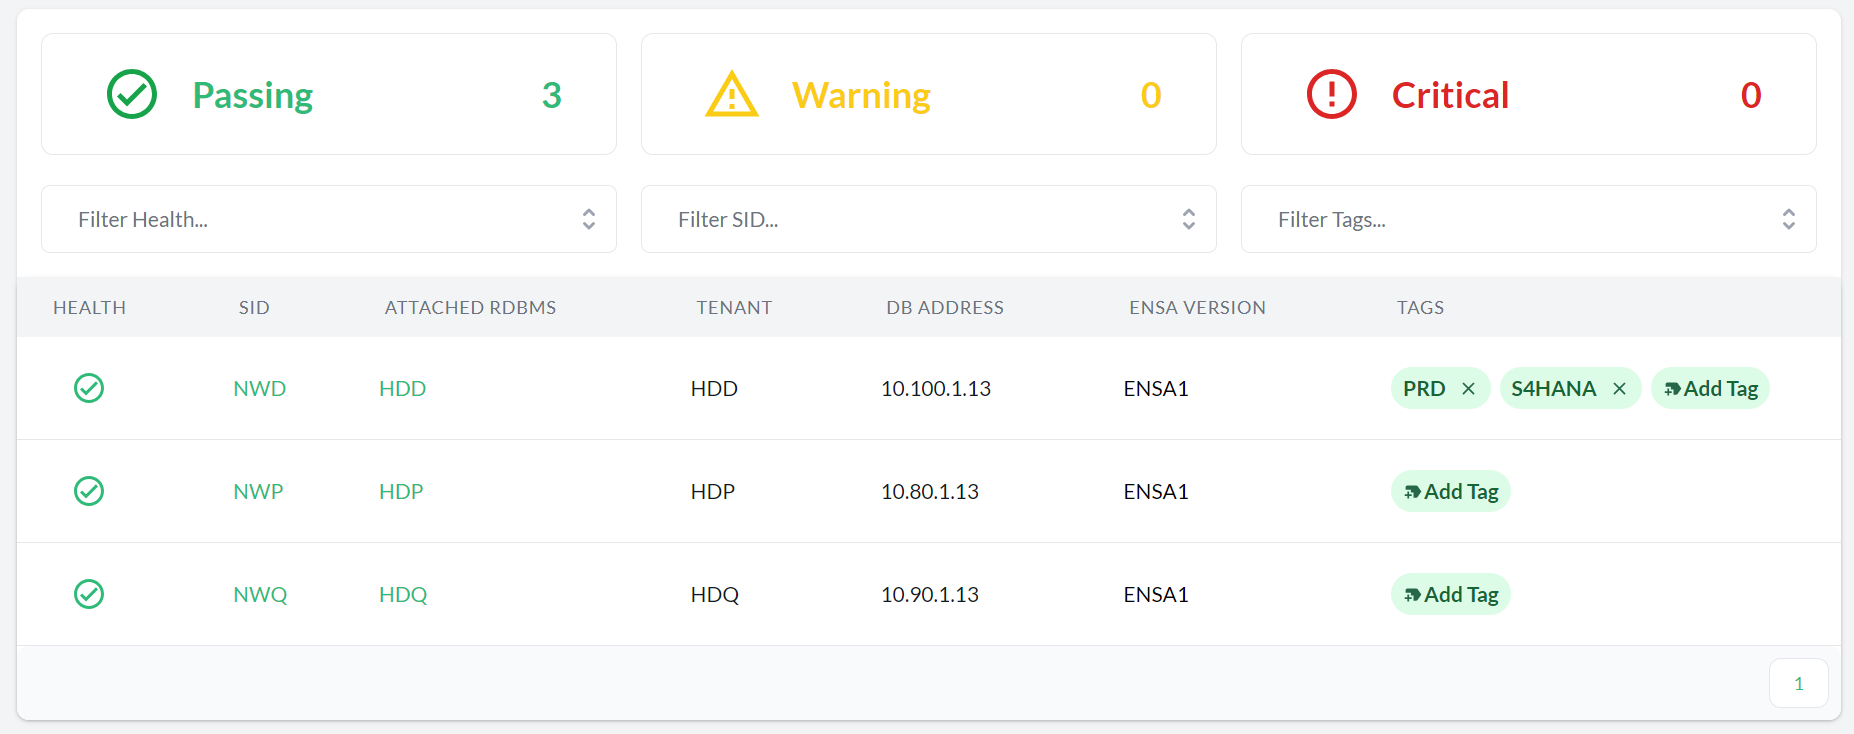
Click the SAP Systems entry in the left sidebar to show a state summary for all SAP Systems.
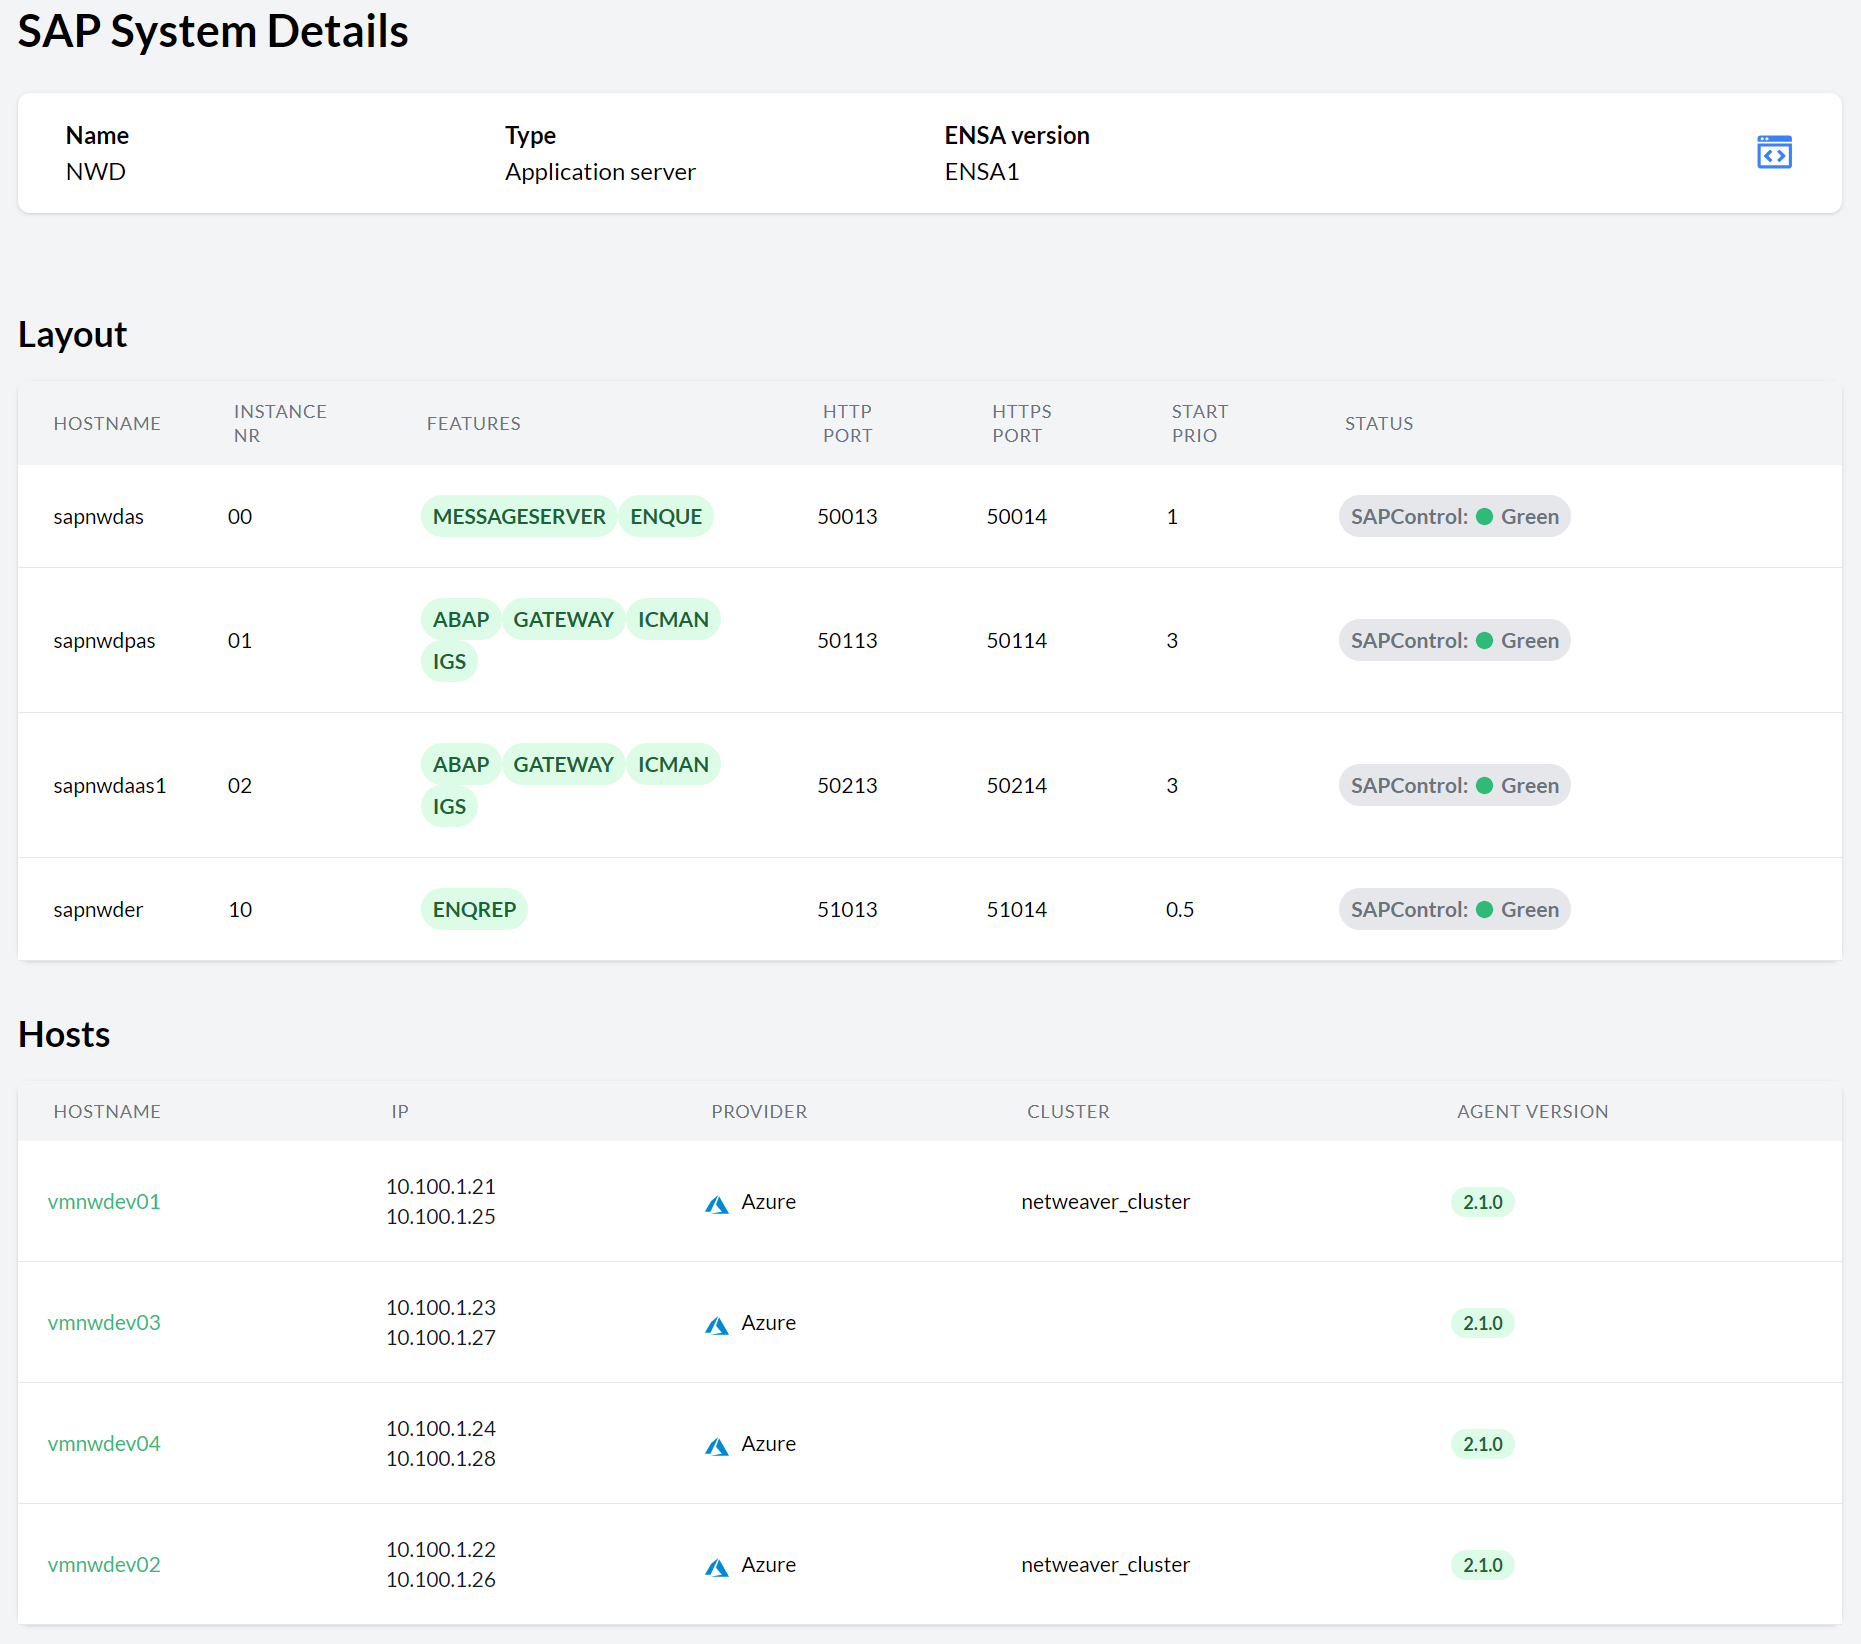
Figure 11.6: SAP Systems #To open the SAP System Details view, click the corresponding SID. This view provides the following:
The name and type of the current SAP System.
The Layout section lists all instances and their virtual host names, instance numbers, features (processes), HTTP and HTTPS ports, start priorities, and SAPControl statuses.
The Hosts section shows the host name, the IP address, the cloud provider (when applicable), the cluster name (when applicable), and the Trento Agent version for each listed host. Click the host name to go to the corresponding Host details view.
Figure 11.7: SAP System Details #
11.6 Viewing the SAP HANA database status #
To display a list of all available SAP HANA databases and their details, proceed as follows:
Log in to the Trento Web.
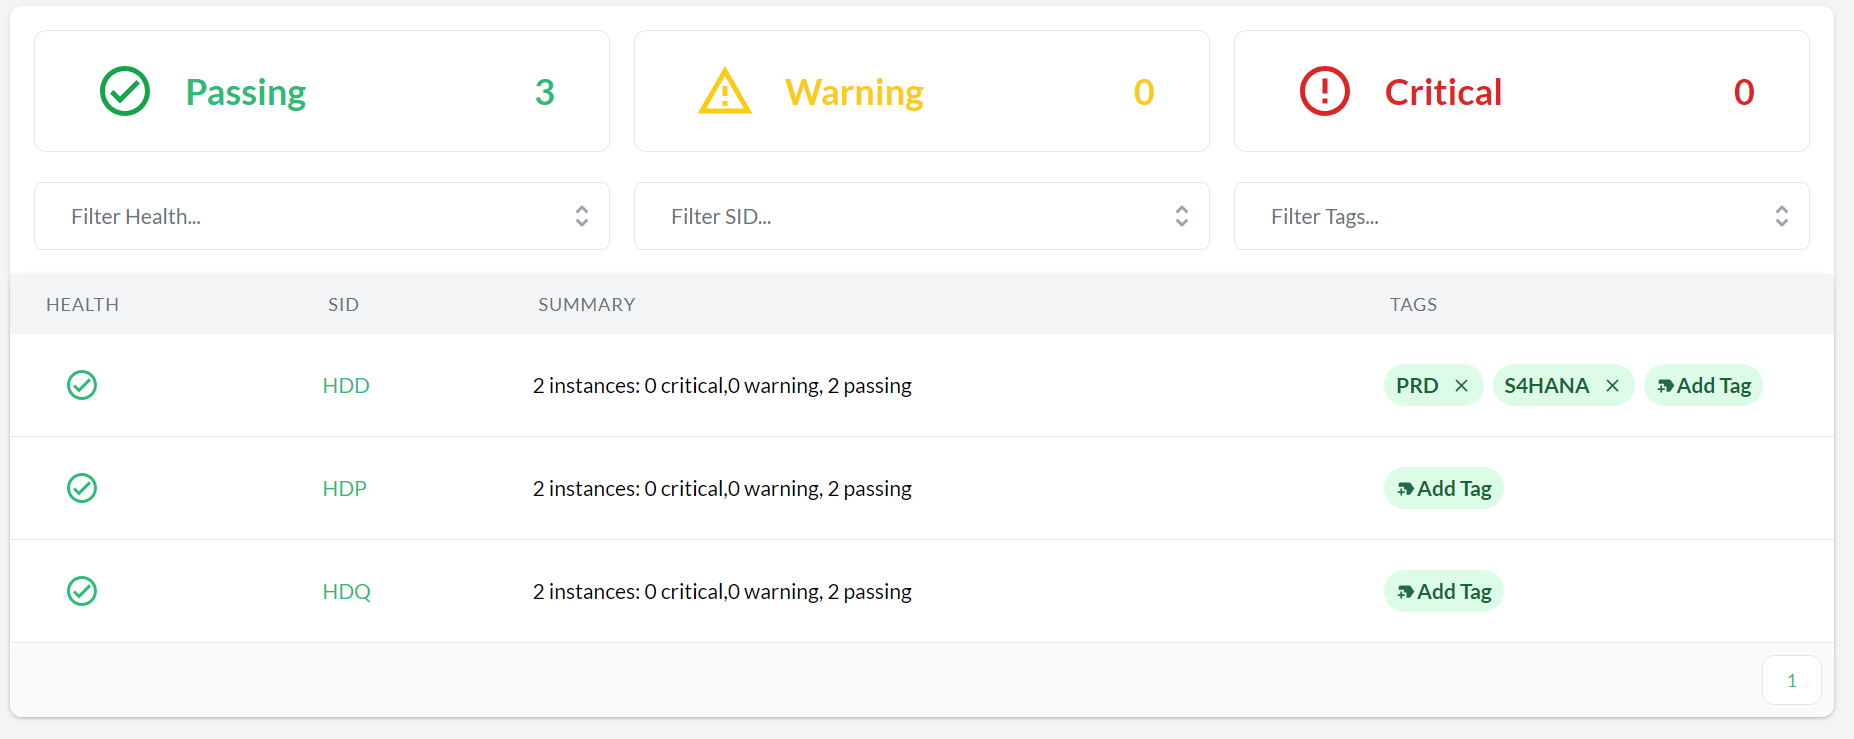
Click the HANA databases entry in the left sidebar to show a summary of the state for all SAP HANA databases.
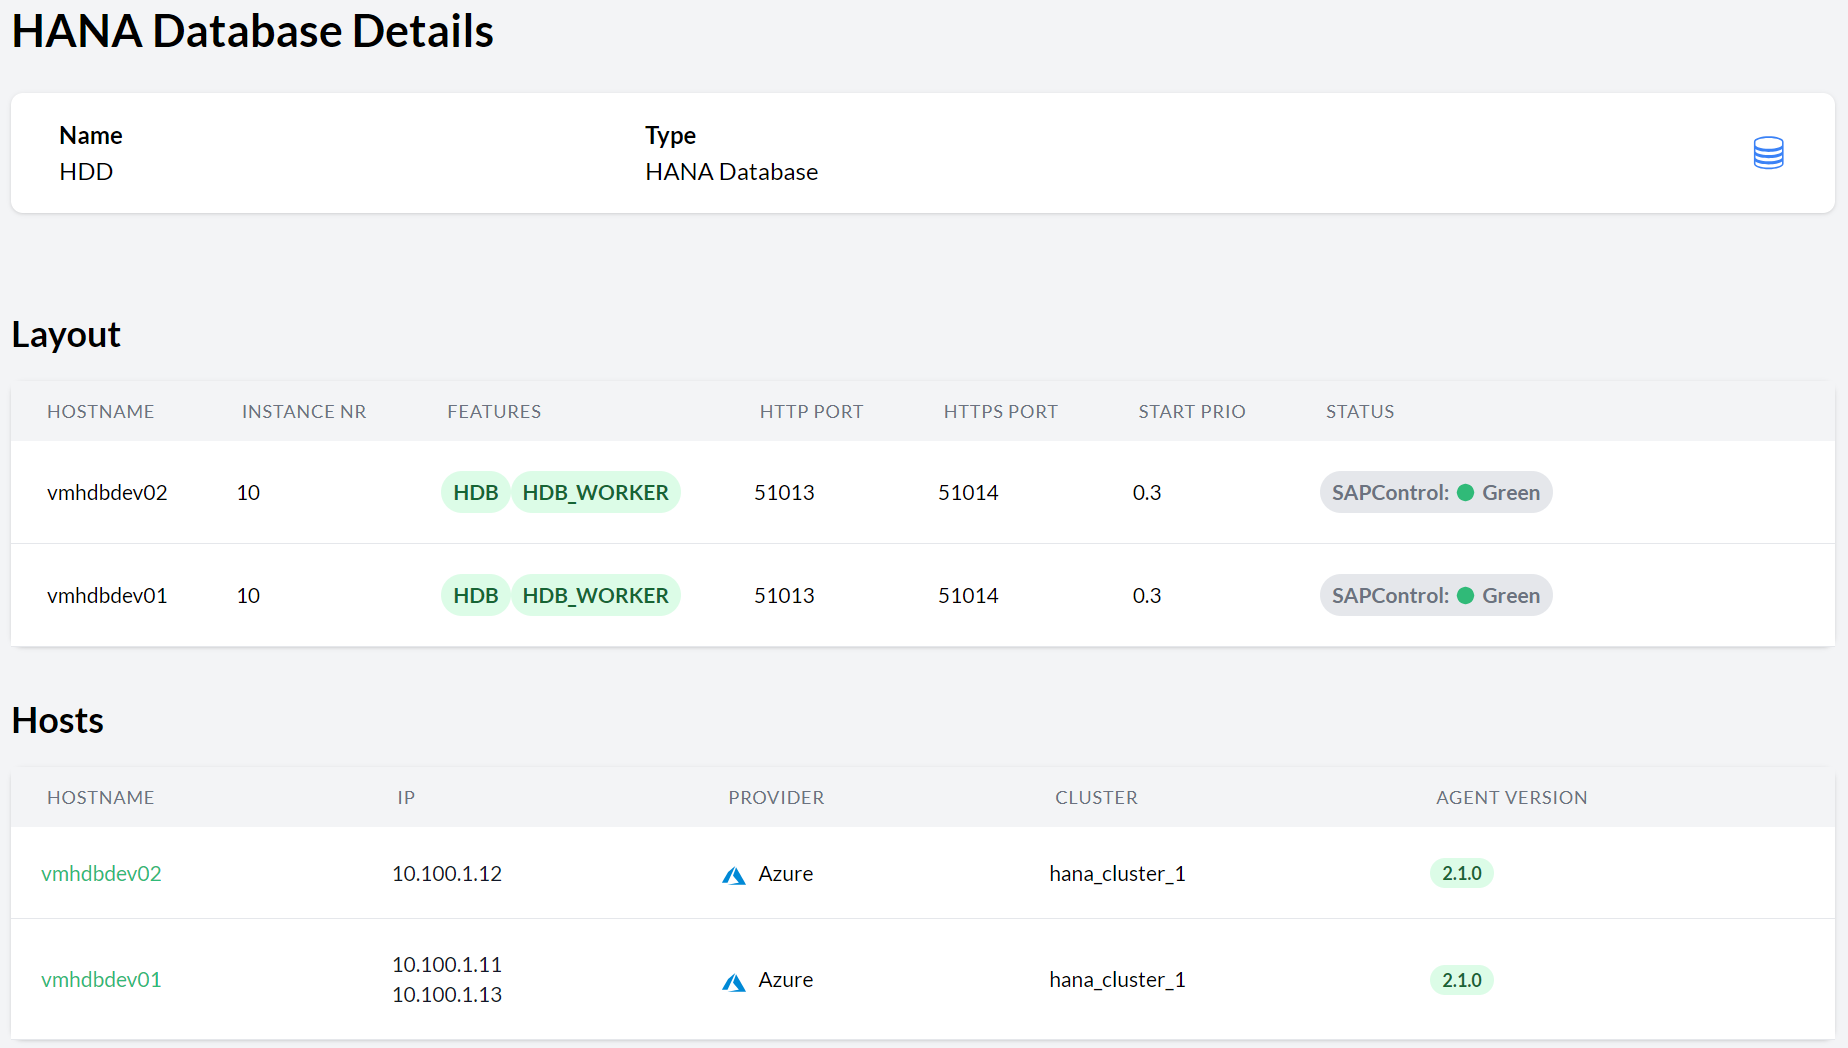
Figure 11.8: HANA databases #Click one of the SIDs to open the corresponding HANA Databases detail view. This view provides the following:
The name and type of this SAP System.
The Layout section lists all related SAP HANA instances with their virtual host names, instance numbers, features (roles), HTTP/HTTPS ports, start priorities, and SAPControl statuses.
The Hosts section lists the hosts where all related instances are running. For each host, it shows the host name, the local IP address(es), the cloud provider (when applicable), the cluster name (when applicable), the system ID, and the Trento Agent version.
Click on a host name to go to the corresponding Host details view.
Figure 11.9: HANA Database details #
11.7 Configuring Trento Web settings #
Users with the all:settings permissions can use the Settings view of Trento Web to modify the following:
API key. See Section 9.6, “Rotating API keys”.
Connection data for SUSE Multi-Linux Manager. See Chapter 12, Integration with SUSE Multi-Linux Manager.
Retention time for Activity Log entries. See Section 9.3, “Activity Log”.
Settings required for sending alerts via email. Note that if any of the email settings are specified via environment variables (see Section 4.1.1.5, “Enabling email alerts”), the web-based configuration is disabled.
