11 Managing the Dashboard #
Information about managing and configuring the Dashboard service.
11.1 Configuring the Dashboard Service #
horizon is the OpenStack service that serves as the basis for the SUSE OpenStack Cloud dashboards.
The dashboards provide a web-based user interface to SUSE OpenStack Cloud services including Compute, Volume Operations, Networking, and Identity.
Along the left side of the dashboard are sections that provide access to Project and Identity sections. If your login credentials have been assigned the 'admin' role you will also see a separate Admin section that provides additional system-wide setting options.
Across the top are menus to switch between projects and menus where you can access user settings.
11.1.1 Dashboard Service and TLS in SUSE OpenStack Cloud #
By default, the Dashboard service is configured with TLS in the input model (ardana-input-model). You should not disable TLS in the input model for the Dashboard service. The normal use case for users is to have all services behind TLS, but users are given the freedom in the input model to take a service off TLS for troubleshooting or debugging. TLS should always be enabled for production environments.
Make sure that horizon_public_protocol and
horizon_private_protocol are both be set to use https.
11.2 Changing the Dashboard Timeout Value #
The default session timeout for the dashboard is 1800 seconds or 30 minutes. This is the recommended default and best practice for those concerned with security.
As an administrator, you can change the session timeout by changing the value of the SESSION_TIMEOUT to anything less than or equal to 14400, which is equal to four hours. Values greater than 14400 should not be used due to keystone constraints.
Increasing the value of SESSION_TIMEOUT increases the risk of abuse.
11.2.1 How to Change the Dashboard Timeout Value #
Follow these steps to change and commit the horizon timeout value.
Log in to the Cloud Lifecycle Manager.
Edit the Dashboard config file at
~/openstack/my_cloud/config/horizon/local_settings.pyand, if it is not already present, add a line forSESSION_TIMEOUTabove the line forSESSION_ENGINE.Here is an example snippet, in bold:
SESSION_TIMEOUT = <timeout value> SESSION_ENGINE = 'django.contrib.sessions.backends.db'ImportantDo not exceed the maximum value of 14400.
Commit the changes to git:
git add -A
git commit -a -m "changed horizon timeout value"
Run the configuration processor:
cd ~/openstack/ardana/ansible
ansible-playbook -i hosts/localhost config-processor-run.yml
Update your deployment directory:
cd ~/openstack/ardana/ansible
ansible-playbook -i hosts/localhost ready-deployment.yml
Run the Dashboard reconfigure playbook:
cd ~/scratch/ansible/next/ardana/ansible
ansible-playbook -i hosts/verb_hosts horizon-reconfigure.yml
11.3 Creating a Load Balancer with the Dashboard #
In SUSE OpenStack Cloud 9 you can create a Load Balancer with the Load Balancer Panel in the Dashboard.
Follow the steps below to create the load balancer, listener, pool, add members to the pool and create the health monitor.
Optionally, you may add members to the load balancer pool after the load balancer has been created.
Login to the Dashboard
Login into the Dashboard using your domain, user account and password.
Navigate and Create Load Balancer
Once logged into the Dashboard, navigate to the panel by selecting › › in the navigation menu, then select from the Load Balancers page.
Create Load Balancer
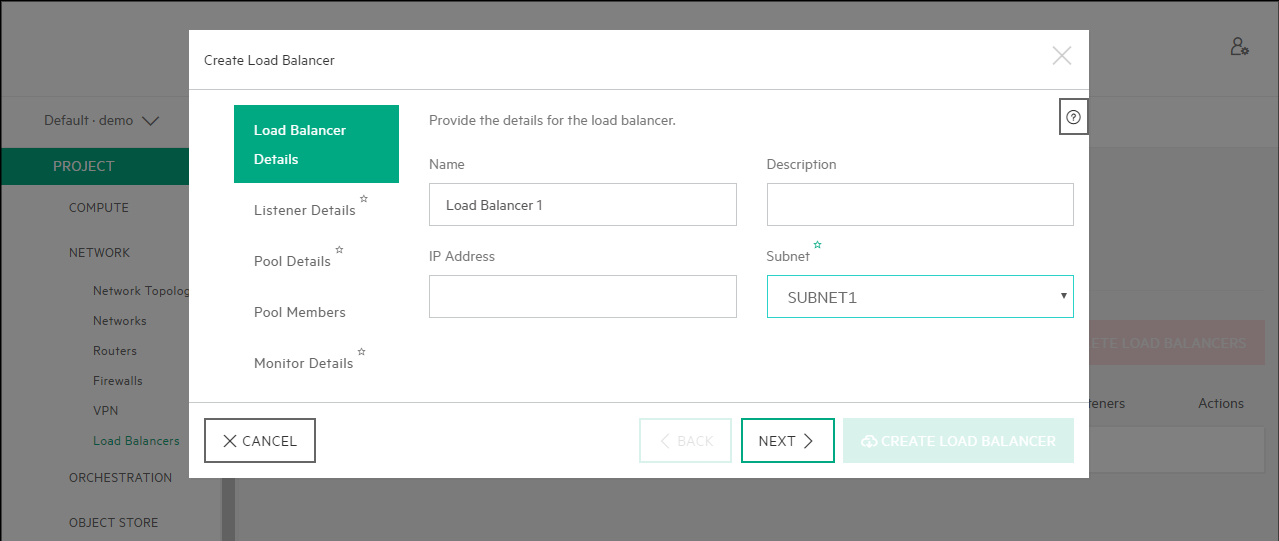
Provide the Load Balancer details, Load Balancer Name, Description (optional), IP Address and Subnet. When complete, select Next.
Create Listener
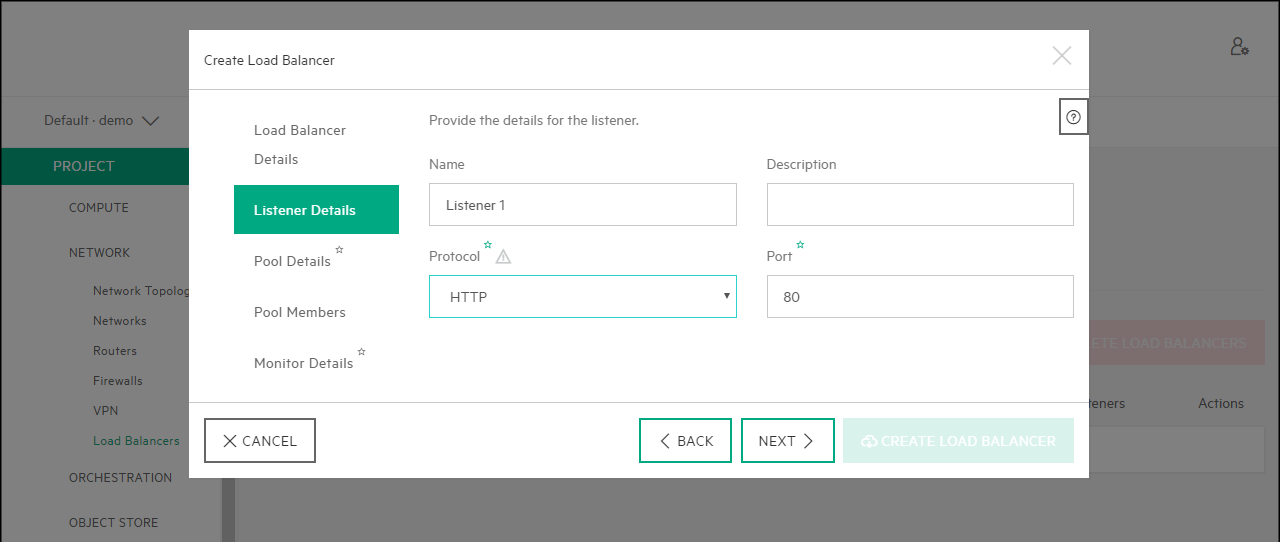
Provide a Name, Description, Protocol (HTTP, TCP, TERMINATED_HTTPS) and Port for the Load Balancer Listener.
Create Pool
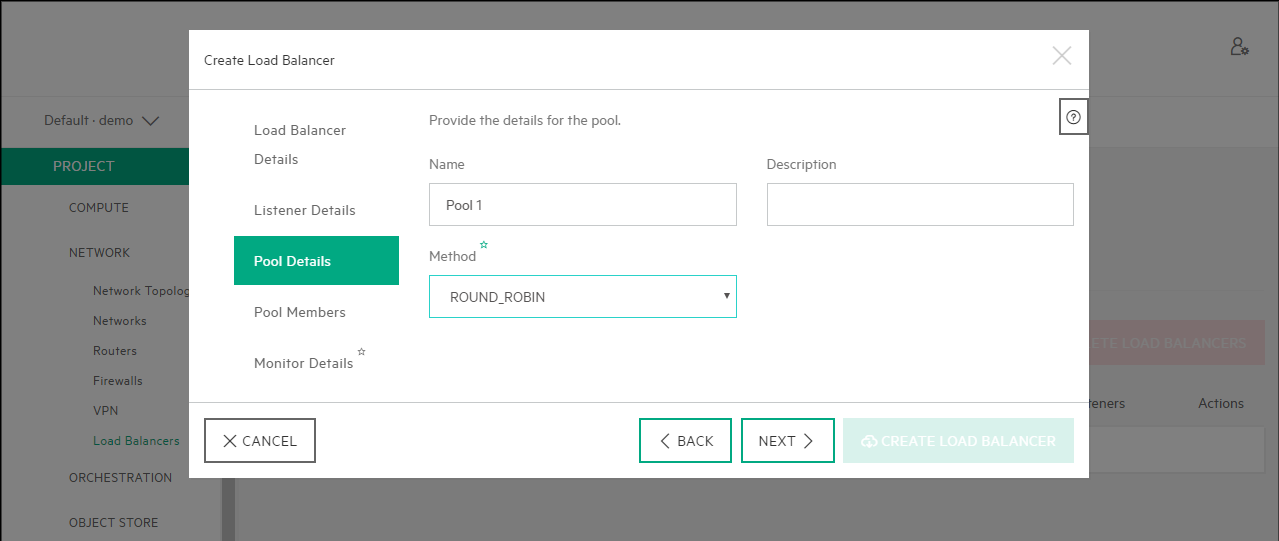
Provide the Name, Description and Method (LEAST_CONNECTIONS, ROUND_ROBIN, SOURCE_IP) for the Load Balancer Pool.
Add Pool Members
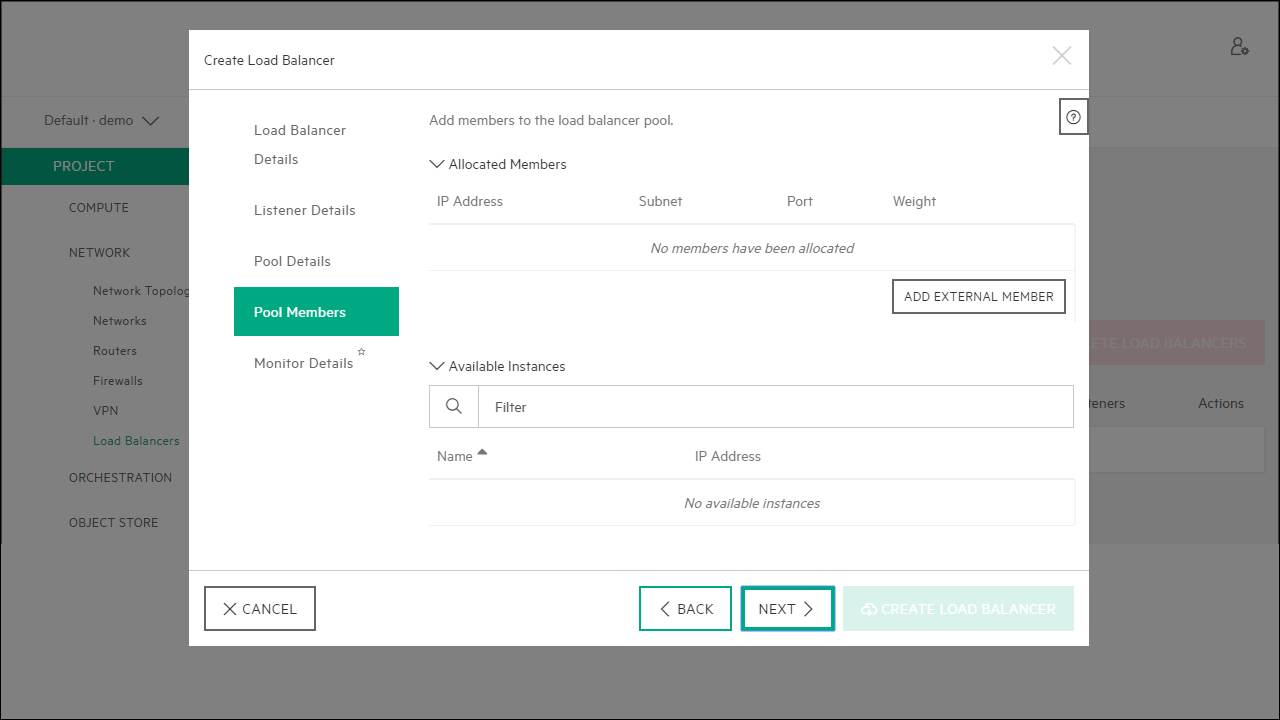
Add members to the Load Balancer Pool.
NoteOptionally, you may add members to the load balancer pool after the load balancer has been created.
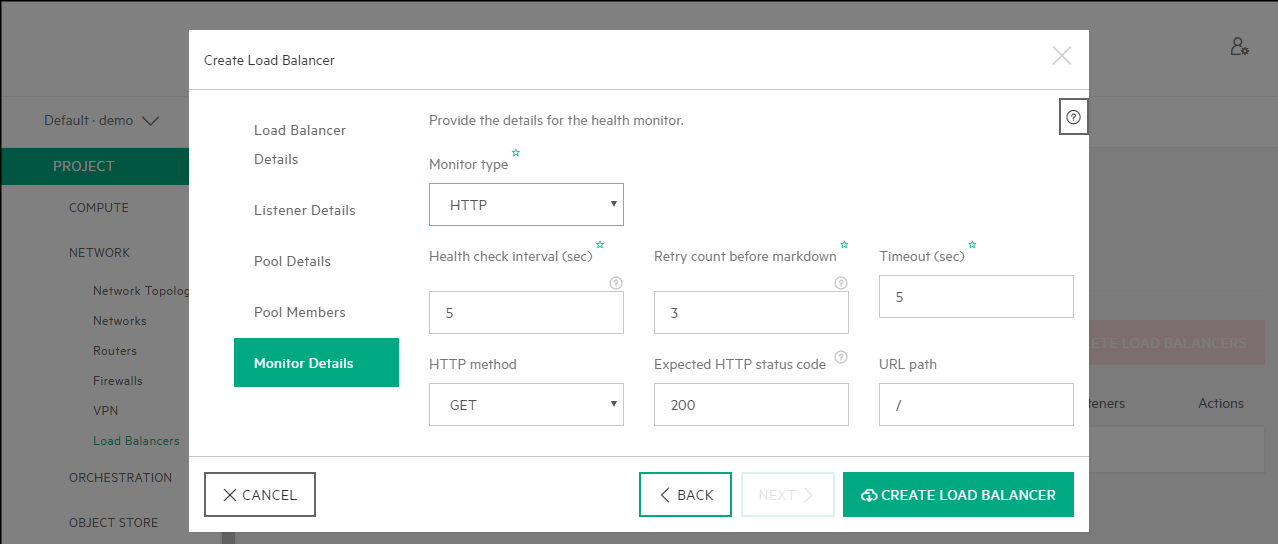
Create Health Monitor
Create Health Monitor by providing the Monitor type (HTTP, PING, TCP), the Health check interval, Retry count, timeout, HTTP Method, Expected HTTP status code and the URL path. Once all fields are filled, select Create Load Balancer.
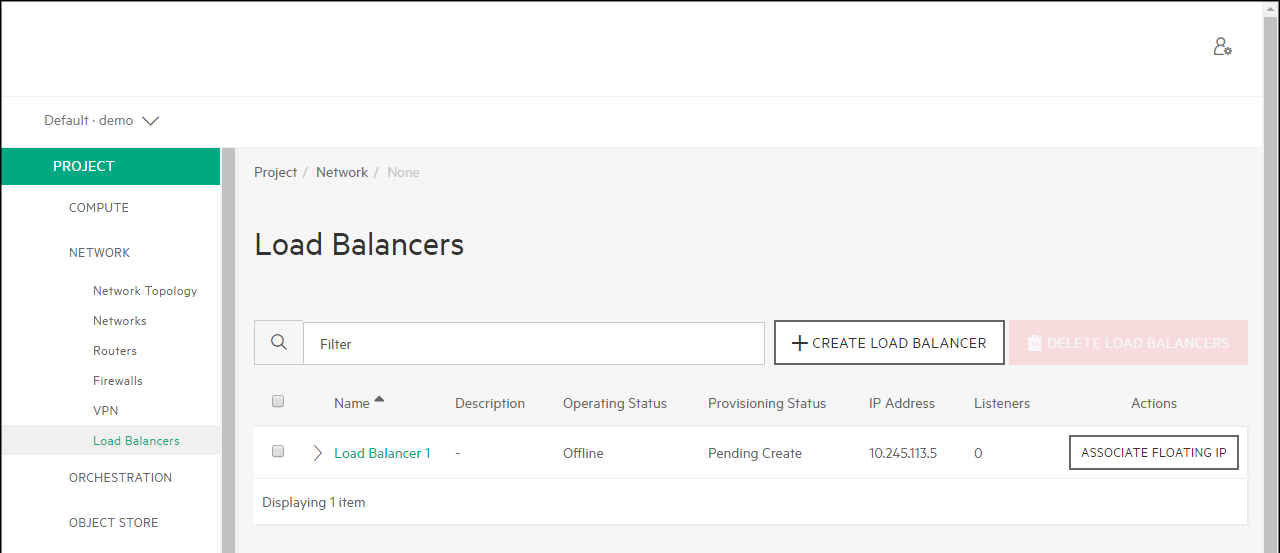
Load Balancer Provisioning Status
Clicking on the Load Balancers tab again will provide the status of the Load Balancer. The Load Balancer will be in Pending Create until the Load Balancer is created, at which point the Load Balancer will change to an Active state.
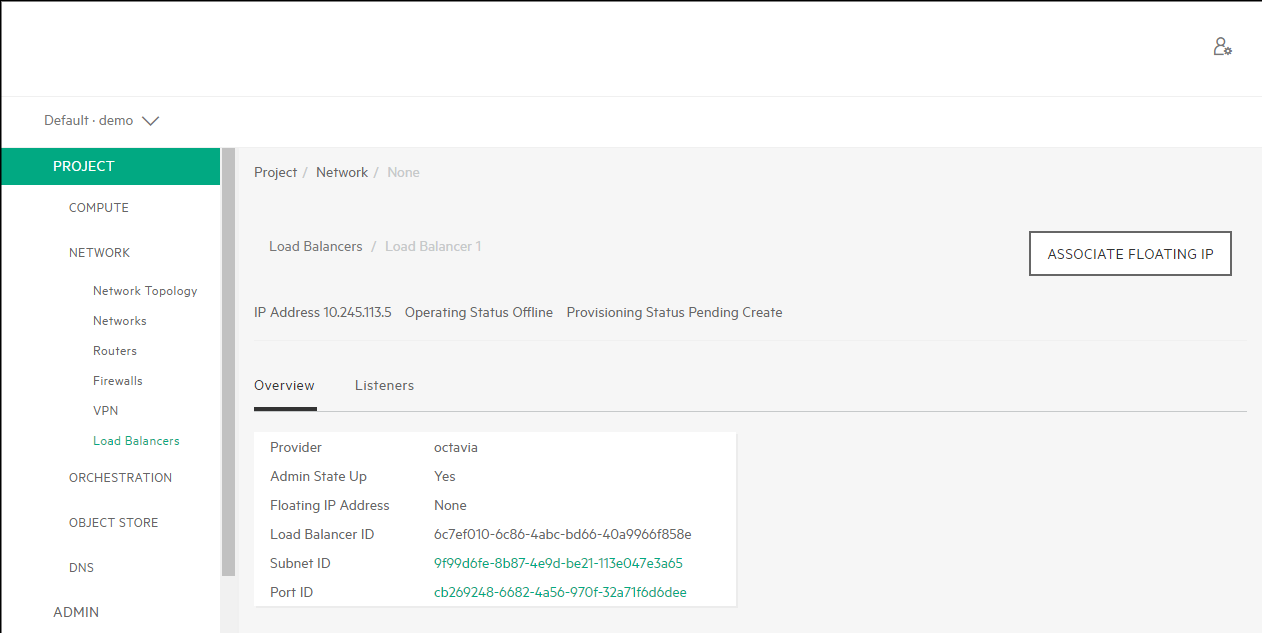
Load Balancer Overview
Once Load Balancer 1 has been created, it will appear in the Load Balancers list. Click the Load Balancer 1, it will show the Overview. In this view, you can see the Load Balancer Provider type, the Admin State, Floating IP, Load Balancer, Subnet and Port ID's.

