Getting Started with Open Telemetry on Kubernetes
This guide provides instructions on monitoring an application.
-
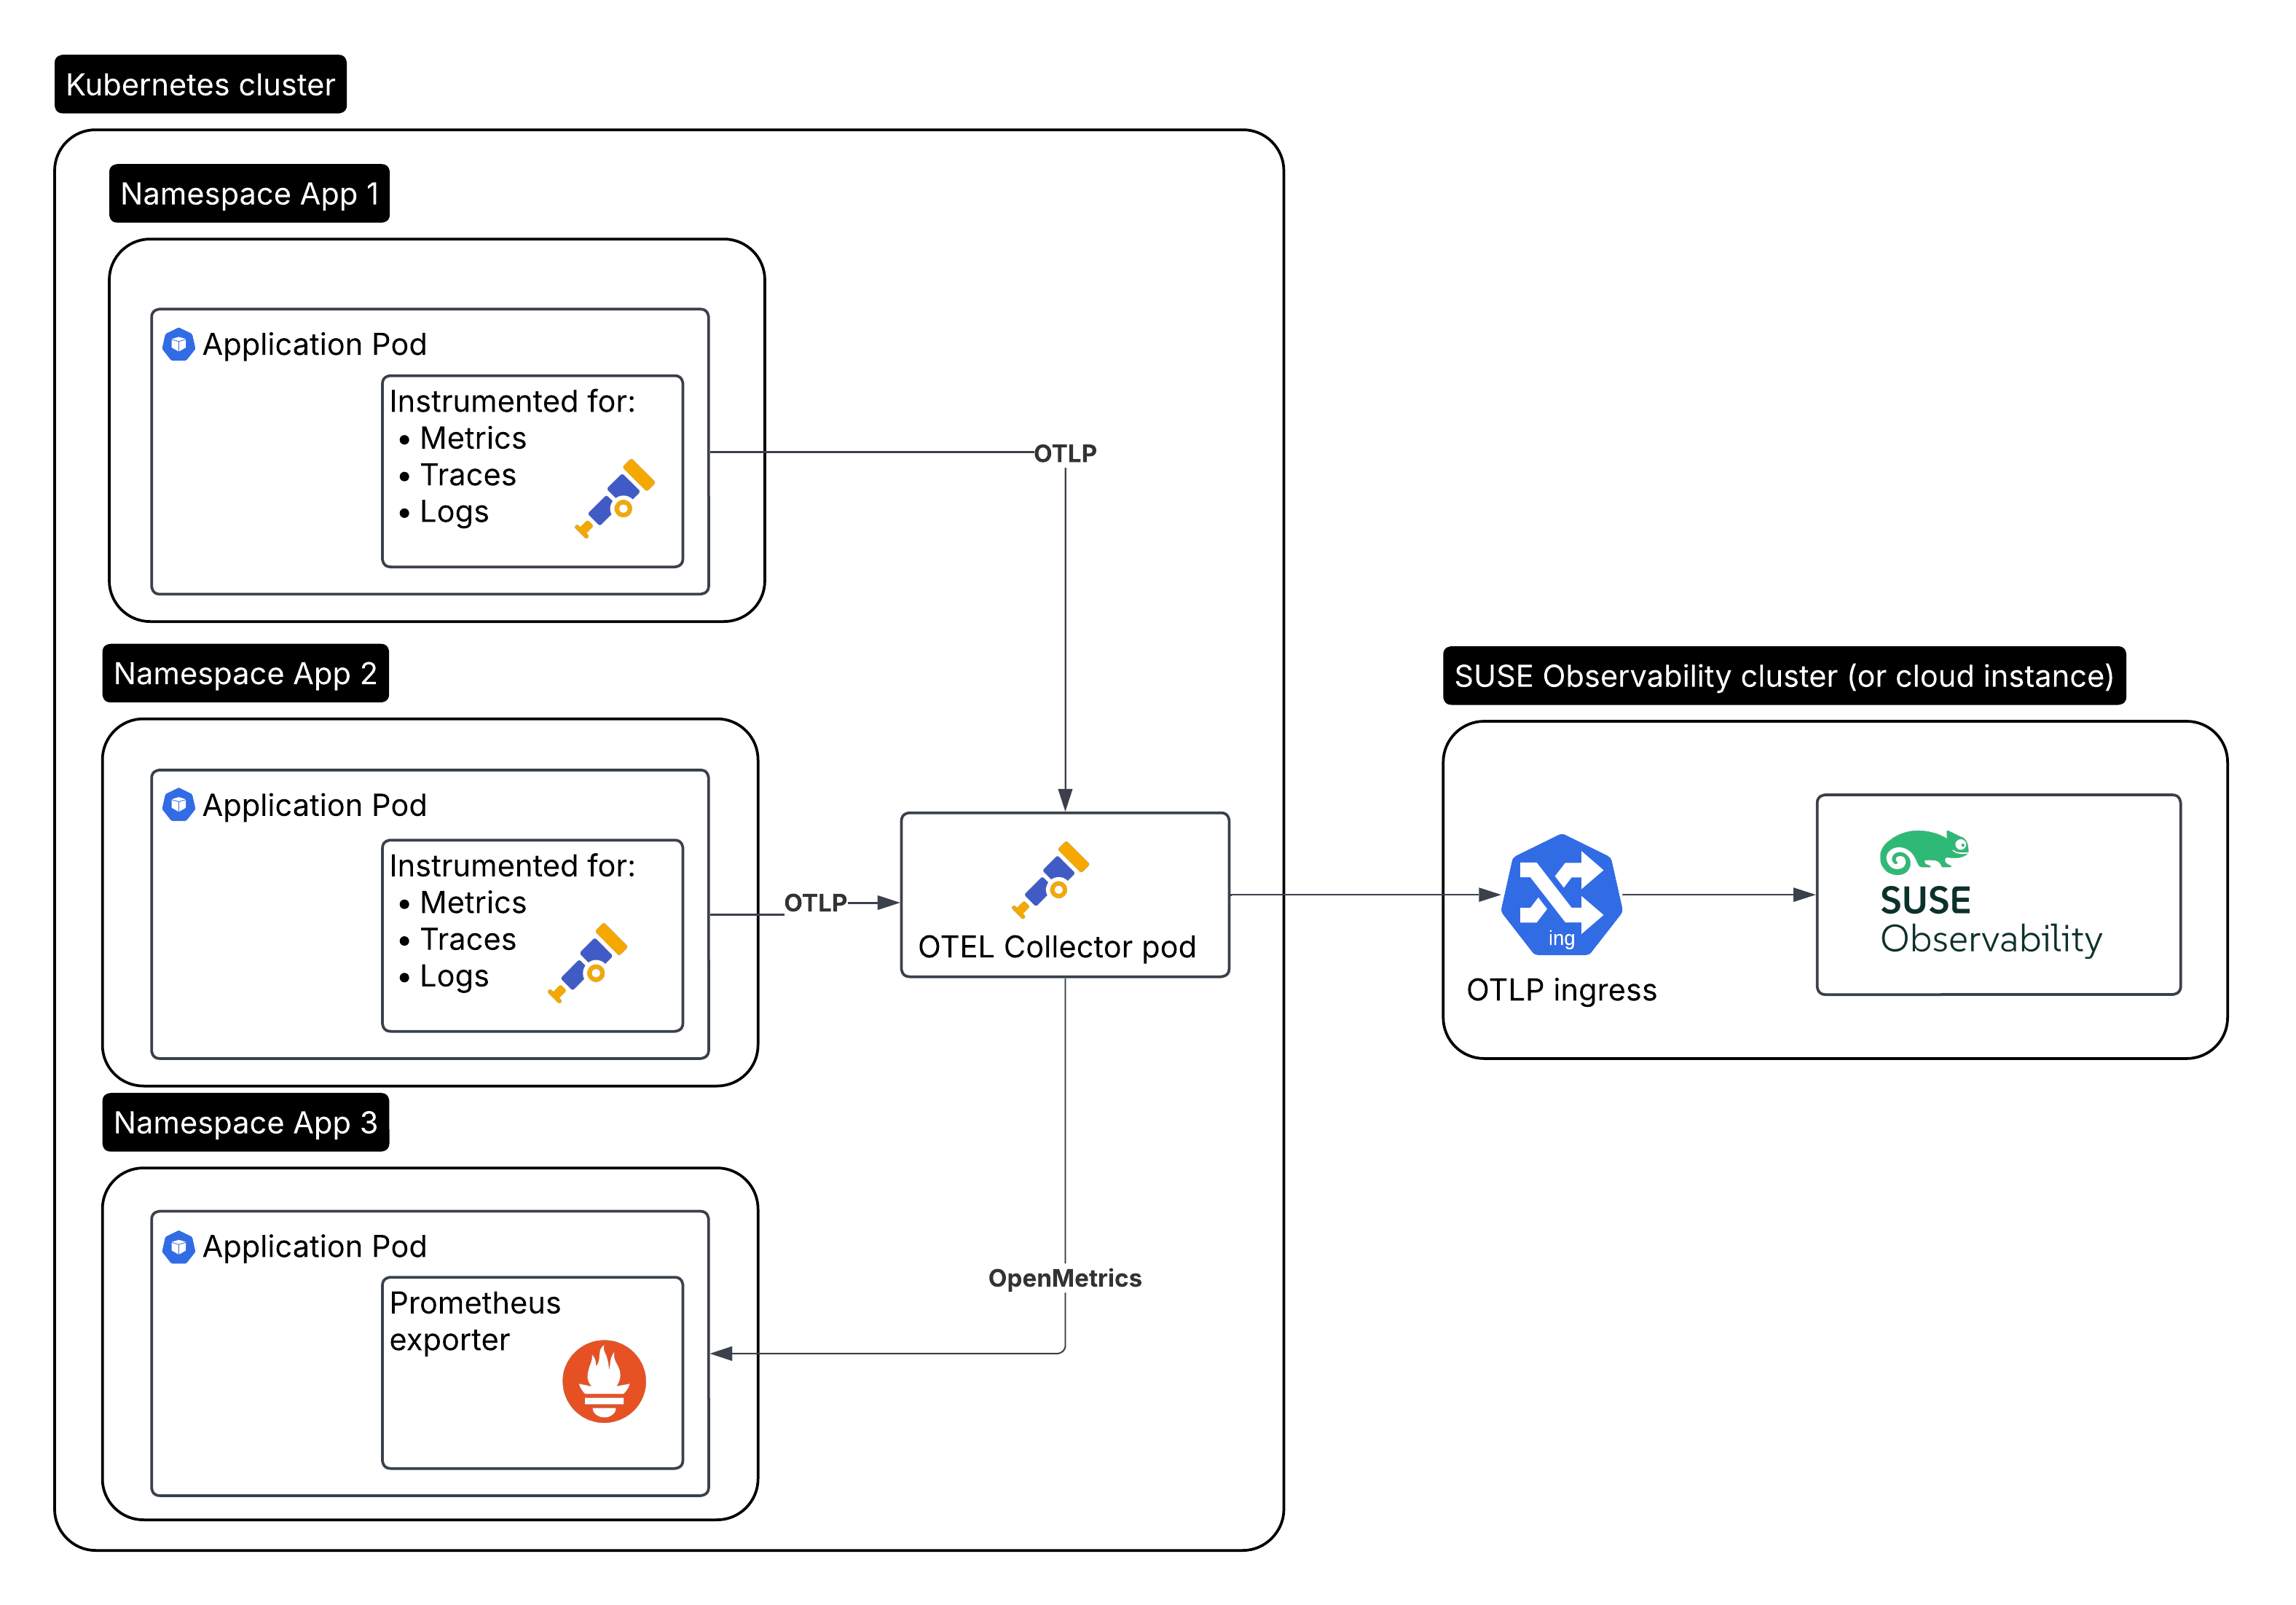
The monitored application/workload running in cluster A.
-
The Open Telemetry collector running near the observed application(s), so in cluster A, and sending the data to SUSE® Observability.
-
SUSE® Observability running in cluster B, or SUSE Cloud Observability.
The Open Telemetry collector
|
For a production setup it is strongly recommended to install the collector, since it allows your service to offload data quickly and the collector can take care of additional handling like retries, batching, encryption or even sensitive data filtering. |
Install the OTel (Open Telemetry) collector in cluster A and configure it to:
-
Receive data from, potentially many, instrumented applications.
-
Enrich collected data with Kubernetes attributes.
-
Generate metrics for traces.
-
Forward the data to SUSE® Observability, including authentication using the service token.
| SUSE® Observability also retries sending data when there are connection problems. |
Create a Service Token
There are two ways to create a service token:
-
SUSE® Observability UI - open the main menu by clicking in the top left of the screen and go to
StackPacks>Open Telemetry. If you have not done so before, click theINSTALLbutton. Click theCREATE NEW SERVICE TOKENbutton and copy the value onto your clipboard. -
SUSE® Observability CLI - see Manage service tokens
The service token value must be used where the instructions below mention <SERVICE_TOKEN>.
Create the namespace and a secret for the service token
Install in the open-telemetry namespace and use the service token:
kubectl create namespace open-telemetry
kubectl create secret generic open-telemetry-collector \
    --namespace open-telemetry \
    --from-literal=API_KEY='<SERVICE_TOKEN>'
Configure and install the collector
We install the collector with the Helm chart provided by the SUSE Application Collection. Please check their authentication guide to configure Application Collection OCI credentials in your Kubernetes cluster.
|
A service token must be used instead of api key as they are synonymous. Any environment variable that continues to refer to API_KEY is for backwards compatibility. |
Create a otel-collector.yaml values file for the Helm chart. Here is a good starting point for usage with SUSE® Observability, replace <otlp-suse-observability-endpoint:port> with your OTLP endpoint (see OTLP API for your endpoint) and insert the name for your Kubernetes cluster instead of <your-cluster-name>:
# Set the service token from the secret as an env var:
extraEnvsFrom:
  - secretRef:
      name: open-telemetry-collector
mode: deployment
ports:
  metrics:
    enabled: true
presets:
  kubernetesAttributes:
    enabled: true
    extractAllPodLabels: true
# This is the config file for the collector:
config:
  receivers:
    otlp:
      protocols:
        grpc:
          endpoint: 0.0.0.0:4317
        http:
          endpoint: 0.0.0.0:4318
    # Scrape the collectors own metrics
    prometheus:
      config:
        scrape_configs:
        - job_name: opentelemetry-collector
          scrape_interval: 30s
          static_configs:
          - targets:
            - ${env:MY_POD_IP}:8888
            labels:
              k8s.pod.ip: ${env:MY_POD_IP}
  extensions:
    # Use the service token from the env for authentication
    bearertokenauth:
      scheme: SUSEObservability
      token: "${env:API_KEY}"
  exporters:
    nop: {}
    otlp/suse-observability:
      auth:
        authenticator: bearertokenauth
      # Put in your own otlp endpoint, for example otlp-suse-observability.my.company.com:443
      endpoint: <otlp-suse-observability-endpoint:port>
      compression: snappy
  processors:
    memory_limiter:
      check_interval: 5s
      limit_percentage: 80
      spike_limit_percentage: 25
    batch: {}
    resource:
      attributes:
      - key: k8s.cluster.name
        action: upsert
        # Insert your own cluster name
        value: <your-cluster-name>
      - key: service.instance.id
        from_attribute: k8s.pod.uid
        action: insert
        # Use the k8s namespace also as the open telemetry namespace
      - key: service.namespace
        from_attribute: k8s.namespace.name
        action: insert
  connectors:
    # Generate metrics for spans
    spanmetrics:
      metrics_expiration: 5m
      namespace: otel_span
  service:
    extensions: [ health_check,  bearertokenauth ]
    pipelines:
      traces:
        receivers: [otlp]
        processors: [memory_limiter, resource, batch]
        exporters: [debug, spanmetrics, otlp/suse-observability]
      metrics:
        receivers: [otlp, spanmetrics, prometheus]
        processors: [memory_limiter, resource, batch]
        exporters: [debug, otlp/suse-observability]
      logs:
        receivers: [otlp]
        processors: []
        exporters: [nop]
    telemetry:
      metrics:
        readers:
          - pull:
              exporter:
                prometheus:
                  host: ${env:MY_POD_IP}
port: 8888|
Use the same cluster name as used for installing the SUSE® Observability Agent if you also use the SUSE® Observability agent with the Kubernetes stackpack. Using a different cluster name will result in an empty traces perspective for Kubernetes components and will overall make correlating information much harder for SUSE® Observability and your users. |
Install the collector using the configuration file and the Application Collection image pull secret named application-collection (Application Collection authentication guide):
helm upgrade --install opentelemetry-collector oci://dp.apps.rancher.io/charts/opentelemetry-collector \
  --set global.imagePullSecrets={application-collection} \
  --values otel-collector.yaml \
  --namespace open-telemetry
The collector offers a lot more configuration receivers, processors and exporters, for more details see our collector page. For production usage often large amounts of spans are generated. Hence, set up sampling.
By default, the chart will install the OpenTelemetry Collector Kubernetes Distro, but other distributions are supported. To change the distribution you can override the image tag:
image:
  # Replace the tag with the desired OpenTelemetry Collector version and distribution:
  #   * "0.154.0" (OpenTelemetry Collector Core Distro)
  #   * "0.154.0-contrib" (OpenTelemetry Collector Contrib Distro)
  #   * "0.154.0-k8s" (OpenTelemetry Collector Kubernetes Distro)
  tag: "0.154.0-k8s"
Collect telemetry data from your application
The common way to collect telemetry data is to instrument your application using the Open Telemetry SDK’s.
For other languages follow the documentation on opentelemetry.io and make sure to configure the SDK exporter to ship data to the collector you just installed by following these instructions.
View the results
Go to SUSE® Observability and make sure the Open Telemetry Stackpack is installed (via the main menu -> Stackpacks).
If your pods are getting traffic, you should be able to find them under their service name in the Open Telemetry -> services and service instances overviews. Traces appear in the trace explorer and in the trace perspective for the service and service instance components. Span metrics and language specific metrics (if available) become available in the metrics perspective for the components.
If you also have the Kubernetes stackpack installed the instrumented pods will also have the traces available in the trace perspective.
Rancher RBAC
For Rancher RBAC to work, telemetry data needs to have the following resource attributes present:
-
k8s.cluster.name- the Cluster name as used by the Kubernetes stackpack -
k8s.namespace.name- a Namespace managed by a Rancher Project
This can be achieved by a configuration such as above. There the kubernetesAttributes preset of the opentelemetry-collector Helm chart injects a k8sattributes processor into each pipeline.
Next steps
You can add new charts to components, for example, the service or service instance, for your application, by following our guide. It is also possible to create new monitors using the metrics and setup notifications to get notified when your application is not available or having performance issues.