Custom OpenTelemetry Collector
This guide explains how to configure Admission Controller to send telemetry data to an OpenTelemetry collector already deployed on the cluster.
You should deploy only one instance of the OpenTelemetry Collector in the cluster.
Install dependencies
First, begin by installing the dependencies of OpenTelemetry Collector.
You need encrypted communication between the Admission Controller components and the collector. You can use cert-manager to manage all the certificates required for secure communication.
OpenTelemetry Collector traces get sent to a Jaeger instance.
The Admission Controller stack sends metrics to the OpenTelemetry Collector. This one exposes the metrics as a Prometheus endpoint. The metrics are then collected by a Prometheus instance and stored in its database. The same Prometheus instance also exposes a UI to view and use the metrics.
Resources you create get defined in the kubewarden Namespace, or expect its
existence. Due to that, you should begin by creating the Namespace:
kubectl create namespace kubewardenInstall cert-manager and OpenTelemetry
You install cert-manager and OpenTelemetry operator in this way:
helm repo add jetstack https://charts.jetstack.io
helm install --wait \
  --namespace cert-manager \
  --create-namespace \
  --set crds.enabled=true \
  --version 1.15.1 \
  cert-manager jetstack/cert-manager

helm repo add open-telemetry https://open-telemetry.github.io/opentelemetry-helm-charts
helm install --wait \
  --namespace open-telemetry \
  --create-namespace \
  --version 0.65.0 \
  --set "manager.collectorImage.repository=otel/opentelemetry-collector-contrib" \
  my-opentelemetry-operator open-telemetry/opentelemetry-operator
You setup communication between Admission Controller components and the OpenTelemetry Collector using mTLS.
To do that, you need to create the whole Public Key Infrastructure (PKI):
# pki.yaml file
apiVersion: cert-manager.io/v1
kind: Certificate
metadata:
  name: my-client-certificate
  namespace: kubewarden
spec:
  dnsNames:
  - kubewarden.kubewarden.svc
  - kubewarden.kubewarden.svc.cluster.local
  issuerRef:
  kind: Issuer
  name: my-selfsigned-issuer
  secretName: my-client-cert
---
apiVersion: cert-manager.io/v1
kind: Certificate
metadata:
  name: my-certificate
  namespace: kubewarden
spec:
  dnsNames:
  - my-collector-collector.kubewarden.svc
  - my-collector-collector.kubewarden.svc.cluster.local
  issuerRef:
  kind: Issuer
  name: my-selfsigned-issuer
  secretName: my-server-cert
---
apiVersion: cert-manager.io/v1
kind: Issuer
metadata:
  name: my-selfsigned-issuer
  namespace: kubewarden
spec:
  selfSigned: {}
Apply the manifest:
kubectl apply -f pki.yamlInstall Jaeger and Prometheus
After that, you install Jaeger to store and visualize trace events.
helm repo add jaegertracing https://jaegertracing.github.io/helm-charts
helm upgrade -i --wait \
  --namespace jaeger \
  --create-namespace \
  --version 2.49.0 \
  jaeger-operator jaegertracing/jaeger-operator \
  --set rbac.clusterRole=true

kubectl apply -f - <<EOF
apiVersion: jaegertracing.io/v1
kind: Jaeger
metadata:
  name: my-open-telemetry
  namespace: jaeger
spec:
  ingress:
  enabled: true
  annotations:
    kubernetes.io/ingress.class: nginx
EOF
Now you install Prometheus to store and visualize metrics.
cat <<EOF > kube-prometheus-stack-values.yaml
prometheus:
  additionalServiceMonitors:
  - name: kubewarden
    selector:
    matchLabels:
      app.kubernetes.io/instance: kubewarden.my-collector
    namespaceSelector:
    matchNames:
      - kubewarden
    endpoints:
    - port: prometheus
    interval: 10s
EOF

helm repo add prometheus-community https://prometheus-community.github.io/helm-charts
helm install --wait --create-namespace \
  --namespace prometheus \
  --version 51.5.3 \
  --values kube-prometheus-stack-values.yaml \
prometheus prometheus-community/kube-prometheus-stack|
The Prometheus service monitor obtains the Admission Controller metrics by
scraping the OpenTelemetry collector running in the |
Install OpenTelemetry Collector
Now you can deploy a custom OpenTelemetry Collector in the kubewarden
Namespace.
# otel-collector.yaml file
apiVersion: opentelemetry.io/v1beta1
kind: OpenTelemetryCollector
metadata:
  name: my-collector
  namespace: kubewarden
spec:
  mode: deployment # This configuration is omittable.
  volumes:
  - name: server-certificate
    secret:
    secretName: my-server-cert
  - name: client-certificate
    secret:
    secretName: my-client-cert
  volumeMounts:
  - name: server-certificate
    mountPath: /tmp/etc/ssl/certs/my-server-cert
    readOnly: true
  - name: client-certificate
    mountPath: /tmp/etc/ssl/certs/my-client-cert
    readOnly: true
  config:
  receivers:
    otlp:
    protocols:
      grpc:
      tls:
        cert_file: /tmp/etc/ssl/certs/my-server-cert/tls.crt
        key_file: /tmp/etc/ssl/certs/my-server-cert/tls.key
        client_ca_file: /tmp/etc/ssl/certs/my-client-cert/ca.crt
  processors: {}
  exporters:
    debug:
    verbosity: normal
    prometheus:
    endpoint: ":8080"
    otlp/jaeger:
    endpoint: "my-open-telemetry-collector.jaeger.svc.cluster.local:4317"
    tls:
      insecure: true
  service:
    pipelines:
    metrics:
      receivers: [otlp]
      processors: []
      exporters: [debug, prometheus]
    traces:
      receivers: [otlp]
      processors: []
      exporters: [debug, otlp/jaeger]
Apply the manifest:
kubectl apply -f otel-collector.yamlThat configuration uses a trivial processing pipeline to receive trace events and to forward them to Jaeger. It also receives metrics and exposes them for collection by Prometheus.
You secure communication between the Admission Controller stack and the OpenTelemetry Collector using mTLS. However the communication between the OpenTelemetry Collector and Jaeger isn’t secured, to reduce the complexity of the example.
Install Admission Controller stack
When the OpenTelemetry Collector is running, you can deploy Admission Controller in the usual way.
You need to configure the Admission Controller components so they send events and metrics to the OpenTelemetry Collector.
# values.yaml
telemetry:
  mode: custom
  metrics: True
  tracing: True
  custom:
  endpoint: "https://my-collector-collector.kubewarden.svc:4317"
  insecure: false
  otelCollectorCertificateSecret: "my-server-cert"
  otelCollectorClientCertificateSecret: "my-client-cert"
The Secret referenced by the otelCollectorCertificateSecret key must have an
entry named ca.crt. That holds the certificate of the CA that issued the
certificate used by the OpenTelemetry Collector.
The Secret referenced by the otelCollectorClientCertificateSecret key must
have the following entries: tls.crt and tls.key keys. These are the client
certificate and its key used by the Admission Controller stack to authenticate
against the OpenTelemetry Collector.
Leave these values empty if you don’t use encryption or mTLS.
Install the Admission Controller stack:
helm install --wait \
  --namespace kubewarden --create-namespace \
  kubewarden-crds kubewarden/kubewarden-crds
helm install --wait \
  --namespace kubewarden \
  --create-namespace \
  --values values.yaml \
  kubewarden-controller kubewarden/kubewarden-controller
helm install --wait \
  --namespace kubewarden \
  --create-namespace \
  kubewarden-defaults kubewarden/kubewarden-defaults \
  --set recommendedPolicies.enabled=True \
  --set recommendedPolicies.defaultPolicyMode=monitor
Now everything is in place.
Exploring the Jaeger UI
You can see the trace events generated by Admission Controller by using the
Jaeger web UI. They’re grouped under the kubewarden-policy-server service:
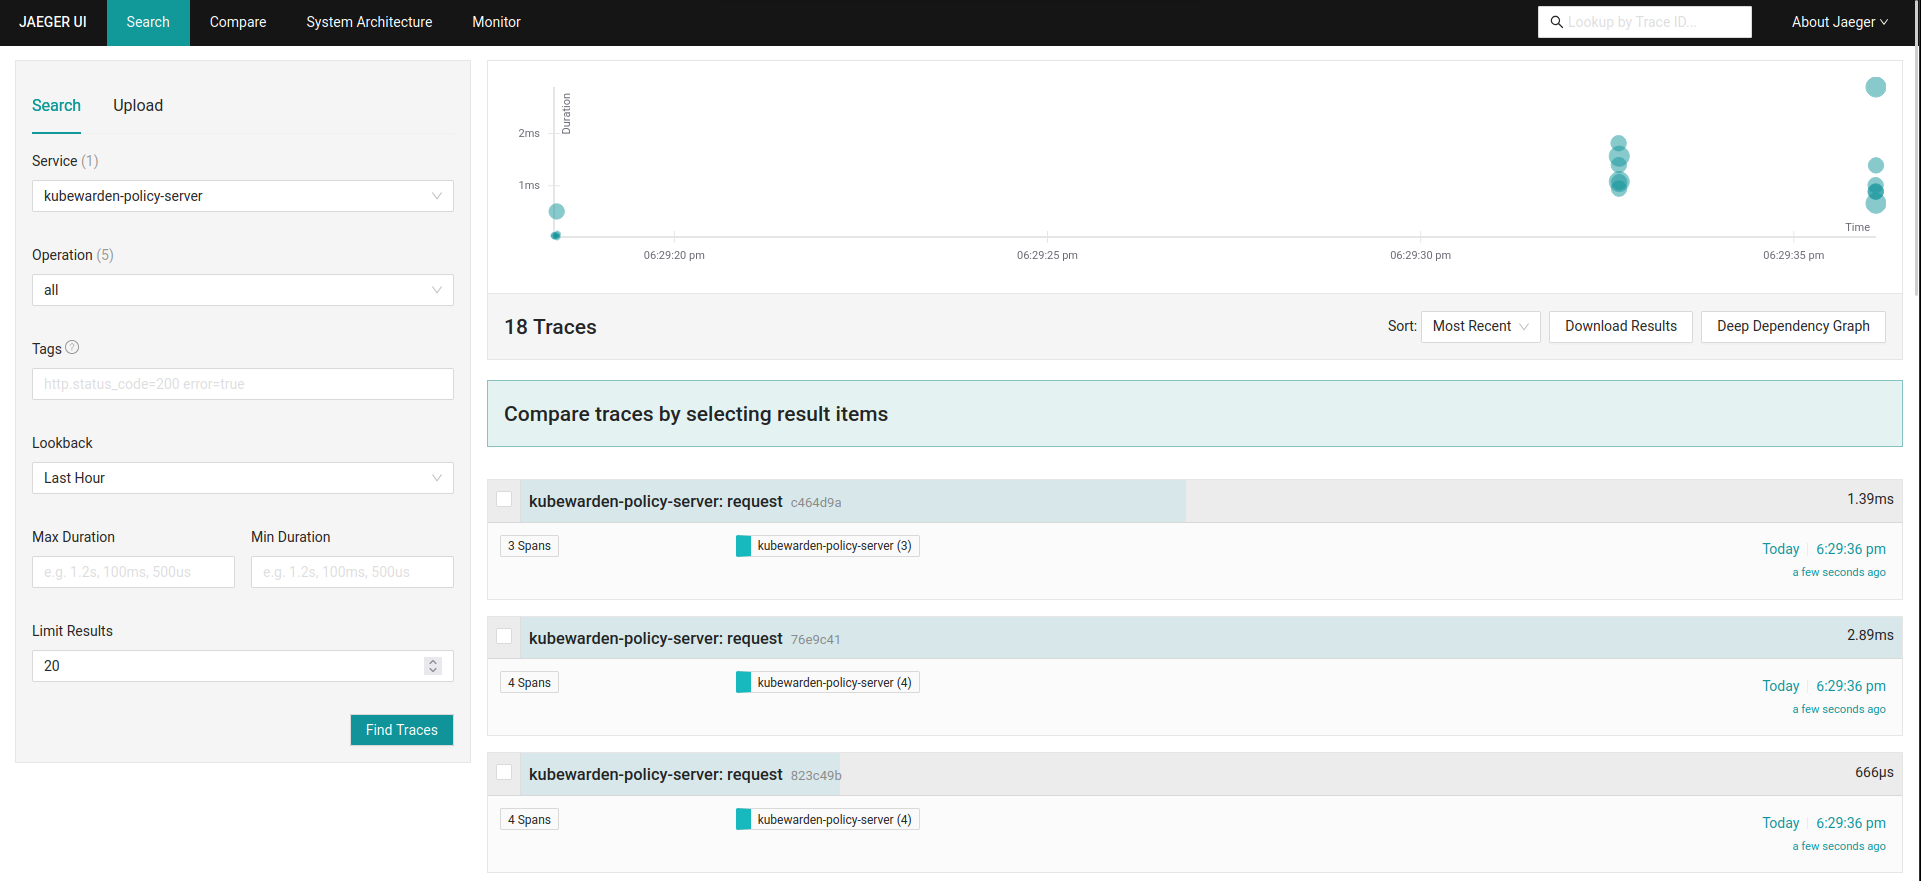
To access the Jaeger UI, you can create an Ingress or you can do a port forwarding to your local machine:
kubectl -n jaeger port-forward service/my-open-telemetry-query 16686The web UI is reachable at http://localhost:16686.