Problèmes de surveillance
La surveillance est inutilisable
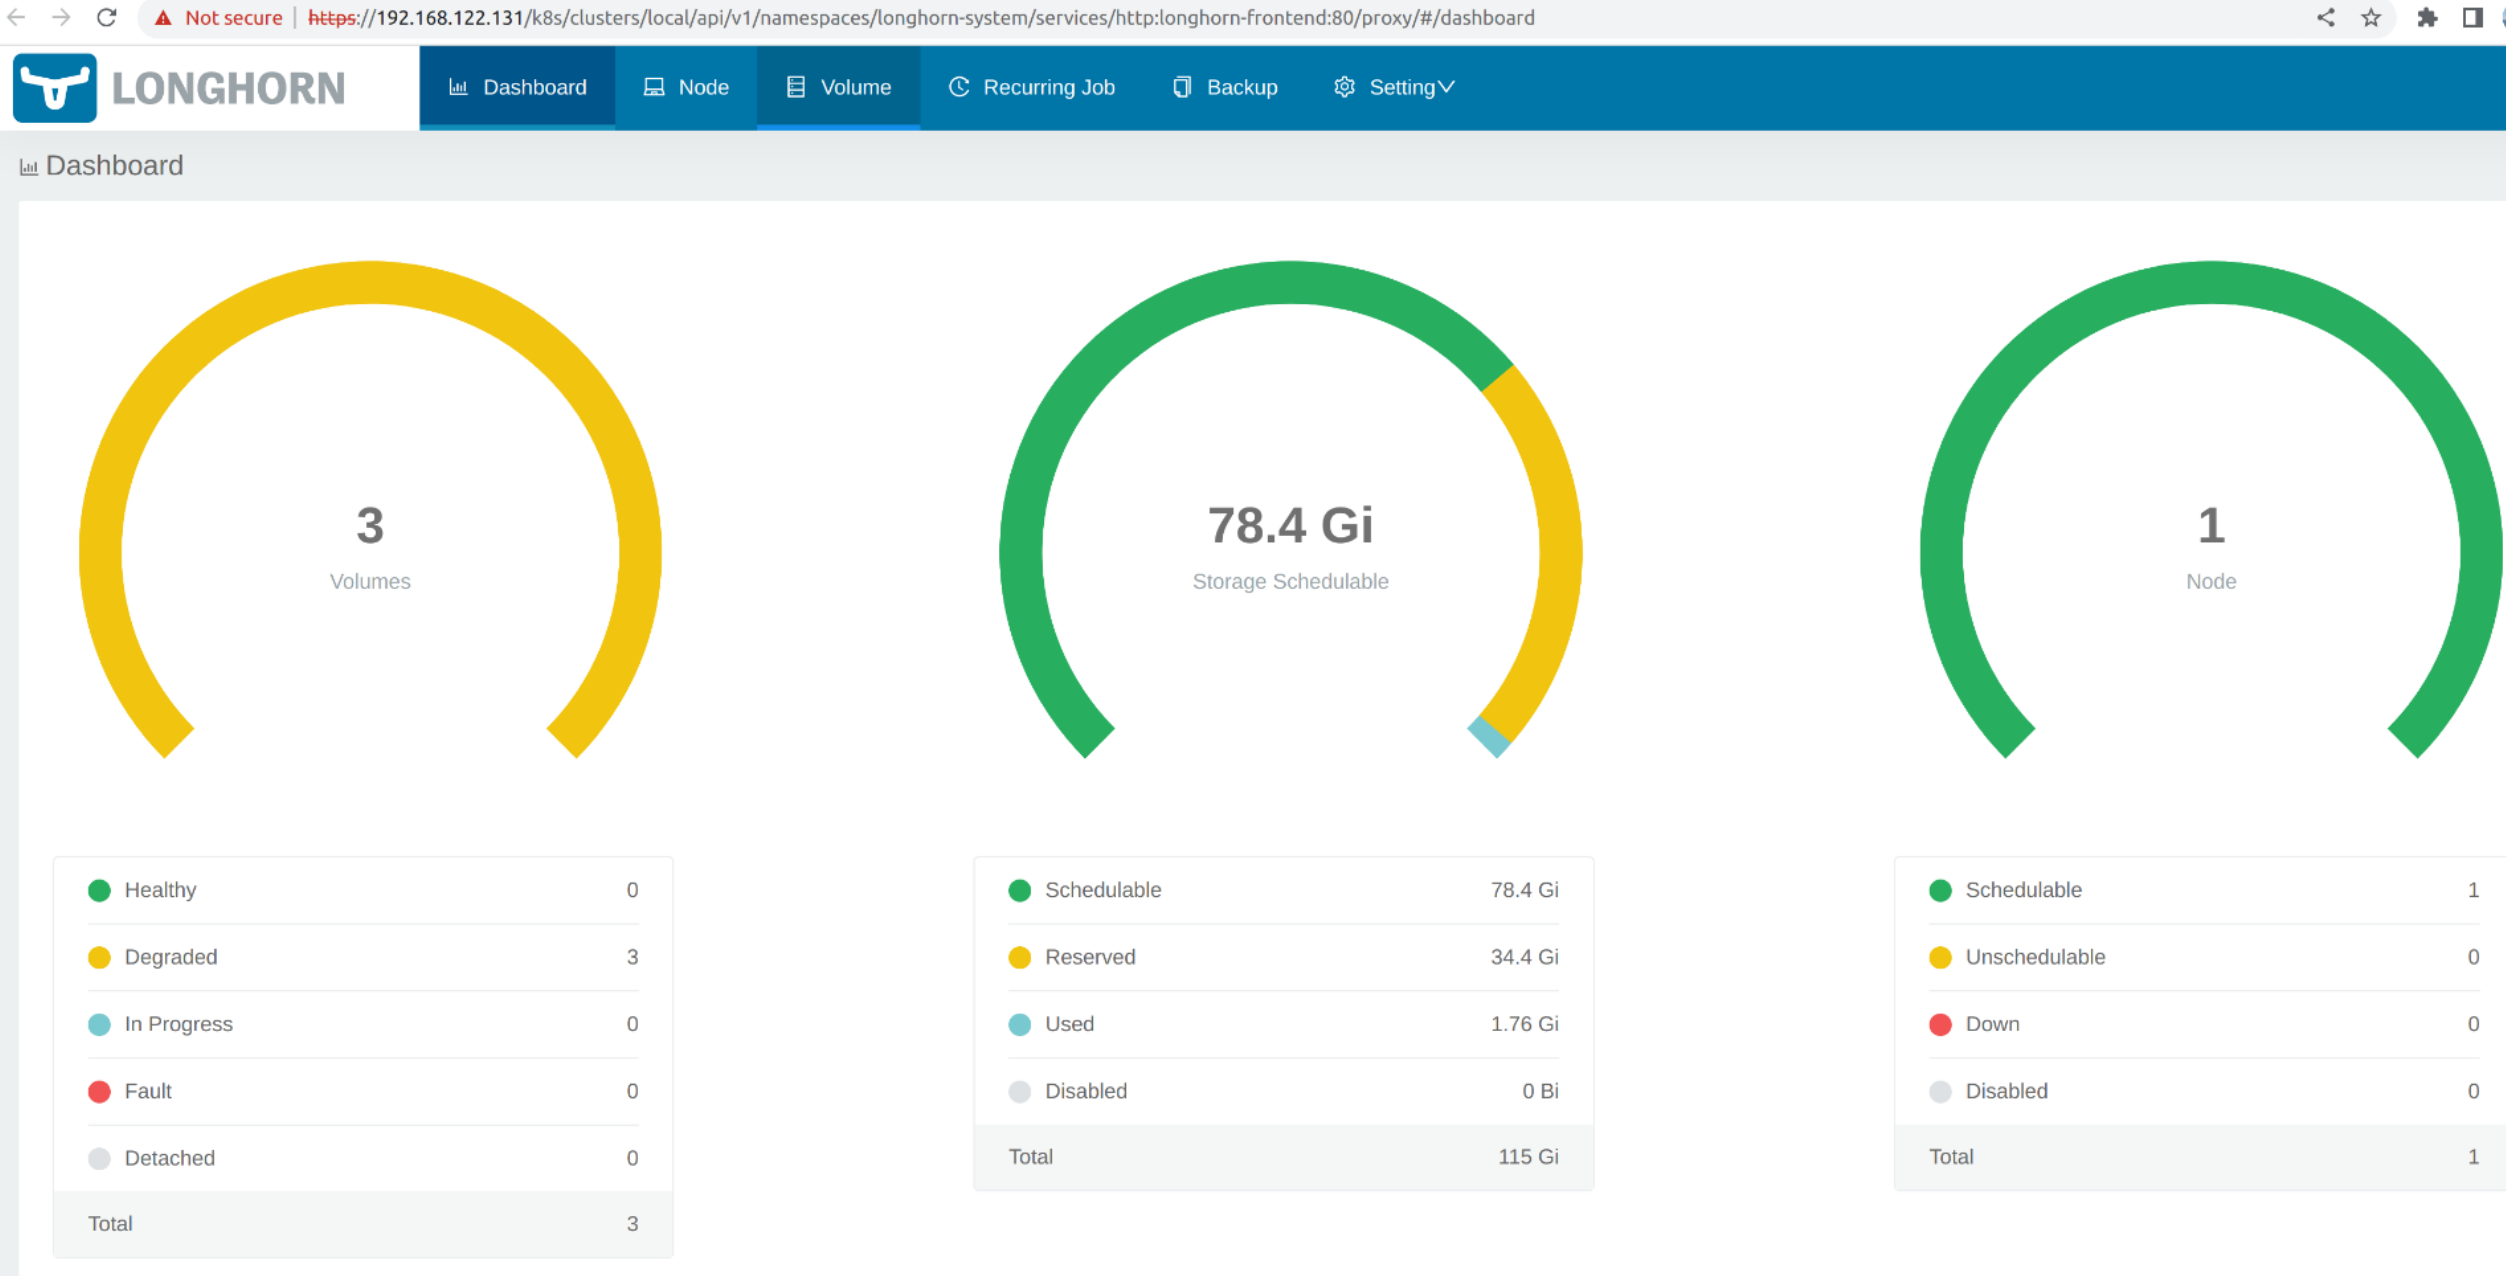
Lorsque le SUSE Virtualization tableau de bord n’affiche aucune métrique de surveillance, cela peut être causé par les raisons suivantes.
La surveillance est inutilisable en raison d’un Pod bloqué dans l’état Terminating
SUSE Virtualization Les pods de surveillance sont déployés aléatoirement sur les nœuds du cluster. Lorsque le nœud hébergeant les pods tombe accidentellement en panne, les pods concernés peuvent rester bloqués dans l’état Terminating, rendant la surveillance inutilisable depuis l’interface Web.
$ kubectl get pods -n cattle-monitoring-system

NAMESPACE                   NAME                                                     READY   STATUS        RESTARTS   AGE
cattle-monitoring-system    prometheus-rancher-monitoring-prometheus-0               3/3     Terminating   0          3d23h
cattle-monitoring-system    rancher-monitoring-admission-create-fwjn9                0/1     Terminating   0          137m
cattle-monitoring-system    rancher-monitoring-crd-create-9wtzf                      0/1     Terminating   0          137m
cattle-monitoring-system    rancher-monitoring-grafana-d9c56d79b-ph4nz               3/3     Terminating   0          3d23h
cattle-monitoring-system    rancher-monitoring-grafana-d9c56d79b-t24sz               0/3     Init:0/2      0          132m

cattle-monitoring-system    rancher-monitoring-kube-state-metrics-5bc8bb48bd-nbd92   1/1     Running       4          4d1h
...
La surveillance peut être récupérée en utilisant des commandes CLI pour forcer la suppression des pods concernés. Le cluster redéploiera de nouveaux pods pour les remplacer.
# Delete each none-running Pod in namespace cattle-monitoring-system.

$ kubectl delete pod --force -n cattle-monitoring-system prometheus-rancher-monitoring-prometheus-0

 pod "prometheus-rancher-monitoring-prometheus-0" force deleted


$ kubectl delete pod --force -n cattle-monitoring-system rancher-monitoring-admission-create-fwjn9

$ kubectl delete pod --force -n cattle-monitoring-system rancher-monitoring-crd-create-9wtzf

$ kubectl delete pod --force -n cattle-monitoring-system rancher-monitoring-grafana-d9c56d79b-ph4nz

$ kubectl delete pod --force -n cattle-monitoring-system rancher-monitoring-grafana-d9c56d79b-t24sz
Attendez quelques minutes pour que les nouveaux pods soient créés et prêts à rendre le tableau de bord de surveillance à nouveau utilisable.
$ kubectl get pods -n cattle-monitoring-system

NAME                                                     READY   STATUS     RESTARTS   AGE
prometheus-rancher-monitoring-prometheus-0               0/3     Init:0/1   0          98s
rancher-monitoring-grafana-d9c56d79b-cp86w               0/3     Init:0/2   0          27s
...

$ kubectl get pods -n cattle-monitoring-system

NAME                                                     READY   STATUS    RESTARTS   AGE
prometheus-rancher-monitoring-prometheus-0               3/3     Running   0          7m57s
rancher-monitoring-grafana-d9c56d79b-cp86w               3/3     Running   0          6m46s
...
Étendre la taille du PV/Volume
SUSE Virtualization intègre SUSE Storage comme fournisseur de stockage par défaut.
SUSE Virtualization La surveillance utilise un Volume Persistant (PV) pour stocker les données en cours d’exécution. Lorsqu’un cluster fonctionne depuis un certain temps, le Volume Persistant peut nécessiter d’étendre sa taille.
Pour des informations sur la façon d’augmenter la taille du volume, voir Expansion de Volume dans SUSE Storage la documentation.
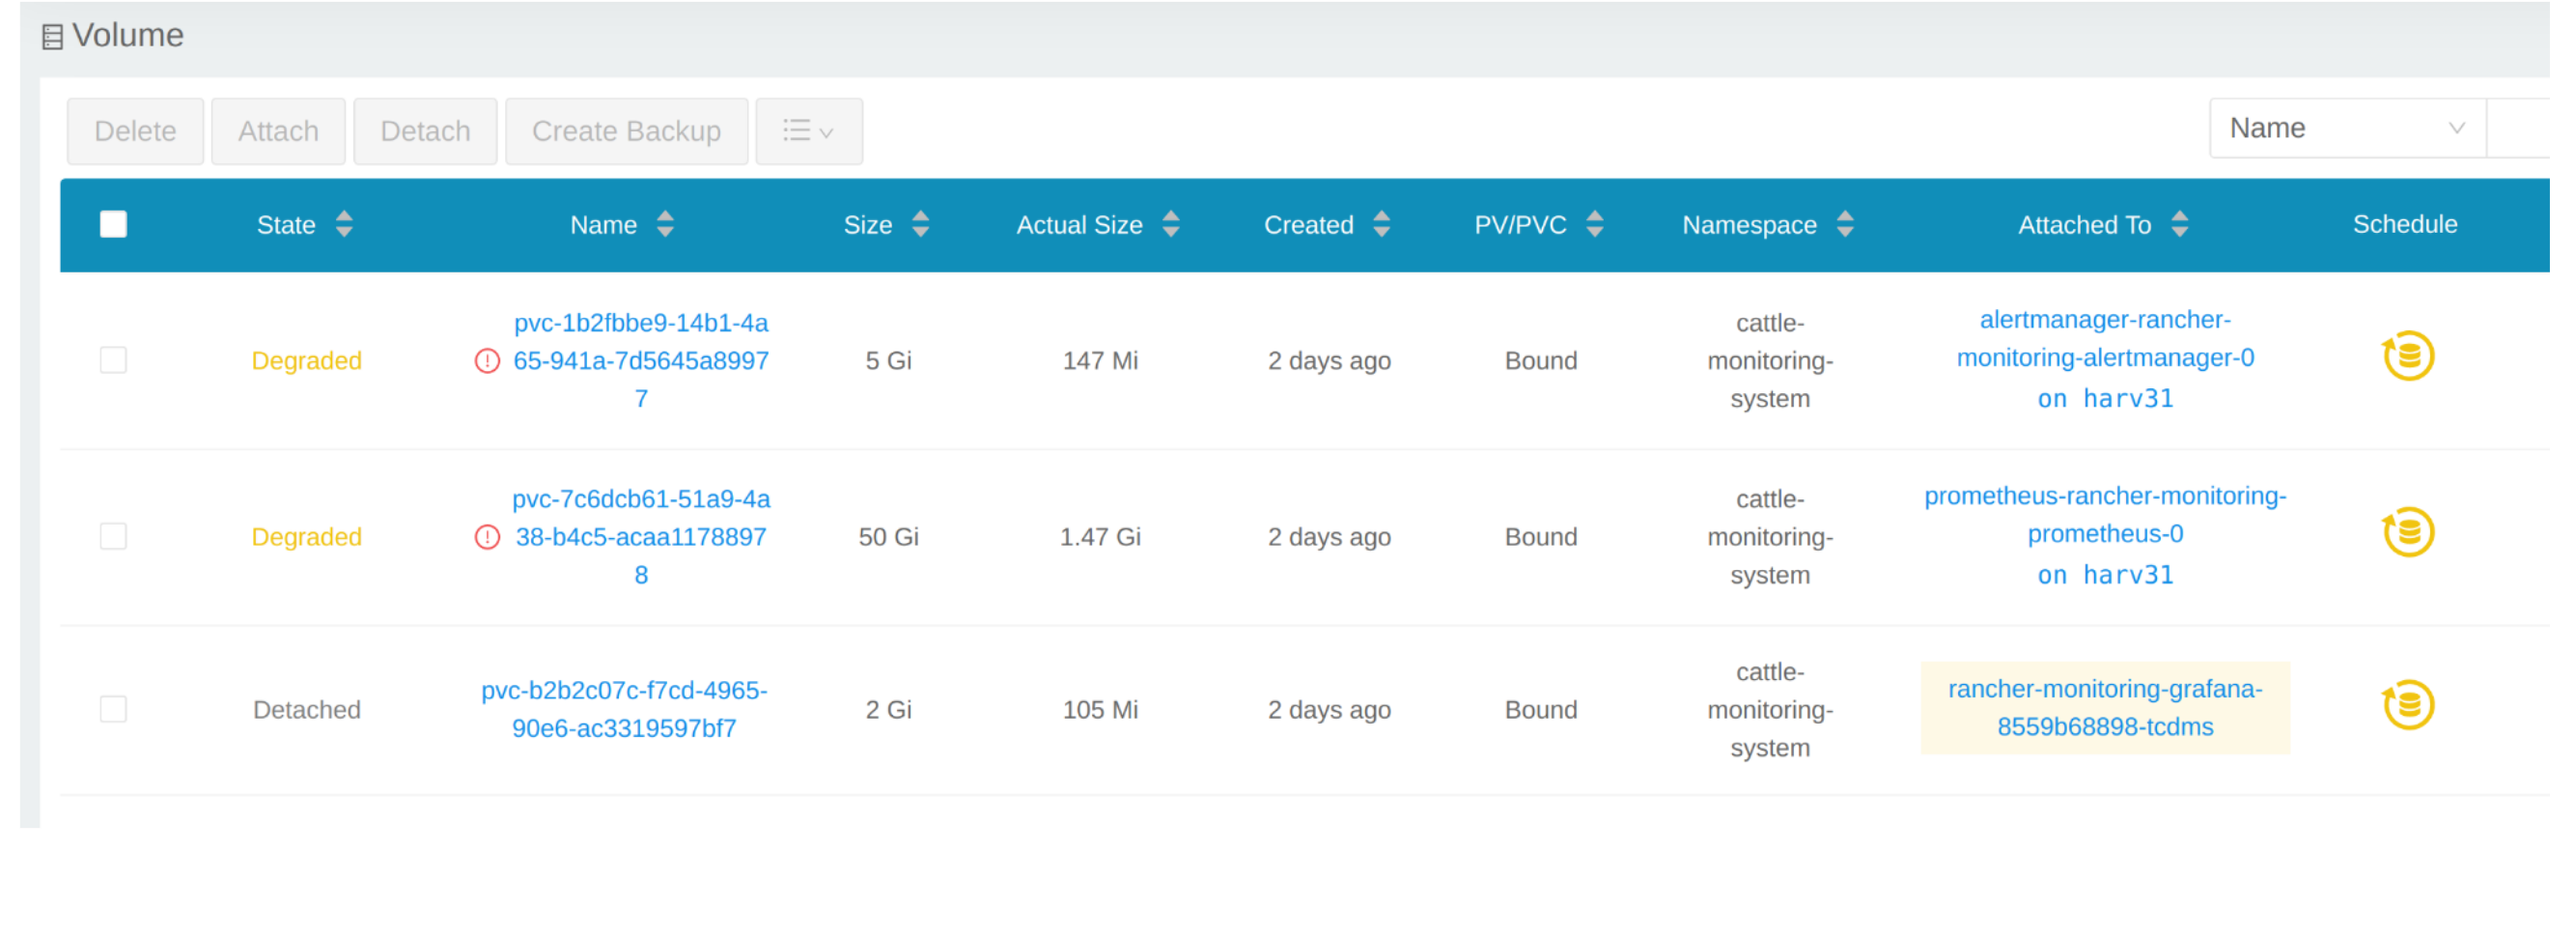
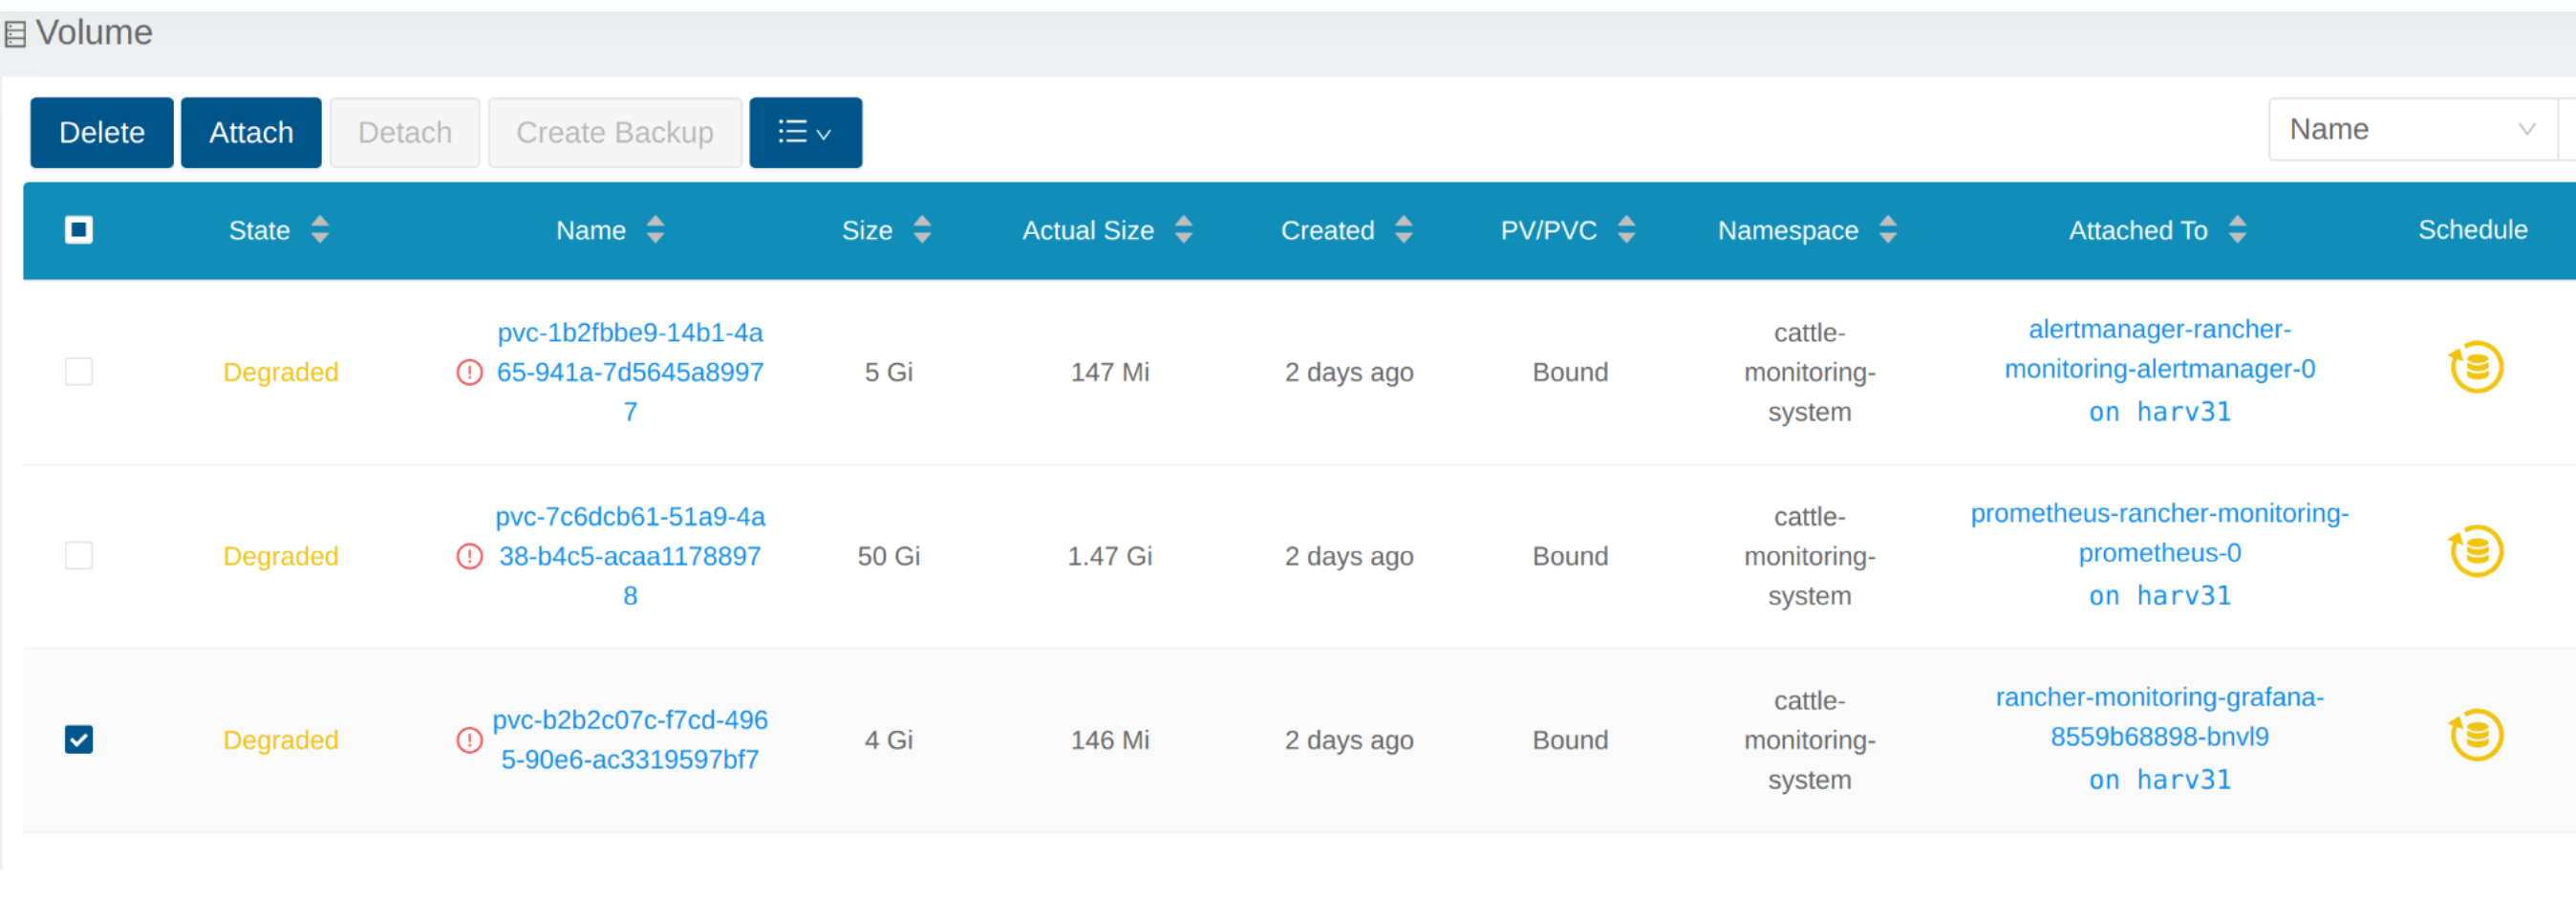
Voir le Volume
Depuis l’interface utilisateur intégrée SUSE Storage
Accédez à l’interface utilisateur intégrée SUSE Storage selon ce document.
SUSE Storage La vue par défaut du tableau de bord.
Cliquez sur Volume pour lister tous les volumes existants.
Depuis la CLI
Vous pouvez également utiliser kubectl pour obtenir tous les volumes.
# kubectl get pvc -A
NAMESPACE                  NAME                                                                                             STATUS   VOLUME                                     CAPACITY   ACCESS MODES   STORAGECLASS         AGE
cattle-monitoring-system   alertmanager-rancher-monitoring-alertmanager-db-alertmanager-rancher-monitoring-alertmanager-0   Bound    pvc-1b2fbbe9-14b1-4a65-941a-7d5645a89977   5Gi        RWO            harvester-longhorn   43h
cattle-monitoring-system   prometheus-rancher-monitoring-prometheus-db-prometheus-rancher-monitoring-prometheus-0           Bound    pvc-7c6dcb61-51a9-4a38-b4c5-acaa11788978   50Gi       RWO            harvester-longhorn   43h
cattle-monitoring-system   rancher-monitoring-grafana                                                                       Bound    pvc-b2b2c07c-f7cd-4965-90e6-ac3319597bf7   2Gi        RWO            harvester-longhorn   43h

# kubectl get volume -A
NAMESPACE         NAME                                       STATE      ROBUSTNESS   SCHEDULED   SIZE          NODE     AGE
longhorn-system   pvc-1b2fbbe9-14b1-4a65-941a-7d5645a89977   attached   degraded                 5368709120    harv31   43h
longhorn-system   pvc-7c6dcb61-51a9-4a38-b4c5-acaa11788978   attached   degraded                 53687091200   harv31   43h
longhorn-system   pvc-b2b2c07c-f7cd-4965-90e6-ac3319597bf7   attached   degraded                 2147483648    harv31   43h
Réduire un déploiement
Pour détacher le Volume, vous devez réduire le deployment qui utilise le Volume.
L’exemple ci-dessous concerne le PVC revendiqué par rancher-monitoring-grafana.
Trouvez le deployment dans l’espace de noms cattle-monitoring-system.
# kubectl get deployment -n cattle-monitoring-system
NAME                                    READY   UP-TO-DATE   AVAILABLE   AGE
rancher-monitoring-grafana              1/1     1            1           43h  // target deployment
rancher-monitoring-kube-state-metrics   1/1     1            1           43h
rancher-monitoring-operator             1/1     1            1           43h
rancher-monitoring-prometheus-adapter   1/1     1            1           43h
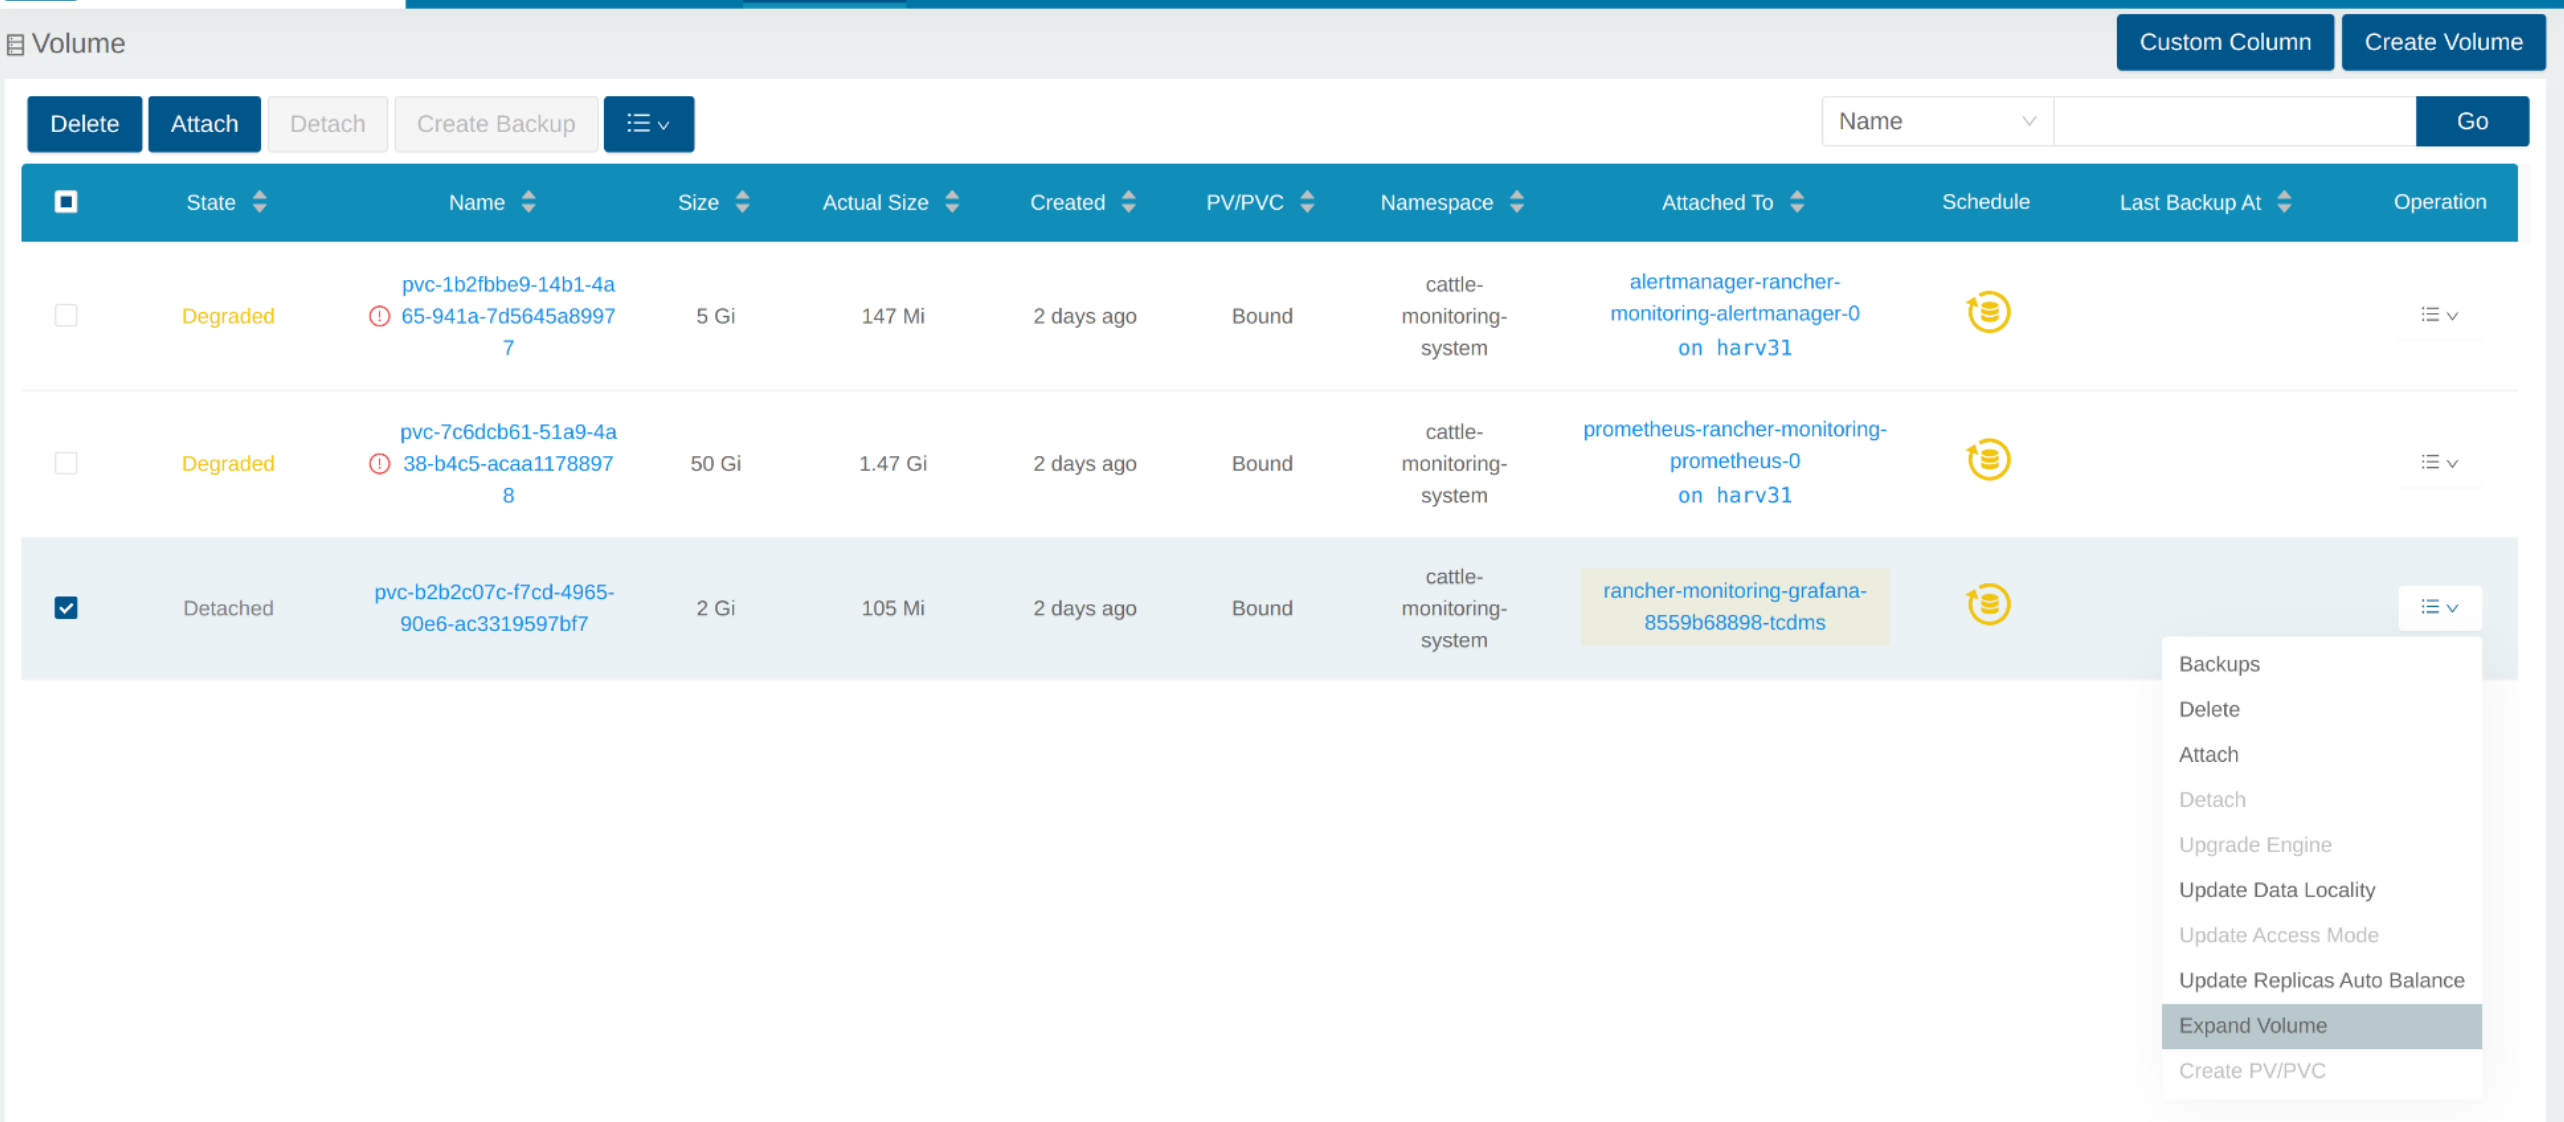
Réduisez le déploiement rancher-monitoring-grafana à 0.
# kubectl scale --replicas=0 deployment/rancher-monitoring-grafana -n cattle-monitoring-system
Vérifiez le déploiement et le volume.
# kubectl get deployment -n cattle-monitoring-system
NAME                                    READY   UP-TO-DATE   AVAILABLE   AGE
rancher-monitoring-grafana              0/0     0            0           43h  // scaled down
rancher-monitoring-kube-state-metrics   1/1     1            1           43h
rancher-monitoring-operator             1/1     1            1           43h
rancher-monitoring-prometheus-adapter   1/1     1            1           43h

# kubectl get volume -A
NAMESPACE         NAME                                       STATE      ROBUSTNESS   SCHEDULED   SIZE          NODE     AGE
longhorn-system   pvc-1b2fbbe9-14b1-4a65-941a-7d5645a89977   attached   degraded                 5368709120    harv31   43h
longhorn-system   pvc-7c6dcb61-51a9-4a38-b4c5-acaa11788978   attached   degraded                 53687091200   harv31   43h
longhorn-system   pvc-b2b2c07c-f7cd-4965-90e6-ac3319597bf7   detached   unknown                  2147483648             43h  // volume is detached
Étendre le volume
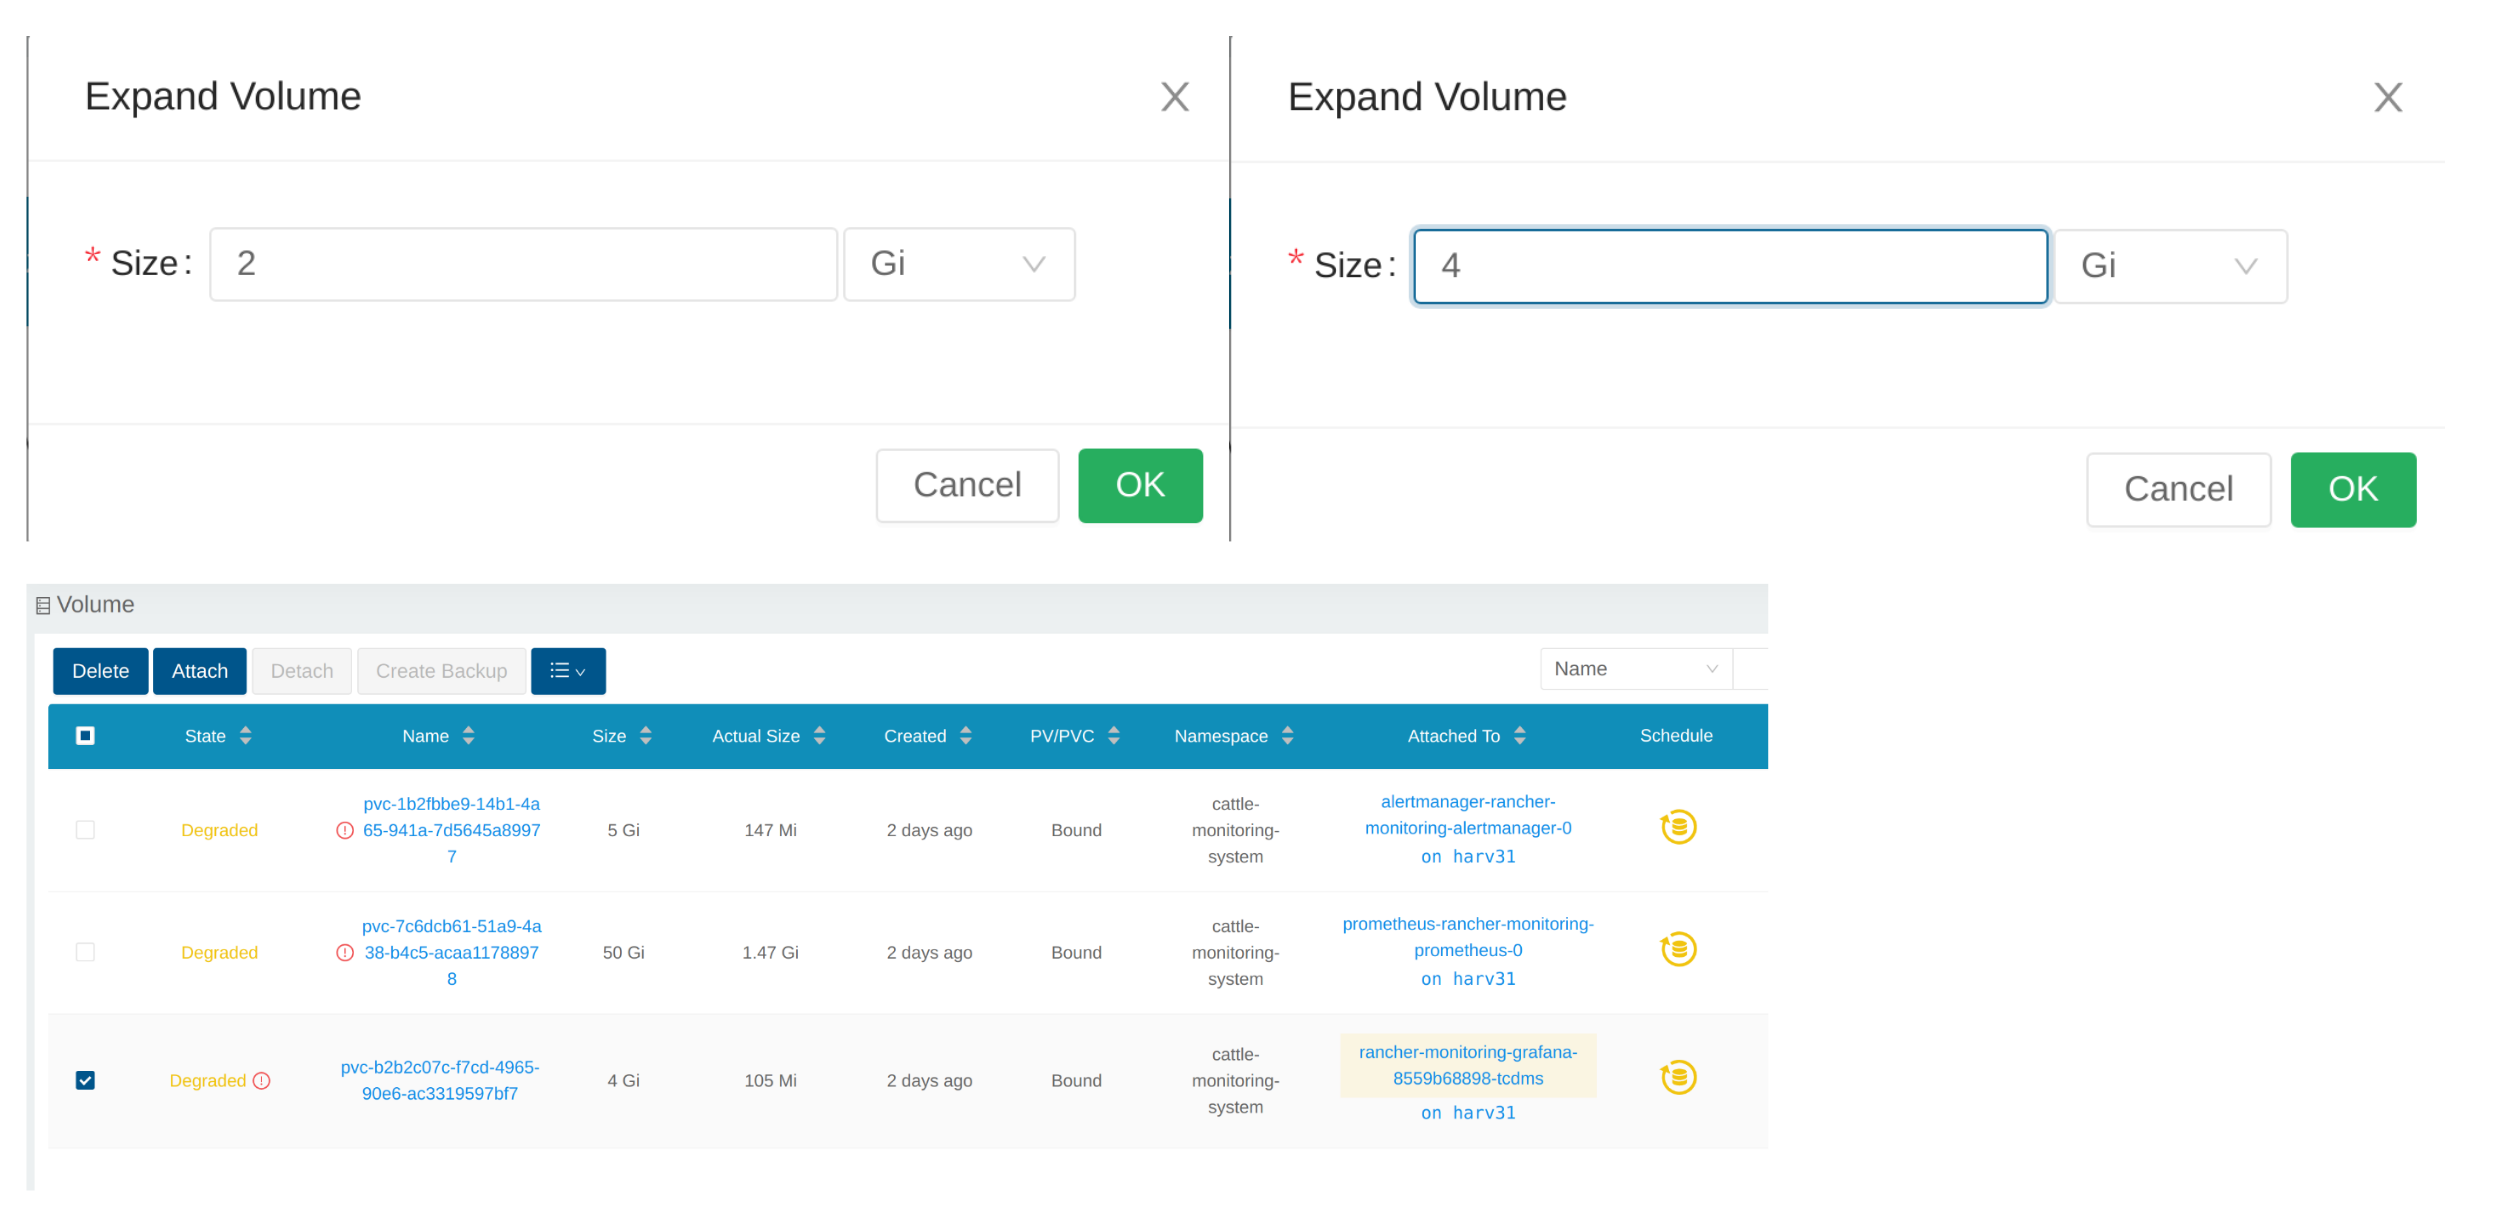
Dans l’interface utilisateur SUSE Storage, le volume associé devient Detached. Cliquez sur l’icône dans la colonne Operation, et sélectionnez Expand Volume.
Entrez une nouvelle taille, et SUSE Storage étendra le volume à cette taille.
Augmenter un déploiement
Après que le Volume soit étendu à la taille cible, vous devez augmenter le déploiement mentionné ci-dessus à ses répliques d’origine. Pour l’exemple ci-dessus de rancher-monitoring-grafana, les répliques d’origine sont 1.
# kubectl scale --replicas=1 deployment/rancher-monitoring-grafana -n cattle-monitoring-system
Vérifiez à nouveau le déploiement.
# kubectl get deployment -n cattle-monitoring-system
NAME                                    READY   UP-TO-DATE   AVAILABLE   AGE
rancher-monitoring-grafana              1/1     1            1           43h  // scaled up
rancher-monitoring-kube-state-metrics   1/1     1            1           43h
rancher-monitoring-operator             1/1     1            1           43h
rancher-monitoring-prometheus-adapter   1/1     1            1           43h
Le Volume est attaché au nouveau POD.
À présent, le Volume est étendu à la nouvelle taille et le POD l’utilise sans problème.
Échec de l’activation du rancher-monitoring produit complémentaire
Vous pouvez rencontrer cela lorsque vous installez SUSE Virtualization v1.3.0 ou une version ultérieure sur un cluster avec la taille de disque minimale requise.
Reproduire les étapes
-
Installez le SUSE Virtualization cluster.
-
Activez le produit complémentaire
rancher-monitoringadd-on, vous observerez :-
Le POD
prometheus-rancher-monitoring-prometheus-0dans l’espace de nomscattle-monitoring-systemne parvient pas à démarrer en raison d’un échec d’attachement du PVC.$ kubectl get pods -n cattle-monitoring-system NAME READY STATUS RESTARTS AGE alertmanager-rancher-monitoring-alertmanager-0 2/2 Running 0 3m22s helm-install-rancher-monitoring-4b5mx 0/1 Completed 0 3m41s prometheus-rancher-monitoring-prometheus-0 0/3 Init:0/1 0 3m21s // stuck in this status rancher-monitoring-grafana-d6f466988-hgpkb 4/4 Running 0 3m26s rancher-monitoring-kube-state-metrics-7659b76cc4-66sr7 1/1 Running 0 3m26s rancher-monitoring-operator-595476bc84-7hdxj 1/1 Running 0 3m25s rancher-monitoring-prometheus-adapter-55dc9ccd5d-pcrpk 1/1 Running 0 3m26s rancher-monitoring-prometheus-node-exporter-pbzv4 1/1 Running 0 3m26s $ kubectl describe pod -n cattle-monitoring-system prometheus-rancher-monitoring-prometheus-0 Name: prometheus-rancher-monitoring-prometheus-0 Namespace: cattle-monitoring-system Priority: 0 Service Account: rancher-monitoring-prometheus ... Events: Type Reason Age From Message ---- ------ ---- ---- ------- Warning FailedScheduling 3m48s (x3 over 4m15s) default-scheduler 0/1 nodes are available: pod has unbound immediate PersistentVolumeClaims. preemption: 0/1 nodes are available: 1 Preemption is not helpful for scheduling.. Normal Scheduled 3m44s default-scheduler Successfully assigned cattle-monitoring-system/prometheus-rancher-monitoring-prometheus-0 to harv41 Warning FailedMount 101s kubelet Unable to attach or mount volumes: unmounted volumes=[prometheus-rancher-monitoring-prometheus-db], unattached volumes=[prometheus-rancher-monitoring-prometheus-db], failed to process volumes=[]: timed out waiting for the condition Warning FailedAttachVolume 90s (x9 over 3m42s) attachdetach-controller AttachVolume.Attach failed for volume "pvc-bbe8760d-926c-484a-851c-b8ec29ae05c0" : rpc error: code = Aborted desc = volume pvc-bbe8760d-926c-484a-851c-b8ec29ae05c0 is not ready for workloads $ kubectl get pvc -A NAMESPACE NAME STATUS VOLUME CAPACITY ACCESS MODES STORAGECLASS AGE cattle-monitoring-system prometheus-rancher-monitoring-prometheus-db-prometheus-rancher-monitoring-prometheus-0 Bound pvc-bbe8760d-926c-484a-851c-b8ec29ae05c0 50Gi RWO harvester-longhorn 7m12s $ kubectl get volume -A NAMESPACE NAME DATA ENGINE STATE ROBUSTNESS SCHEDULED SIZE NODE AGE longhorn-system pvc-bbe8760d-926c-484a-851c-b8ec29ae05c0 v1 detached unknown 53687091200 6m55s -
Le Longhorn Manager ne peut pas planifier la réplique.
  $ kubectl logs -n longhorn-system longhorn-manager-bf65b | grep "pvc-bbe8760d-926c-484a-851c-b8ec29ae05c0"

  time="2024-02-19T10:12:56Z" level=error msg="There's no available disk for replica pvc-bbe8760d-926c-484a-851c-b8ec29ae05c0-r-dcb129fd, size 53687091200" func="schedule
  r.(*ReplicaScheduler).ScheduleReplica" file="replica_scheduler.go:95"
  time="2024-02-19T10:12:56Z" level=warning msg="Failed to schedule replica" func="controller.(*VolumeController).reconcileVolumeCondition" file="volume_controller.go:169
  4" accessMode=rwo controller=longhorn-volume frontend=blockdev migratable=false node=harv41 owner=harv41 replica=pvc-bbe8760d-926c-484a-851c-b8ec29ae05c0-r-dcb129fd sta
  te= volume=pvc-bbe8760d-926c-484a-851c-b8ec29ae05c0
  ...
-
Solution provisoire
-
Désactivez le produit complémentaire
rancher-monitoringsi vous l’avez déjà activé.Tous les pods dans
cattle-monitoring-systemsont supprimés mais les PVC sont conservés. Pour plus d’informations, consultez [Addons].$ kubectl get pods -n cattle-monitoring-system No resources found in cattle-monitoring-system namespace. $ kubectl get pvc -n cattle-monitoring-system NAME STATUS VOLUME CAPACITY ACCESS MODES STORAGECLASS AGE alertmanager-rancher-monitoring-alertmanager-db-alertmanager-rancher-monitoring-alertmanager-0 Bound pvc-cea6316e-f74f-4771-870b-49edb5442819 5Gi RWO harvester-longhorn 14m prometheus-rancher-monitoring-prometheus-db-prometheus-rancher-monitoring-prometheus-0 Bound pvc-bbe8760d-926c-484a-851c-b8ec29ae05c0 50Gi RWO harvester-longhorn 14m
-
Supprimez le PVC nommé
prometheus, mais conservez le PVC nomméalertmanager.$ kubectl delete pvc -n cattle-monitoring-system prometheus-rancher-monitoring-prometheus-db-prometheus-rancher-monitoring-prometheus-0 persistentvolumeclaim "prometheus-rancher-monitoring-prometheus-db-prometheus-rancher-monitoring-prometheus-0" deleted $ kubectl get pvc -n cattle-monitoring-system NAME STATUS VOLUME CAPACITY ACCESS MODES STORAGECLASS AGE alertmanager-rancher-monitoring-alertmanager-db-alertmanager-rancher-monitoring-alertmanager-0 Bound pvc-cea6316e-f74f-4771-870b-49edb5442819 5Gi RWO harvester-longhorn 16m
-
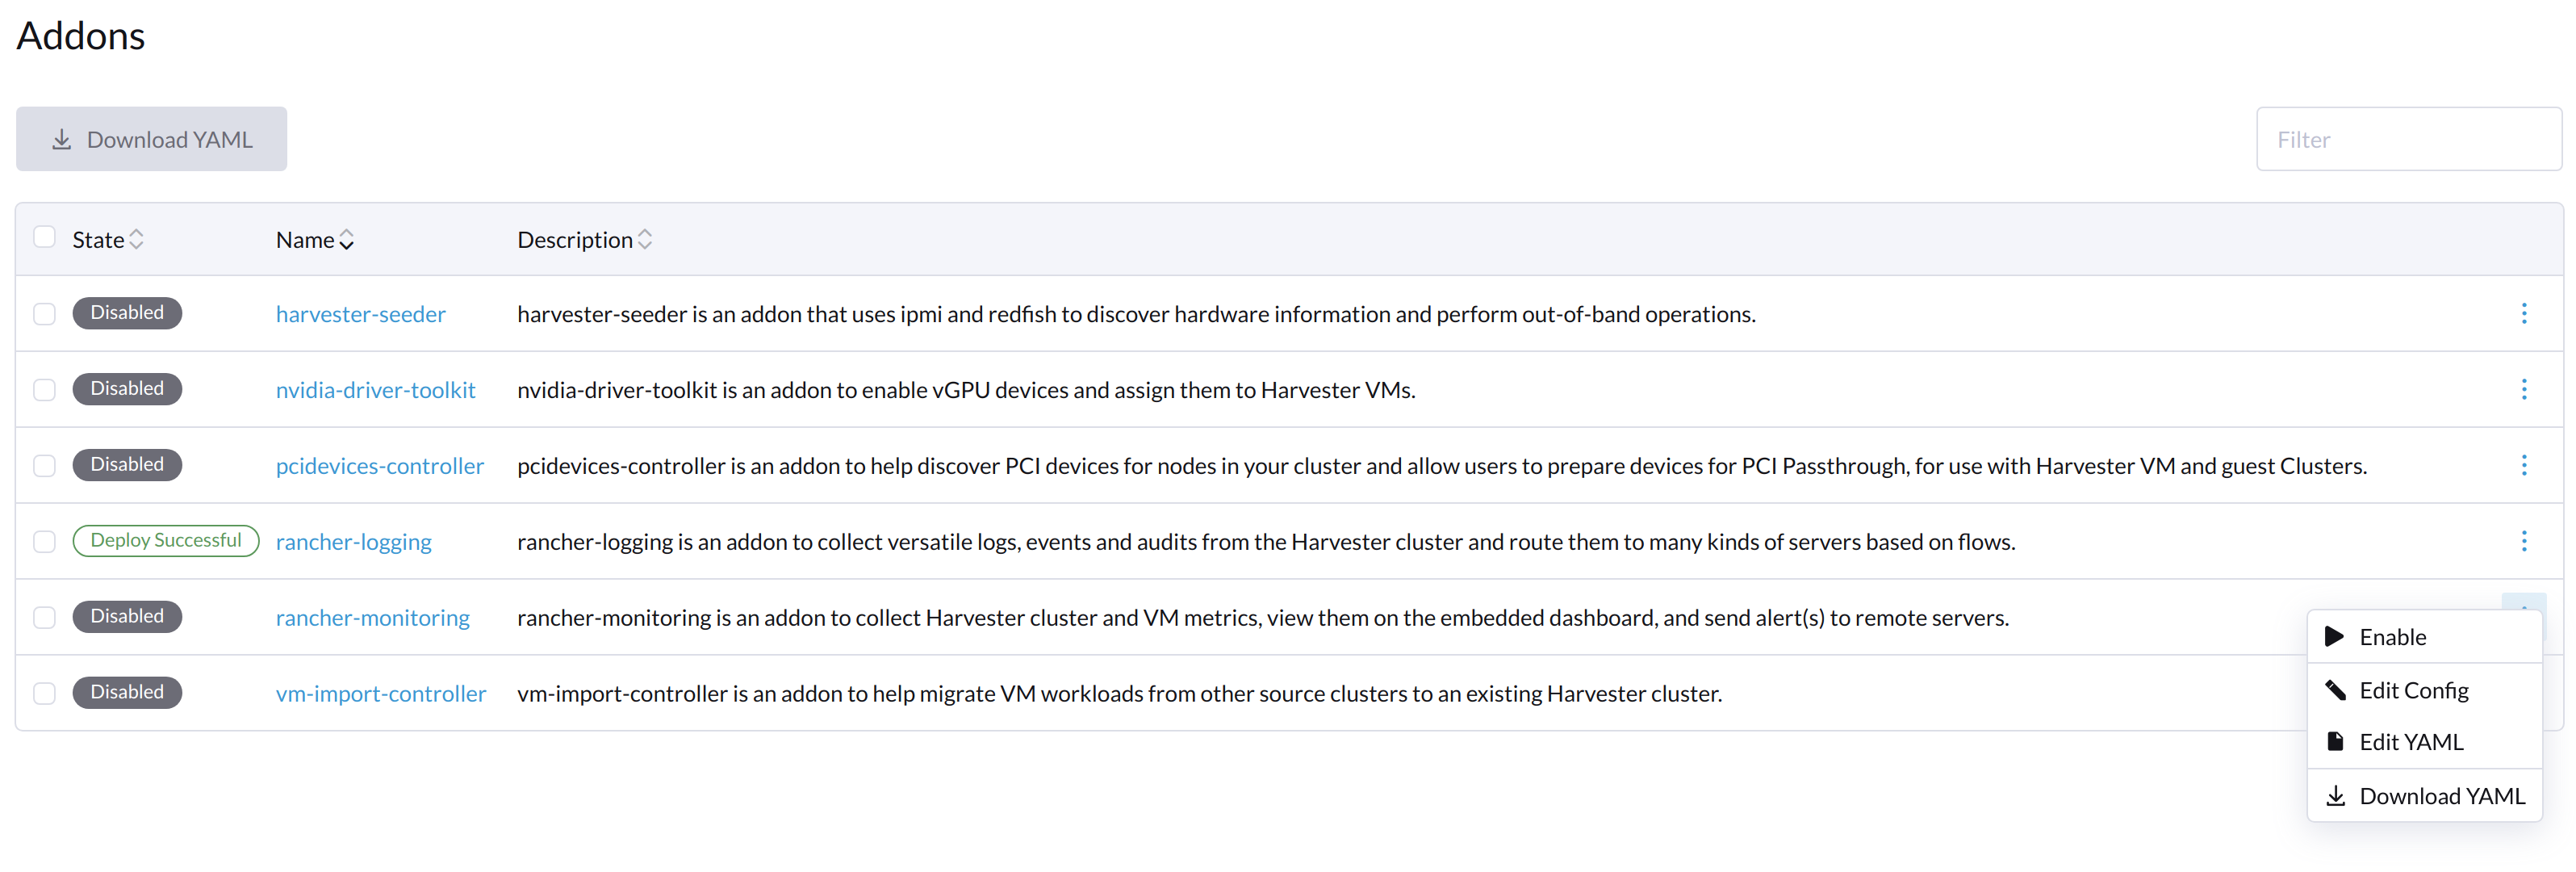
Sur l’écran Addons de l’interface utilisateur SUSE Virtualization, sélectionnez ⋮ (icône de menu) puis sélectionnez Edit YAML.
-
Comme indiqué ci-dessous, changez les deux occurrences du nombre
50en30sous prometheusSpec, puis enregistrez. La fonctionnalitéprometheusutilisera un disque de 30 GiB pour stocker des données.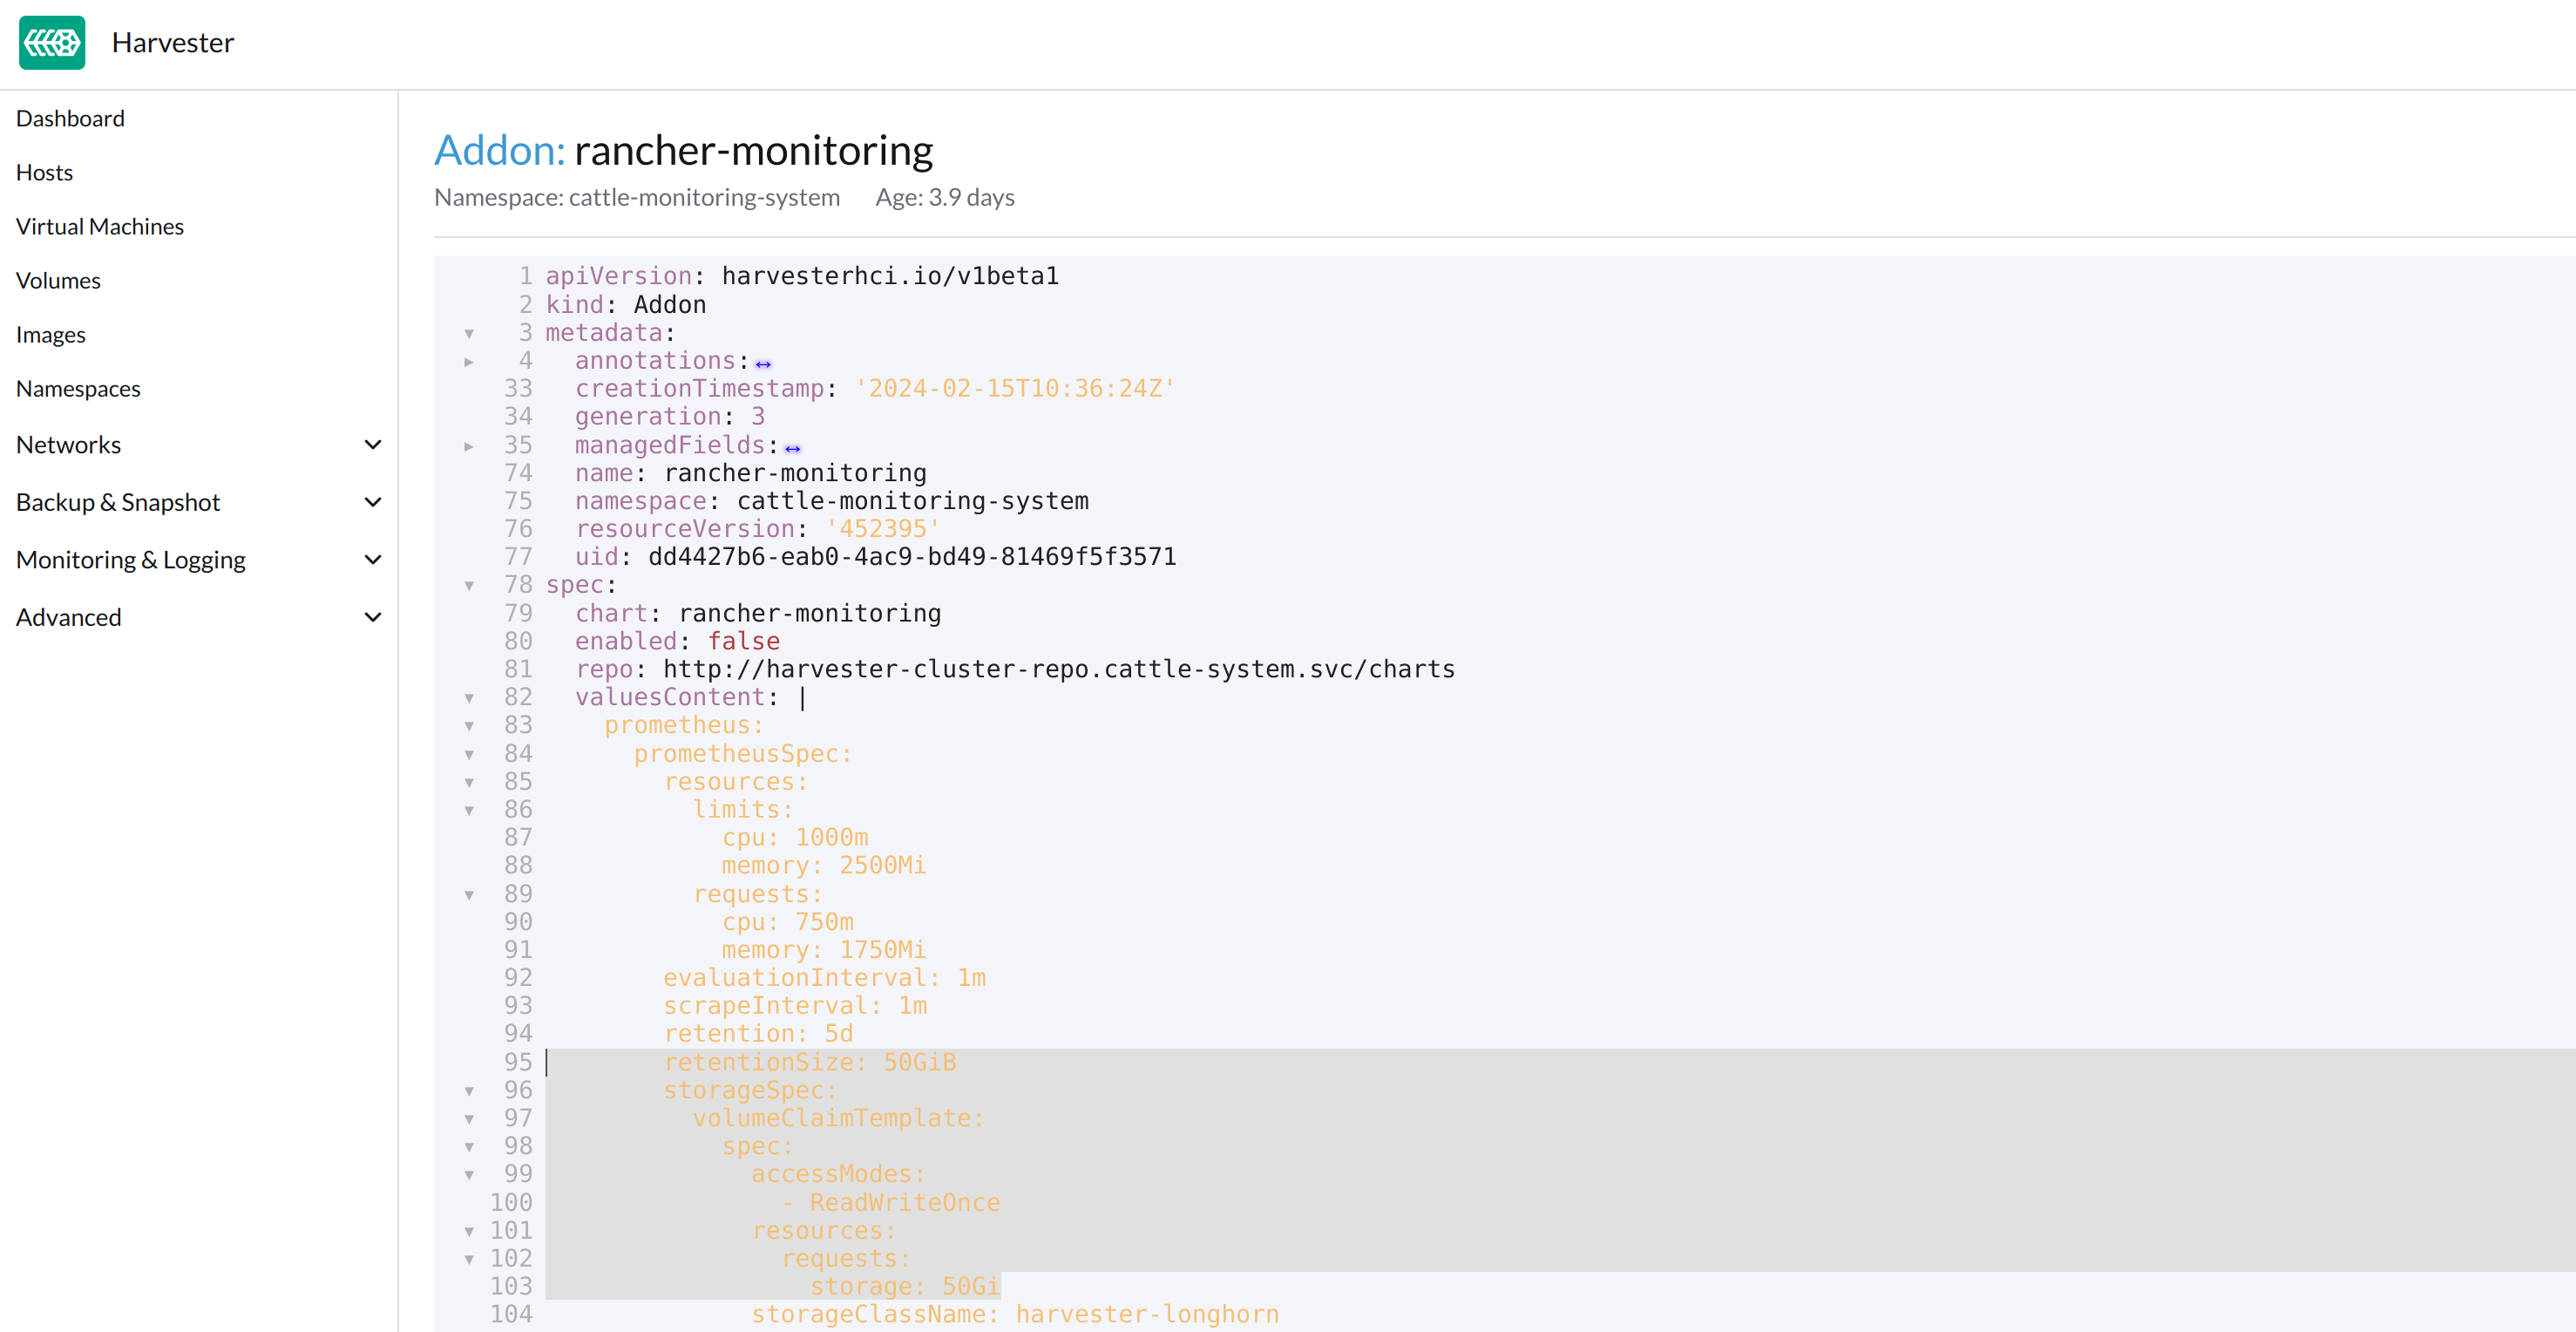
Alternativement, vous pouvez utiliser
kubectlpour modifier l’objet.kubectl edit addons.harvesterhci.io -n cattle-monitoring-system rancher-monitoringretentionSize: 50GiB // Change 50 to 30 storageSpec: volumeClaimTemplate: spec: accessModes: - ReadWriteOnce resources: requests: storage: 50Gi // Change 50 to 30 storageClassName: harvester-longhorn -
Activez le produit complémentaire
rancher-monitoringet attendez quelques minutes. -
Tous les pods sont déployés avec succès, et la fonctionnalité
rancher-monitoringest disponible.$ kubectl get pods -n cattle-monitoring-system NAME READY STATUS RESTARTS AGE alertmanager-rancher-monitoring-alertmanager-0 2/2 Running 0 3m52s helm-install-rancher-monitoring-s55tq 0/1 Completed 0 4m17s prometheus-rancher-monitoring-prometheus-0 3/3 Running 0 3m51s rancher-monitoring-grafana-d6f466988-hkv6f 4/4 Running 0 3m55s rancher-monitoring-kube-state-metrics-7659b76cc4-ght8x 1/1 Running 0 3m55s rancher-monitoring-operator-595476bc84-r96bp 1/1 Running 0 3m55s rancher-monitoring-prometheus-adapter-55dc9ccd5d-vtssc 1/1 Running 0 3m55s rancher-monitoring-prometheus-node-exporter-lgb88 1/1 Running 0 3m55s
rancher-monitoring-crd L’état du ManagedChart est Modified
Description du problème
Dans certaines situations, l’état de l’objet rancher-monitoring-crd ManagedChart change en Modified (avec le message …rancher-monitoring-crd-manager missing…).
Exemple :
 $ kubectl get managedchart rancher-monitoring-crd -n fleet-local -o yaml
 apiVersion: management.cattle.io/v3
 kind: ManagedChart
 ...
 spec:
   chart: rancher-monitoring-crd
   defaultNamespace: cattle-monitoring-system
   paused: false
   releaseName: rancher-monitoring-crd
   repoName: harvester-charts
   targets:
   - clusterName: local
     clusterSelector:
       matchExpressions:
       - key: provisioning.cattle.io/unmanaged-system-agent
         operator: DoesNotExist
   version: 102.0.0+up40.1.2
 ...
 status:
   conditions:
   - lastUpdateTime: "2024-02-22T14:03:11Z"
     message: Modified(1) [Cluster fleet-local/local]; clusterrole.rbac.authorization.k8s.io
       rancher-monitoring-crd-manager missing; clusterrolebinding.rbac.authorization.k8s.io
       rancher-monitoring-crd-manager missing; configmap.v1 cattle-monitoring-system/rancher-monitoring-crd-manifest
       missing; serviceaccount.v1 cattle-monitoring-system/rancher-monitoring-crd-manager
       missing
     status: "False"
     type: Ready
   - lastUpdateTime: "2024-02-22T14:03:11Z"
     status: "True"
     type: Processed
   - lastUpdateTime: "2024-04-02T07:45:26Z"
     status: "True"
     type: Defined
   display:
     readyClusters: 0/1
     state: Modified
 ...
L’objet ManagedChart a un objet en aval nommé Bundle, qui contient des informations similaires.
Exemple :
 $ kubectl get bundles -A
 NAMESPACE     NAME                                          BUNDLEDEPLOYMENTS-READY   STATUS
 fleet-local   fleet-agent-local                             1/1
 fleet-local   local-managed-system-agent                    1/1
 fleet-local   mcc-harvester                                 1/1
 fleet-local   mcc-harvester-crd                             1/1
 fleet-local   mcc-local-managed-system-upgrade-controller   1/1
 fleet-local   mcc-rancher-logging-crd                       1/1
 fleet-local   mcc-rancher-monitoring-crd                    0/1                       Modified(1) [Cluster fleet-local/local]; clusterrole.rbac.authorization.k8s.io rancher-monitoring-crd-manager missing; clusterrolebinding.rbac.authorization.k8s.io rancher-monitoring-crd-manager missing; configmap.v1 cattle-monitoring-system/rancher-monitoring-crd-manifest missing; serviceaccount.v1 cattle-monitoring-system/rancher-monitoring-crd-manager missing
Lorsque le problème existe et que vous démarrez une mise à niveau, SUSE Virtualization peut renvoyer le message d’erreur suivant : admission webhook "validator.harvesterhci.io" denied the request: managed chart rancher-monitoring-crd is not ready, please wait for it to be ready.
De plus, lorsque vous recherchez les objets marqués comme missing, vous constaterez qu’ils existent dans le cluster.
Exemple :
$ kubectl get clusterrole rancher-monitoring-crd-manager
apiVersion: rbac.authorization.k8s.io/v1
kind: ClusterRole
metadata:
  annotations:
    meta.helm.sh/release-name: rancher-monitoring-crd
    meta.helm.sh/release-namespace: cattle-monitoring-system
  creationTimestamp: "2023-01-09T11:04:33Z"
  labels:
    app: rancher-monitoring-crd-manager
    app.kubernetes.io/managed-by: Helm
  name: rancher-monitoring-crd-manager
  ...
rules:
- apiGroups:
  - apiextensions.k8s.io
  resources:
  - customresourcedefinitions
  verbs:
  - create
  - get
  - patch
  - delete

$ kubectl get clusterrolebinding rancher-monitoring-crd-manager
apiVersion: rbac.authorization.k8s.io/v1
kind: ClusterRoleBinding
metadata:
  annotations:
    meta.helm.sh/release-name: rancher-monitoring-crd
    meta.helm.sh/release-namespace: cattle-monitoring-system
  creationTimestamp: "2023-01-09T11:04:33Z"
  labels:
    app: rancher-monitoring-crd-manager
    app.kubernetes.io/managed-by: Helm
  name: rancher-monitoring-crd-manager
  ...
roleRef:
  apiGroup: rbac.authorization.k8s.io
  kind: ClusterRole
  name: rancher-monitoring-crd-manager
subjects:
- kind: ServiceAccount
  name: rancher-monitoring-crd-manager
  namespace: cattle-monitoring-system

$ kubectl get configmap -n cattle-monitoring-system rancher-monitoring-crd-manifest
apiVersion: v1
data:
  crd-manifest.tgz.b64: ...
kind: ConfigMap
metadata:
  annotations:
    meta.helm.sh/release-name: rancher-monitoring-crd
    meta.helm.sh/release-namespace: cattle-monitoring-system
  creationTimestamp: "2023-01-09T11:04:33Z"
  labels:
    app.kubernetes.io/managed-by: Helm
  name: rancher-monitoring-crd-manifest
  namespace: cattle-monitoring-system
  ...

$ kubectl get ServiceAccount -n cattle-monitoring-system rancher-monitoring-crd-manager
apiVersion: v1
kind: ServiceAccount
metadata:
  annotations:
    meta.helm.sh/release-name: rancher-monitoring-crd
    meta.helm.sh/release-namespace: cattle-monitoring-system
  creationTimestamp: "2023-01-09T11:04:33Z"
  labels:
    app: rancher-monitoring-crd-manager
    app.kubernetes.io/managed-by: Helm
  name: rancher-monitoring-crd-manager
  namespace: cattle-monitoring-system
  ...
Cause racine
Les objets marqués comme missing n’ont pas les annotations et étiquettes requises par l’objet ManagedChart.
Exemple :
apiVersion: rbac.authorization.k8s.io/v1
kind: ClusterRole
metadata:
  annotations:
    meta.helm.sh/release-name: rancher-monitoring-crd
    meta.helm.sh/release-namespace: cattle-monitoring-system
    objectset.rio.cattle.io/id: default-mcc-rancher-monitoring-crd-cattle-fleet-local-system   # This required item is not in the above object.
  creationTimestamp: "2024-04-03T10:23:55Z"
  labels:
    app: rancher-monitoring-crd-manager
    app.kubernetes.io/managed-by: Helm
    objectset.rio.cattle.io/hash: 2da503261617e9ea2da822d2da7cdcfccad847a9    # This required item is not in the above object.
  name: rancher-monitoring-crd-manager
...
rules:
- apiGroups:
  - apiextensions.k8s.io
  resources:
  - customresourcedefinitions
  verbs:
  - create
  - get
  - patch
  - delete
  - update
Solution provisoire
-
Appliquez un correctif à l’objet ClusterRole
rancher-monitoring-crd-managerpour ajouter l’opérationupdate.$ cat > patchrules.yaml << EOF rules: - apiGroups: - apiextensions.k8s.io resources: - customresourcedefinitions verbs: - create - get - patch - delete - update EOF $ kubectl patch ClusterRole rancher-monitoring-crd-manager --patch-file ./patchrules.yaml --type merge $ rm ./patchrules.yaml -
Appliquez un correctif aux objets marqués comme
missingpour ajouter les annotations et étiquettes requises.$ cat > patchhash.yaml << EOF metadata: annotations: objectset.rio.cattle.io/id: default-mcc-rancher-monitoring-crd-cattle-fleet-local-system labels: objectset.rio.cattle.io/hash: 2da503261617e9ea2da822d2da7cdcfccad847a9 EOF $ kubectl patch ClusterRole rancher-monitoring-crd-manager --patch-file ./patchhash.yaml --type merge $ kubectl patch ClusterRoleBinding rancher-monitoring-crd-manager --patch-file ./patchhash.yaml --type merge $ kubectl patch ServiceAccount rancher-monitoring-crd-manager -n cattle-monitoring-system --patch-file ./patchhash.yaml --type merge $ kubectl patch ConfigMap rancher-monitoring-crd-manifest -n cattle-monitoring-system --patch-file ./patchhash.yaml --type merge $ rm ./patchhash.yaml -
Vérifiez l’objet
rancher-monitoring-crdManagedChart.Après quelques secondes, le statut de l’objet
rancher-monitoring-crdManagedChart change enReady.$ kubectl get managedchart -n fleet-local rancher-monitoring-crd -oyaml apiVersion: management.cattle.io/v3 kind: ManagedChart metadata: ... name: rancher-monitoring-crd namespace: fleet-local ... status: conditions: - lastUpdateTime: "2024-04-22T21:41:44Z" status: "True" type: Ready ...De plus, les indicateurs d’erreur ne sont plus affichés pour les objets en aval.
$ kubectl bundle -A NAMESPACE NAME BUNDLEDEPLOYMENTS-READY STATUS fleet-local fleet-agent-local 1/1 fleet-local local-managed-system-agent 1/1 fleet-local mcc-harvester 1/1 fleet-local mcc-harvester-crd 1/1 fleet-local mcc-local-managed-system-upgrade-controller 1/1 fleet-local mcc-rancher-logging-crd 1/1 fleet-local mcc-rancher-monitoring-crd 1/1 -
(Optionnel) Réessayez la mise à niveau (si elle a échoué précédemment à cause de ce problème).
Certains rancher-monitoring pods du produit complémentaire sont abruptement terminés
Description du problème
Lorsque le rancher-monitoring produit complémentaire est activé, les pods liés à Prometheus, Alertmanager et Grafana sont terminés peu après leur création.
Exemple :
$ kubectl -n cattle-monitoring-system get pods,svc,ep,deploy,pvc,sts,prometheus,alertmanager | grep -E 'stateful|deploy'

deployment.apps/rancher-monitoring-grafana              0/0     0            0           7h52m
deployment.apps/rancher-monitoring-kube-state-metrics   1/1     1            1           7h52m
deployment.apps/rancher-monitoring-operator             1/1     1            1           7h52m
deployment.apps/rancher-monitoring-prometheus-adapter   1/1     1            1           7h52m
statefulset.apps/alertmanager-rancher-monitoring-alertmanager   0/0     7h52m
statefulset.apps/prometheus-rancher-monitoring-prometheus       0/0     7h52m
Les journaux du prometheus pod contiennent le message level=warn msg="Received SIGTERM, exiting gracefully…".
...
ts=2025-05-20T05:41:02.847Z caller=kubernetes.go:327 level=info component="discovery manager notify" discovery=kubernetes config=config-0 msg="Using pod service account via in-cluster config"
ts=2025-05-20T05:41:02.880Z caller=main.go:1261 level=info msg="Completed loading of configuration file" filename=/etc/prometheus/config_out/prometheus.env.yaml totalDuration=35.457401ms db_storage=998ns remote_storage=1.45µs web_handler=392ns query_engine=1.095µs scrape=34.384µs scrape_sd=515.81µs notify=10.226µs notify_sd=82.314µs rules=32.514863ms tracing=2.344µs
ts=2025-05-20T05:41:50.044Z caller=main.go:854 level=warn msg="Received SIGTERM, exiting gracefully..."
ts=2025-05-20T05:41:50.044Z caller=main.go:878 level=info msg="Stopping scrape discovery manager..."
ts=2025-05-20T05:41:50.044Z caller=main.go:892 level=info msg="Stopping notify discovery manager..."
...
L’objet CRD prometheus inclut `storage-network.settings.harvesterhci.io/replica : "1" ` annotation.
- apiVersion: monitoring.coreos.com/v1
  kind: Prometheus
  metadata:
    annotations:
      meta.helm.sh/release-name: rancher-monitoring
      meta.helm.sh/release-namespace: cattle-monitoring-system
      storage-network.settings.harvesterhci.io/replica: "1"
    creationTimestamp: "2025-05-20T06:40:25Z"
Les journaux du pod Harvester ('déploiement harvester-system/harvester') indiquent que la tentative de changement du storage-network paramètre a été bloquée.
...
2025-05-20T08:13:49.842448311Z time="2025-05-20T08:13:49Z" level=info msg="storage network change: {\"vlan\":955,\"clusterNetwork\":\"k8s-storage\",\"range\":\"198.18.2.0/24\"}"
2025-05-20T08:13:49.842476305Z time="2025-05-20T08:13:49Z" level=info msg="rancher monitoring not found. skip"
2025-05-20T08:13:49.842479072Z time="2025-05-20T08:13:49Z" level=info msg="current Grafana replicas: 0"
2025-05-20T08:13:49.842480501Z time="2025-05-20T08:13:49Z" level=info msg="VM import controller no found. skip"
2025-05-20T08:13:49.851381877Z time="2025-05-20T08:13:49Z" level=error msg="error syncing 'storage-network': handler harvester-storage-network-controller: Waiting for all volumes detached: pvc-6f66d234-f9c2-453e-8c17-383d9b489956,pvc-07c626f5-5135-4783-952d-cc20b1607cb5,pvc-1cfd6efe-c928-42e5-a834-8c27ed0e4897,pvc-5ce98d0a-5da1-4f30-af14-a8de29233380,pvc-1c9b7c9a-4943-4462-9082-217f9988cfc5,pvc-e9d92bfd-63c7-4ae3-ba00-1ce209f12caa,pvc-205ba31d-35fb-44f6-a3c4-c53001ec0dd6,pvc-6b5a7d11-7578-4397-9e13-ab475fe91463,pvc-669c69dd-93ad-4304-a340-484f7108362b,pvc-7668c486-b688-4524-b359-0cf9ec21cbc0,pvc-7d294996-821f-4434-ae4f-55a6de67f28c,pvc-216333c6-73f9-4e68-ac8b-53ab95a1f138,pvc-f72ca889-70c9-4dd9-bcec-a17ab65a1df4,pvc-01895fab-12f8-452a-9161-7d3c01e22726,pvc-330caa2d-5fdc-42f2-8c53-c5f80044760f,pvc-9506b7d0-c2d5-41f2-a08b-d7bc22dddb88,pvc-3e2b46d4-c471-44a9-9765-64babdb6ceed,pvc-25fe3372-1802-46d5-abf1-039099c567e2,pvc-b16fb262-cb38-4438-b074-84c7ad080a15,pvc-757c0f22-4ed6-4669-844d-cd7a87ceb26e,pvc-e0d99d8f-581f-4be6-baa3-d345308c9330,pvc-f5e1e19d-3dfb-4be1-9354-c092d7f03009,pvc-383ec26a-51f6-4f9d-8d8a-179651846d92,pvc-0d8f5737-c6e4-4f55-8d19-cf7a785552fc,pvc-5091892e-faf2-47b1-b987-bbde1ab2c13a,pvc-6f0c97ae-dfda-4799-bf26-e85feace5414,pvc-b0f717af-8a79-4c4e-b82e-90dedeae7697,pvc-ffe982d5-5ff1-40aa-a0db-cc10360d2d89,pvc-370757e2-4bce-41e7-b6f7-95aa8a5e8cf1,pvc-5a77d3e3-d555-476c-840f-7b9dadeb7478,pvc-43987c88-99b1-4889-9a47-5261717fe265,pvc-9f675704-9c52-46c2-96bf-2ff83d805383,pvc-d0b4e1d0-9bcd-4a8a-b52c-e1d8062a8099,pvc-a29be31f-531f-409a-bf5a-d267a54e2edb, requeuing"
...
Cause racine
Lorsque vous apportez des modifications au paramètre storage-network, le contrôleur SUSE Virtualization attend que les volumes attachés soient détachés avant d’appliquer les modifications. De plus, le contrôleur termine automatiquement les pods liés à Prometheus, Alertmanager et Grafana car ces pods utilisent des volumes pour stocker des données.
Ce processus prend généralement peu de temps à compléter, mais peut être perturbé lorsque les éléments suivants se produisent :
-
Les volumes attachés empêchent le contrôleur Harvester d’appliquer les modifications au paramètre.
-
Un utilisateur ou le
monitoring-operatortente d’activer le produit complémentairerancher-monitoring. -
Le contrôleur Harvester termine les pods.
Solution provisoire
-
Désactivez le produit complémentaire
rancher-monitoring. -
Vérifiez si le paramètre storage-network est activé ou désactivé.
-
Vérifiez les indicateurs d’erreur dans les journaux des pods Harvester. Si des volumes sont encore attachés, arrêtez les machines virtuelles associées jusqu’à ce qu’aucune erreur n’apparaisse après le message
storage network change. -
Activez le produit complémentaire
rancher-monitoring.
SUSE Virtualization L’interface utilisateur cesse de signaler les métriques des machines virtuelles après la mise à niveau.
Description du problème
Après une mise à niveau, l’interface utilisateur SUSE Virtualization cesse de signaler les métriques des machines virtuelles tandis que les métriques du cluster restent disponibles. Désactiver et réactiver le rancher-monitoring produit complémentaire ne résout pas le problème.
L’objet prometheus-kubevirt-rules ServiceMonitor est manquant dans l’espace de noms cattle-monitoring-system. Vous ne pouvez pas ajouter cet objet manuellement car l’opérateur KubeVirt le supprime automatiquement.
$ kubectl get servicemonitor -A
NAMESPACE                  NAME                                 AGE
...
cattle-monitoring-system   prometheus-kubevirt-rules            24s  // is missing
...
Cause racine
Lorsque KubeVirt est nouvellement installé ou mis à niveau, il génère un nouvel objet ConfigMap pour stocker la configuration. Une condition de concurrence se produit au sein de l’opérateur KubeVirt si l’objet rancher-monitoring-operator ServiceAccount est manquant/non synchronisé depuis l’espace de noms cattle-monitoring-system pendant ce processus. Par conséquent, la configuration du ServiceMonitor peut être exclue de l’objet ConfigMap résultant.
Pendant le processus de mise à niveau, KubeVirt peut déterminer incorrectement l’état de surveillance. Une fois l’objet ConfigMap généré, KubeVirt ne le réconcilie ni ne le régénère jusqu’à la prochaine mise à niveau, sauf si un déclencheur manuel est effectué.
Solution provisoire
La solution de contournement consiste à s’assurer que l’objet rancher-monitoring-operator ServiceAccount existe, à supprimer les objets ConfigMap orphelins et à redémarrer l’opérateur KubeVirt.
-
Récupérez la liste des objets ConfigMap.
$ kubectl get configmap -n harvester-system  -l kubevirt.io/install-strategy
NAME                              DATA   AGE
kubevirt-install-strategy-zq86d   1      10m
La liste inclut le ConfigMap de la dernière version et tous les objets hérités restants.
-
Vérifiez si le dernier objet ConfigMap contient la configuration ServiceMonitor.
$ kubectl get configmap -n harvester-system kubevirt-install-strategy-zq86d -ojsonpath="{.data.manifests}" | base64 -d | gunzip | grep ServiceMoni -iLorsque la sortie est vide, le problème existe dans votre environnement.
-
Vérifiez que les champs
monitorAccountetmonitorNamespaceexistent.$ kubectl get kubevirt kubevirt -n harvester-system -oyaml | grep monitoring monitorAccount: rancher-monitoring-operator monitorNamespace: cattle-monitoring-system -
Vérifiez que l’objet ServiceAccount existe.
Cet objet est créé lors de l’installation et ne doit pas être supprimé.
$ kubectl get serviceaccount -n cattle-monitoring-system rancher-monitoring-operator Error from server (NotFound): serviceaccounts "rancher-monitoring-operator" not found -
Si l’objet ServiceAccount n’existe pas, créez-le manuellement. Sinon, passez à l’étape suivante.
$ cat > rmo.yaml << 'EOF' apiVersion: v1 kind: ServiceAccount metadata: annotations: meta.helm.sh/release-name: rancher-monitoring meta.helm.sh/release-namespace: cattle-monitoring-system labels: app: rancher-monitoring-operator app.kubernetes.io/component: prometheus-operator app.kubernetes.io/instance: rancher-monitoring app.kubernetes.io/managed-by: Helm app.kubernetes.io/name: rancher-monitoring-prometheus-operator heritage: Helm release: rancher-monitoring name: rancher-monitoring-operator namespace: cattle-monitoring-system EOF $ kubectl create -f rmo.yaml $ kubectl get serviceaccount -n cattle-monitoring-system rancher-monitoring-operator NAME SECRETS AGE rancher-monitoring-operator 0 35s -
Supprimez tous les objets ConfigMap (
kubevirt-install-strategy-*). -
Déployez le
virt-operatordéploiement.KubeVirt recrée le ConfigMap.
$ kubectl rollout restart deployment -n harvester-system virt-operator
deployment.apps/virt-operator restarted

$ kubectl get pods -n harvester-system
NAME                                                              READY   STATUS      RESTARTS   AGE
...
kubevirt-c2053a4889fe65e8d368b5c232901c84fda8debe-jobgddh65r7ws   0/1     Completed   0          6s  // the pod exists for a short time
...
virt-operator-796bf5fd9b-h56z9                                    1/1     Running     0          33s

$ kubectl get servicemonitor -A
NAMESPACE                  NAME                                 AGE
cattle-monitoring-system   prometheus-kubevirt-rules            24s  // newly created
...