4 View cluster internals #
The menu item lets you view detailed information about Ceph cluster hosts, inventory, Ceph Monitors, services, OSDs, configuration, CRUSH Map, Ceph Manager, logs, and monitoring files.
4.1 Viewing cluster nodes #
Click › to view a list of cluster nodes.
Click the drop-down arrow next to a node name in the column to view the performance details of the node.
The column lists all daemons that are running on each related node. Click a daemon name to view its detailed configuration.
4.2 Accessing cluster inventory #
Click › to view a list of devices. The list includes the device path, type, availability, vendor, model, size, and the OSDs.
Click to select a node name in the column. When selected, click to identify the device the host is running on. This tells the device to blink its LEDs. Select the duration of this action between 1, 2, 5, 10, or 15 minutes. Click .
4.3 Viewing Ceph Monitors #
Click
›
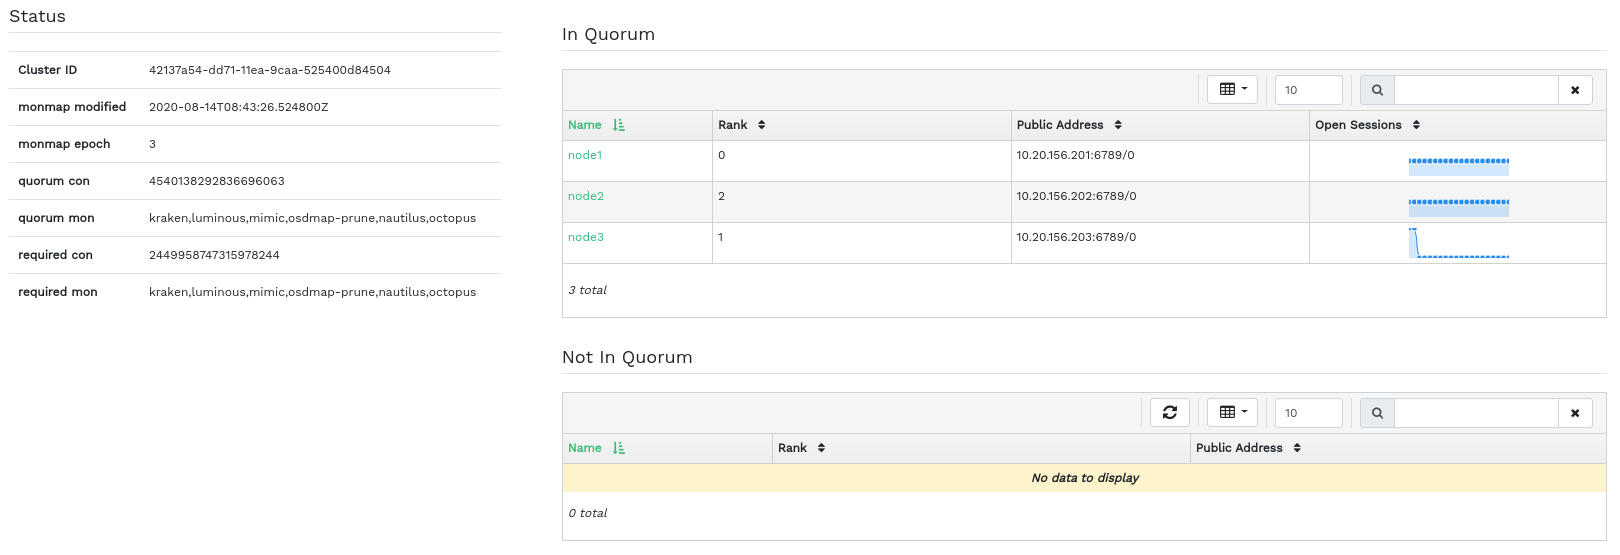
to view a list of cluster nodes with running Ceph monitors. The content
pane is split into two views: Status, and In
Quorum or Not In Quorum.
The table shows general statistics about the running Ceph Monitors, including the following:
Cluster ID
monmap modified
monmap epoch
quorum con
quorum mon
required con
required mon
The In Quorum and Not In Quorum panes
include each monitor's name, rank number, public IP address, and number of
open sessions.
Click a node name in the column to view the related Ceph Monitor configuration.
4.4 Displaying services #
Click
›
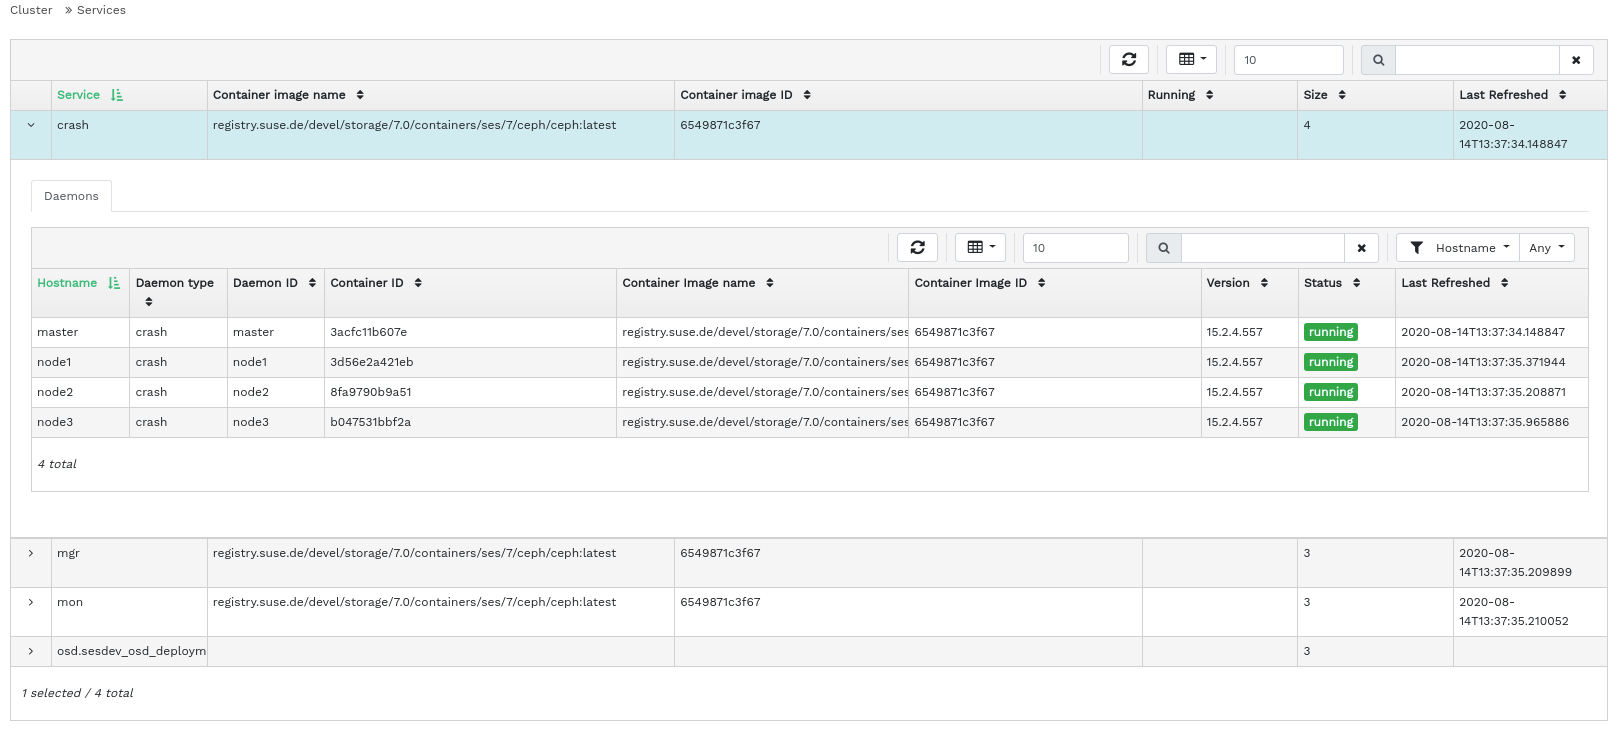
to view details on each of the available services: crash,
Ceph Manager, and Ceph Monitors. The list includes the container image name, container
image ID, status of what is running, size, and when it was last refreshed.
Click the drop-down arrow next to a service name in the column to view details of the daemon. The detail list includes the host name, daemon type, daemon ID, container ID, container image name, container image ID, version number, status, and when it was last refreshed.
4.5 Displaying Ceph OSDs #
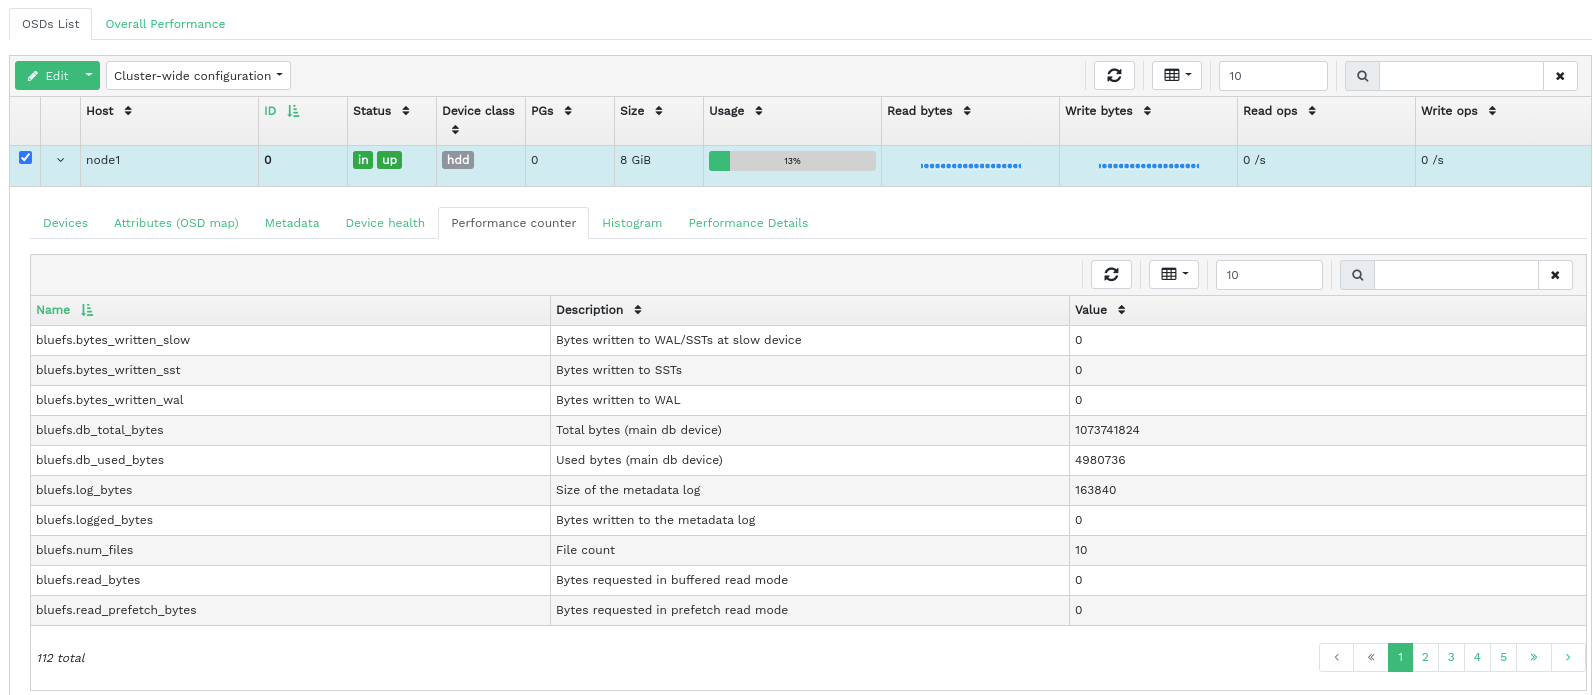
Click › to view a list of nodes with running OSD daemons. The list includes each node's name, ID, status, device class, number of placement groups, size, usage, reads/writes chart in time, and the rate of read/write operations per second.
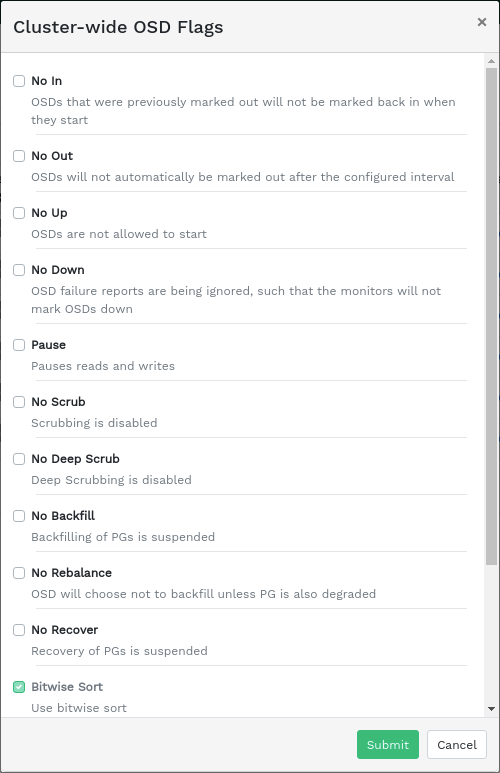
Select from the drop-down menu in the table heading to open a pop-up window. This has a list of flags that apply to the whole cluster. You can activate or deactivate individual flags, and confirm with .
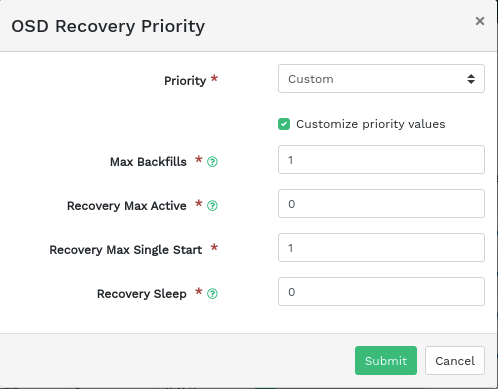
Select from the drop-down menu in the table heading to open a pop-up window. This has a list of OSD recovery priorities that apply to the whole cluster. You can activate the preferred priority profile and fine-tune the individual values below. Confirm with .
Click the drop-down arrow next to a node name in the column to view an extended table with details about the device settings and performance. Browsing through several tabs, you can see lists of , , , , a graphical of reads and writes, and .
After you click an OSD node name, the table row is highlighted. This means that you can now perform a task on the node. You can choose to perform any of the following actions: , , , , , , , , , , , or .
Click the down arrow in the top left of the table heading next to the button and select the task you want to perform.
4.5.1 Adding OSDs #
To add new OSDs, follow these steps:
Verify that some cluster nodes have storage devices whose status is
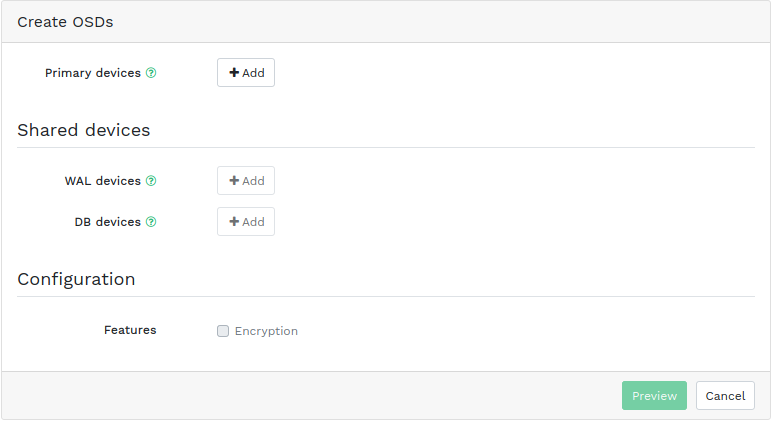
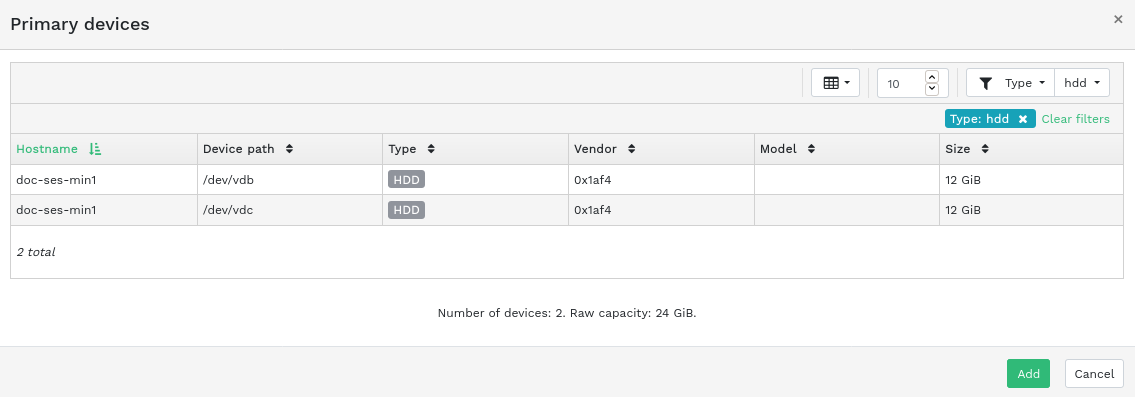
available. Then click the down arrow in the top left of the table heading and select . This opens the window.Figure 4.9: Create OSDs #To add primary storage devices for OSDs, click . Before you can add storage devices, you need to specify filtering criteria in the top right of the table—for example . Confirm with .
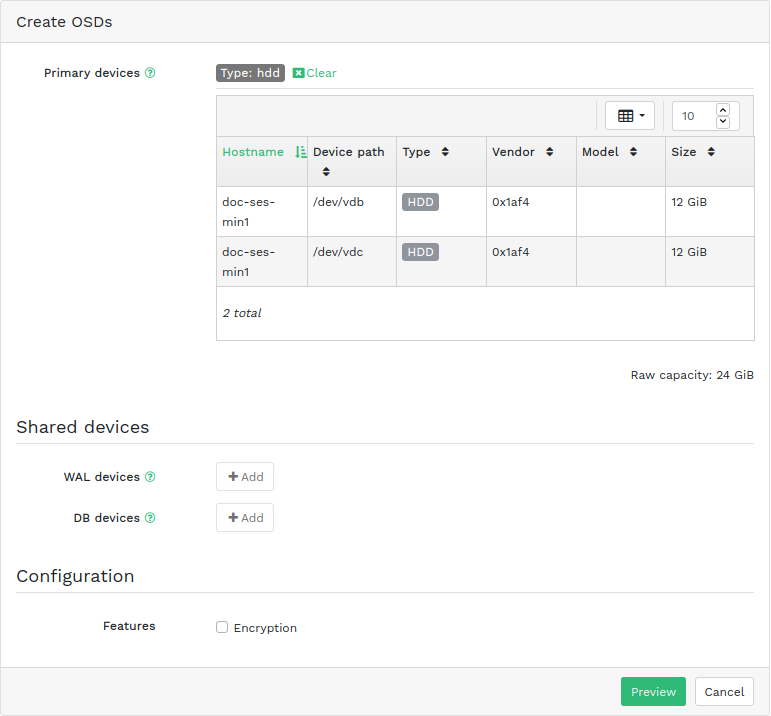
Figure 4.10: Adding primary devices #In the updated window, optionally add shared WAL and BD devices, or enable device encryption.
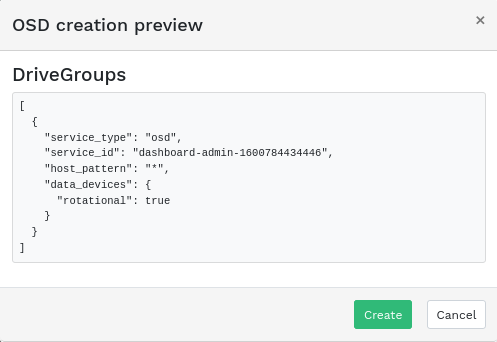
Figure 4.11: Create OSDs with primary devices added #Click to view the preview of DriveGroups specification for the devices you previously added. Confirm with .
Figure 4.12: #New devices will be added to the list of OSDs.
Figure 4.13: Newly added OSDs #NoteThere is no progress visualization of the OSD creation process. It takes some time before they are actually created. The OSDs will appear in the list when they have been deployed. If you want to check the deployment status, view the logs by clicking › .
4.6 Viewing cluster configuration #
Click › to view a complete list of Ceph cluster configuration options. The list contains the name of the option, its short description, and its current and default values, and whether the option is editable.
Click the drop-down arrow next to a configuration option in the column to view an extended table with detailed information about the option, such as its type of value, minimum and maximum permitted values, whether it can be updated at runtime, and many more.
After highlighting a specific option, you can edit its value(s) by clicking the button in the top left of the table heading. Confirm changes with .
4.7 Viewing the CRUSH Map #
Click › to view a CRUSH Map of the cluster. For more general information on CRUSH Maps, refer to Section 17.5, “CRUSH Map manipulation”.
Click the root, nodes, or individual OSDs to view more detailed information, such as crush weight, depth in the map tree, device class of the OSD, and many more.
4.8 Viewing manager modules #
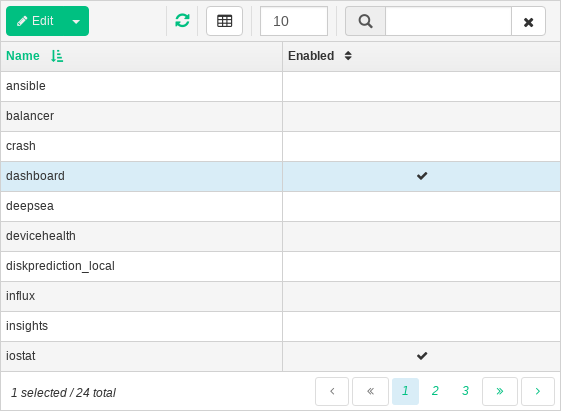
Click › to view a list of available Ceph Manager modules. Each line consists of a module name and information on whether it is currently enabled or not.
Click the drop-down arrow next to a module in the column to view an extended table with detailed settings in the table below. Edit them by clicking the button in the top left of the table heading. Confirm changes with .
Click the drop-down arrow next to the button in the top left of the table heading to or a module.
4.9 Viewing logs #
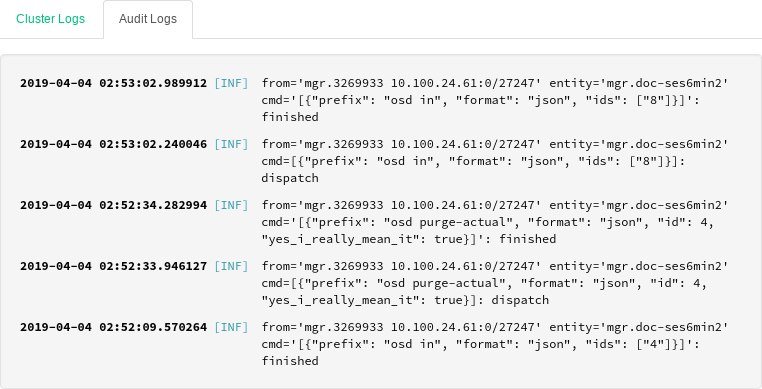
Click › to view a list of cluster's recent log entries. Each line consists of a time stamp, the type of the log entry, and the logged message itself.
Click the tab to view log entries of the auditing subsystem. Refer to Section 11.5, “Auditing API requests” for commands to enable or disable auditing.
4.10 Viewing monitoring #
Click › to manage and view details on Prometheus alerts.
If you have Prometheus active, in this content pane you can view detailed information on , , or .
If you do not have Prometheus deployed, an information banner will appear and link to relevant documentation.


