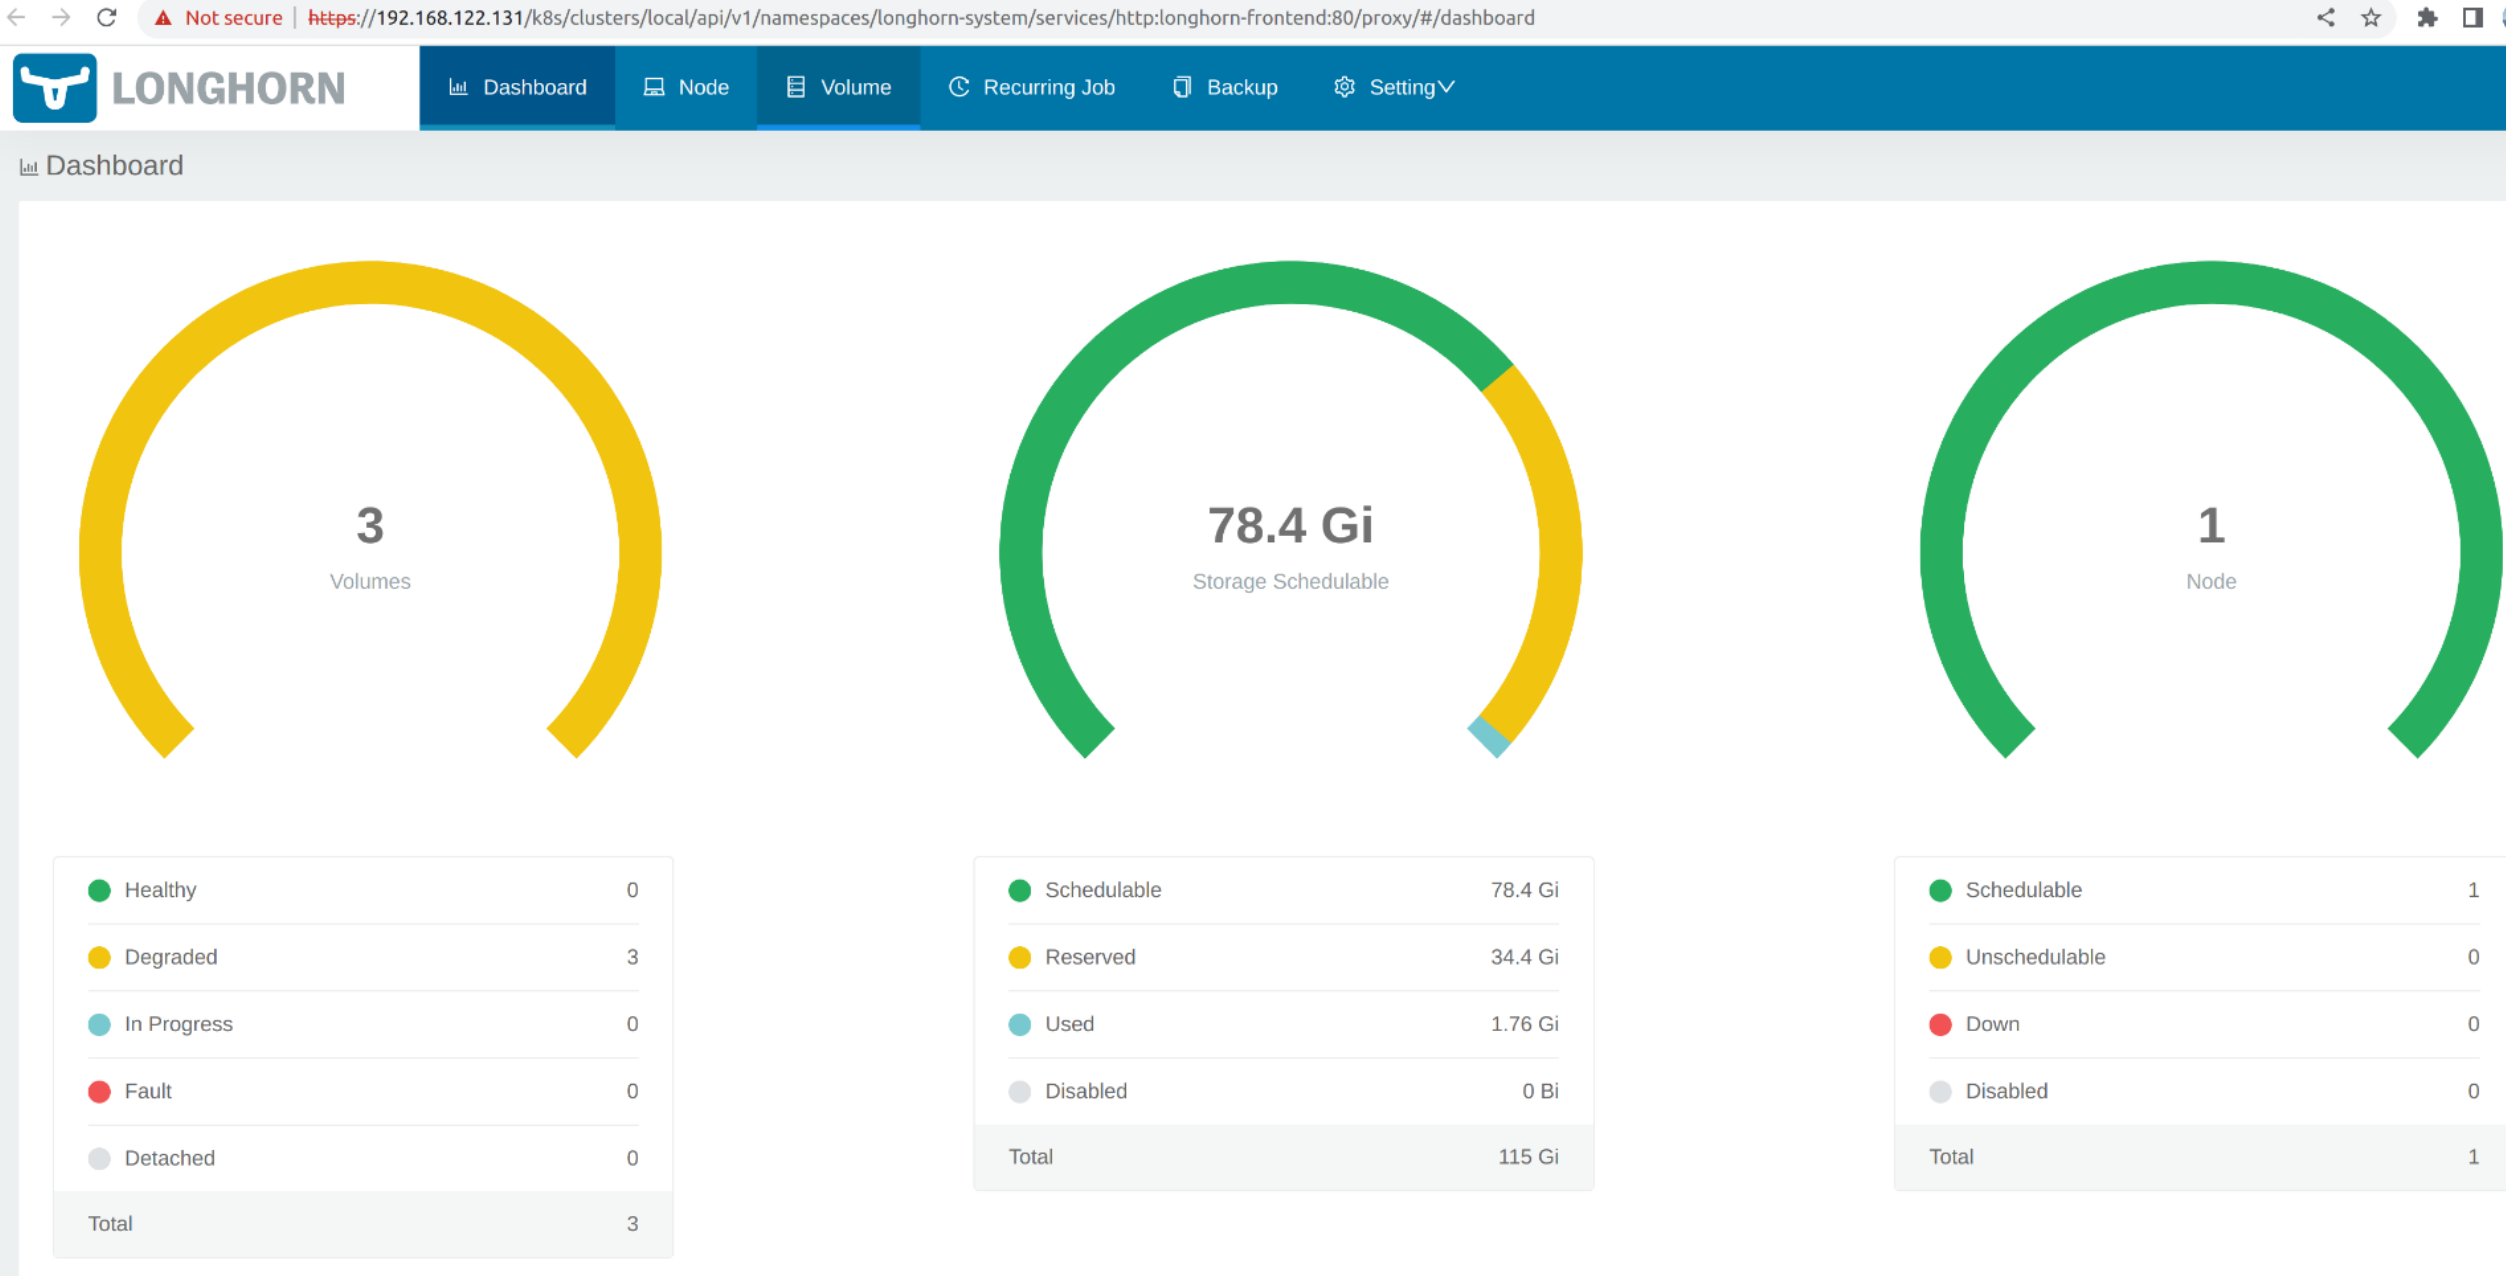
监控问题
监控不可用
当 SUSE Virtualization 仪表板未显示任何监控指标时,可能是由于以下原因造成的。
由于 Pod 被卡在 Terminating 状态,监控不可用。
SUSE Virtualization 监控 Pod 随机部署在集群节点上。当承载 Pod 的节点意外宕机时,相关的 Pod 可能会卡在 Terminating 状态,从而导致 WebUI 中的监控不可用。
$ kubectl get pods -n cattle-monitoring-system

NAMESPACE                   NAME                                                     READY   STATUS        RESTARTS   AGE
cattle-monitoring-system    prometheus-rancher-monitoring-prometheus-0               3/3     Terminating   0          3d23h
cattle-monitoring-system    rancher-monitoring-admission-create-fwjn9                0/1     Terminating   0          137m
cattle-monitoring-system    rancher-monitoring-crd-create-9wtzf                      0/1     Terminating   0          137m
cattle-monitoring-system    rancher-monitoring-grafana-d9c56d79b-ph4nz               3/3     Terminating   0          3d23h
cattle-monitoring-system    rancher-monitoring-grafana-d9c56d79b-t24sz               0/3     Init:0/2      0          132m

cattle-monitoring-system    rancher-monitoring-kube-state-metrics-5bc8bb48bd-nbd92   1/1     Running       4          4d1h
...
可以使用 CLI 命令强制删除相关的 Pod 来恢复监控。集群将重新部署新的 Pod 来替换它们。
# Delete each none-running Pod in namespace cattle-monitoring-system.

$ kubectl delete pod --force -n cattle-monitoring-system prometheus-rancher-monitoring-prometheus-0

 pod "prometheus-rancher-monitoring-prometheus-0" force deleted


$ kubectl delete pod --force -n cattle-monitoring-system rancher-monitoring-admission-create-fwjn9

$ kubectl delete pod --force -n cattle-monitoring-system rancher-monitoring-crd-create-9wtzf

$ kubectl delete pod --force -n cattle-monitoring-system rancher-monitoring-grafana-d9c56d79b-ph4nz

$ kubectl delete pod --force -n cattle-monitoring-system rancher-monitoring-grafana-d9c56d79b-t24sz
等待几分钟,以便新 Pod 被创建并准备好使监控仪表板再次可用。
$ kubectl get pods -n cattle-monitoring-system

NAME                                                     READY   STATUS     RESTARTS   AGE
prometheus-rancher-monitoring-prometheus-0               0/3     Init:0/1   0          98s
rancher-monitoring-grafana-d9c56d79b-cp86w               0/3     Init:0/2   0          27s
...

$ kubectl get pods -n cattle-monitoring-system

NAME                                                     READY   STATUS    RESTARTS   AGE
prometheus-rancher-monitoring-prometheus-0               3/3     Running   0          7m57s
rancher-monitoring-grafana-d9c56d79b-cp86w               3/3     Running   0          6m46s
...
扩展 PV/卷大小
SUSE Virtualization 将 SUSE Storage 集成作为默认存储提供者。
SUSE Virtualization 监控使用持久卷 (PV) 存储运行数据。当集群运行一段时间后,持久卷可能需要扩展其大小。
有关如何增加卷大小的信息,请参阅 SUSE Storage 文档中的 卷扩展。
查看卷
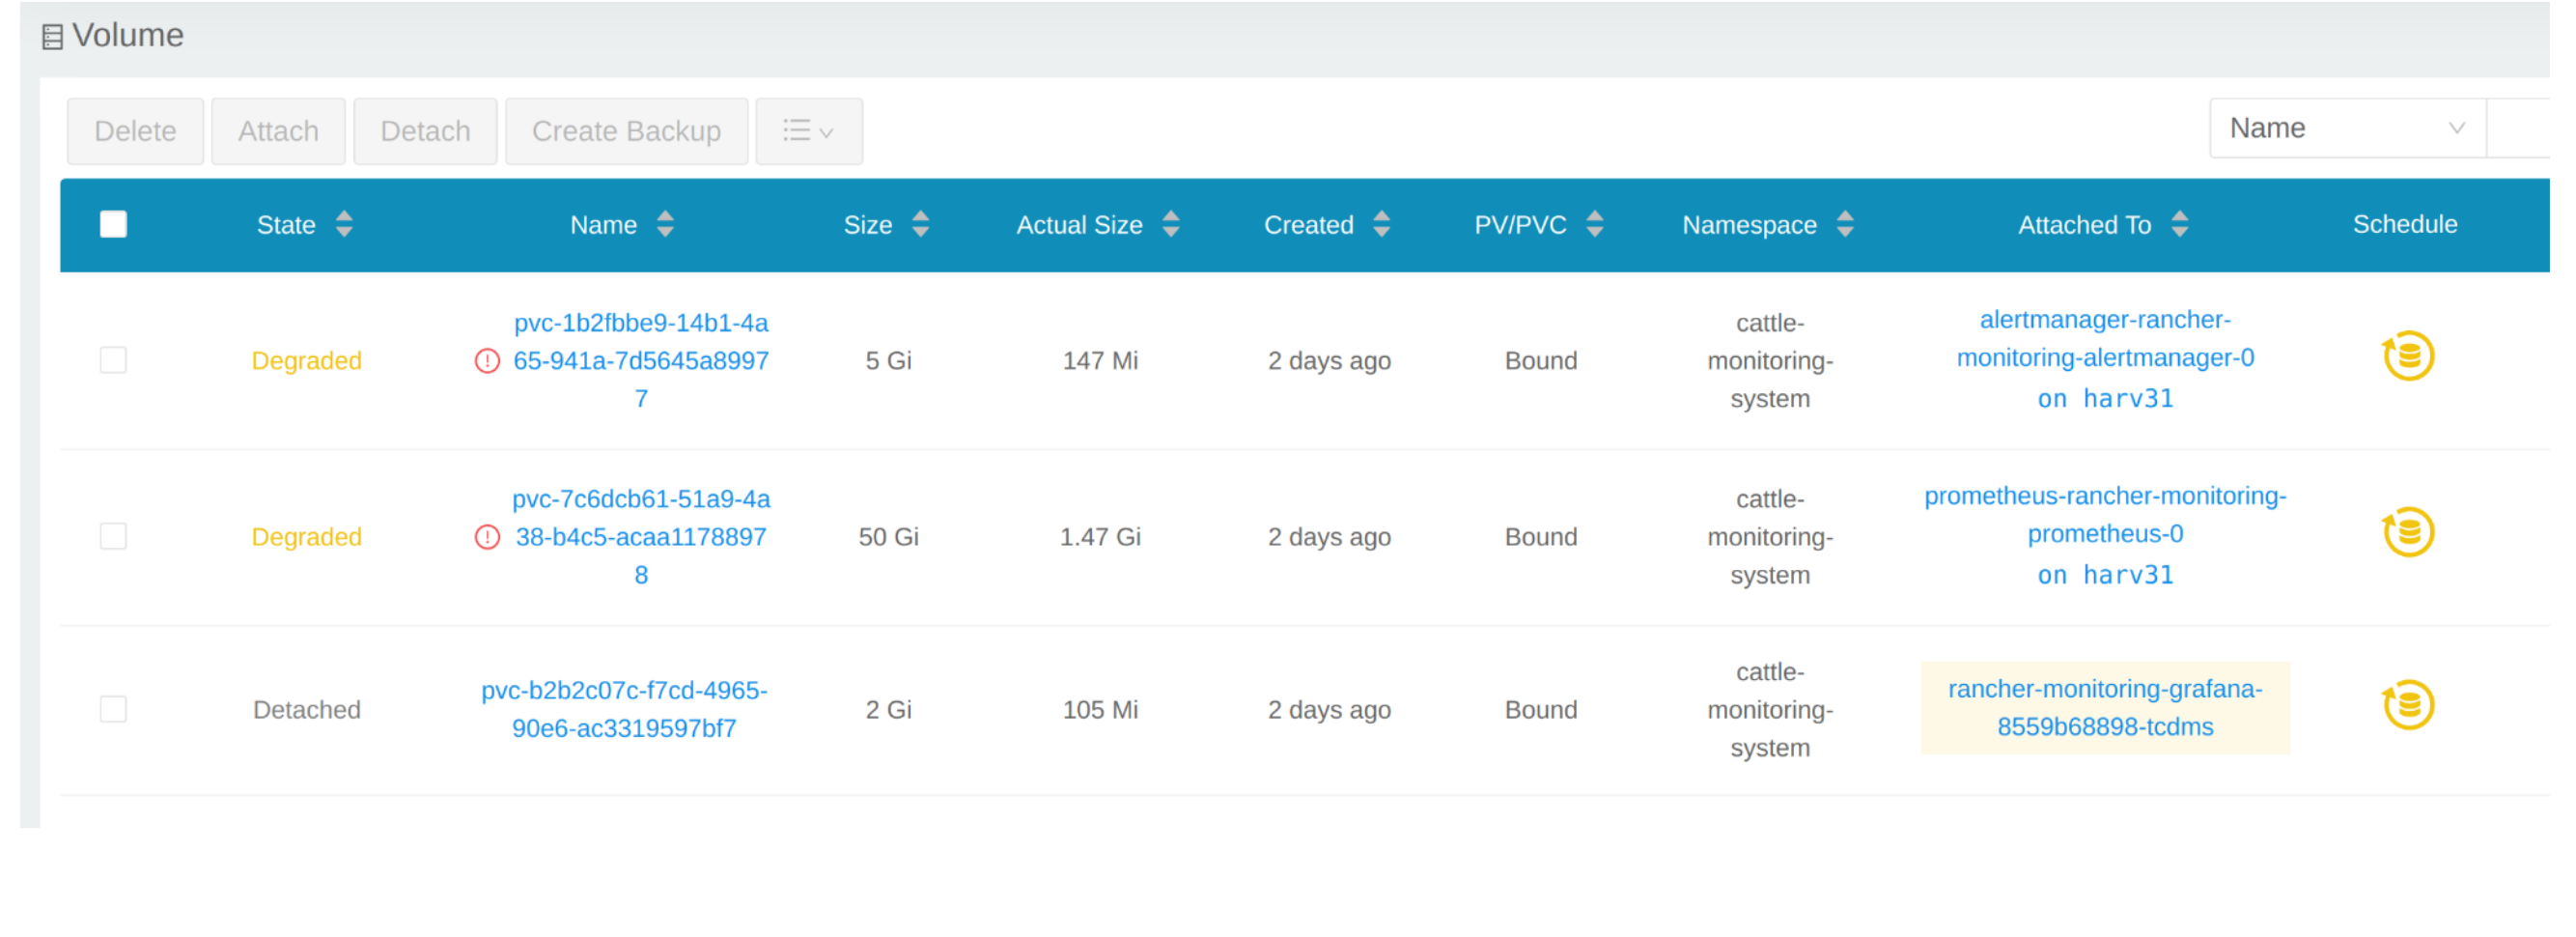
从 CLI
您还可以使用 kubectl 来获取所有卷。
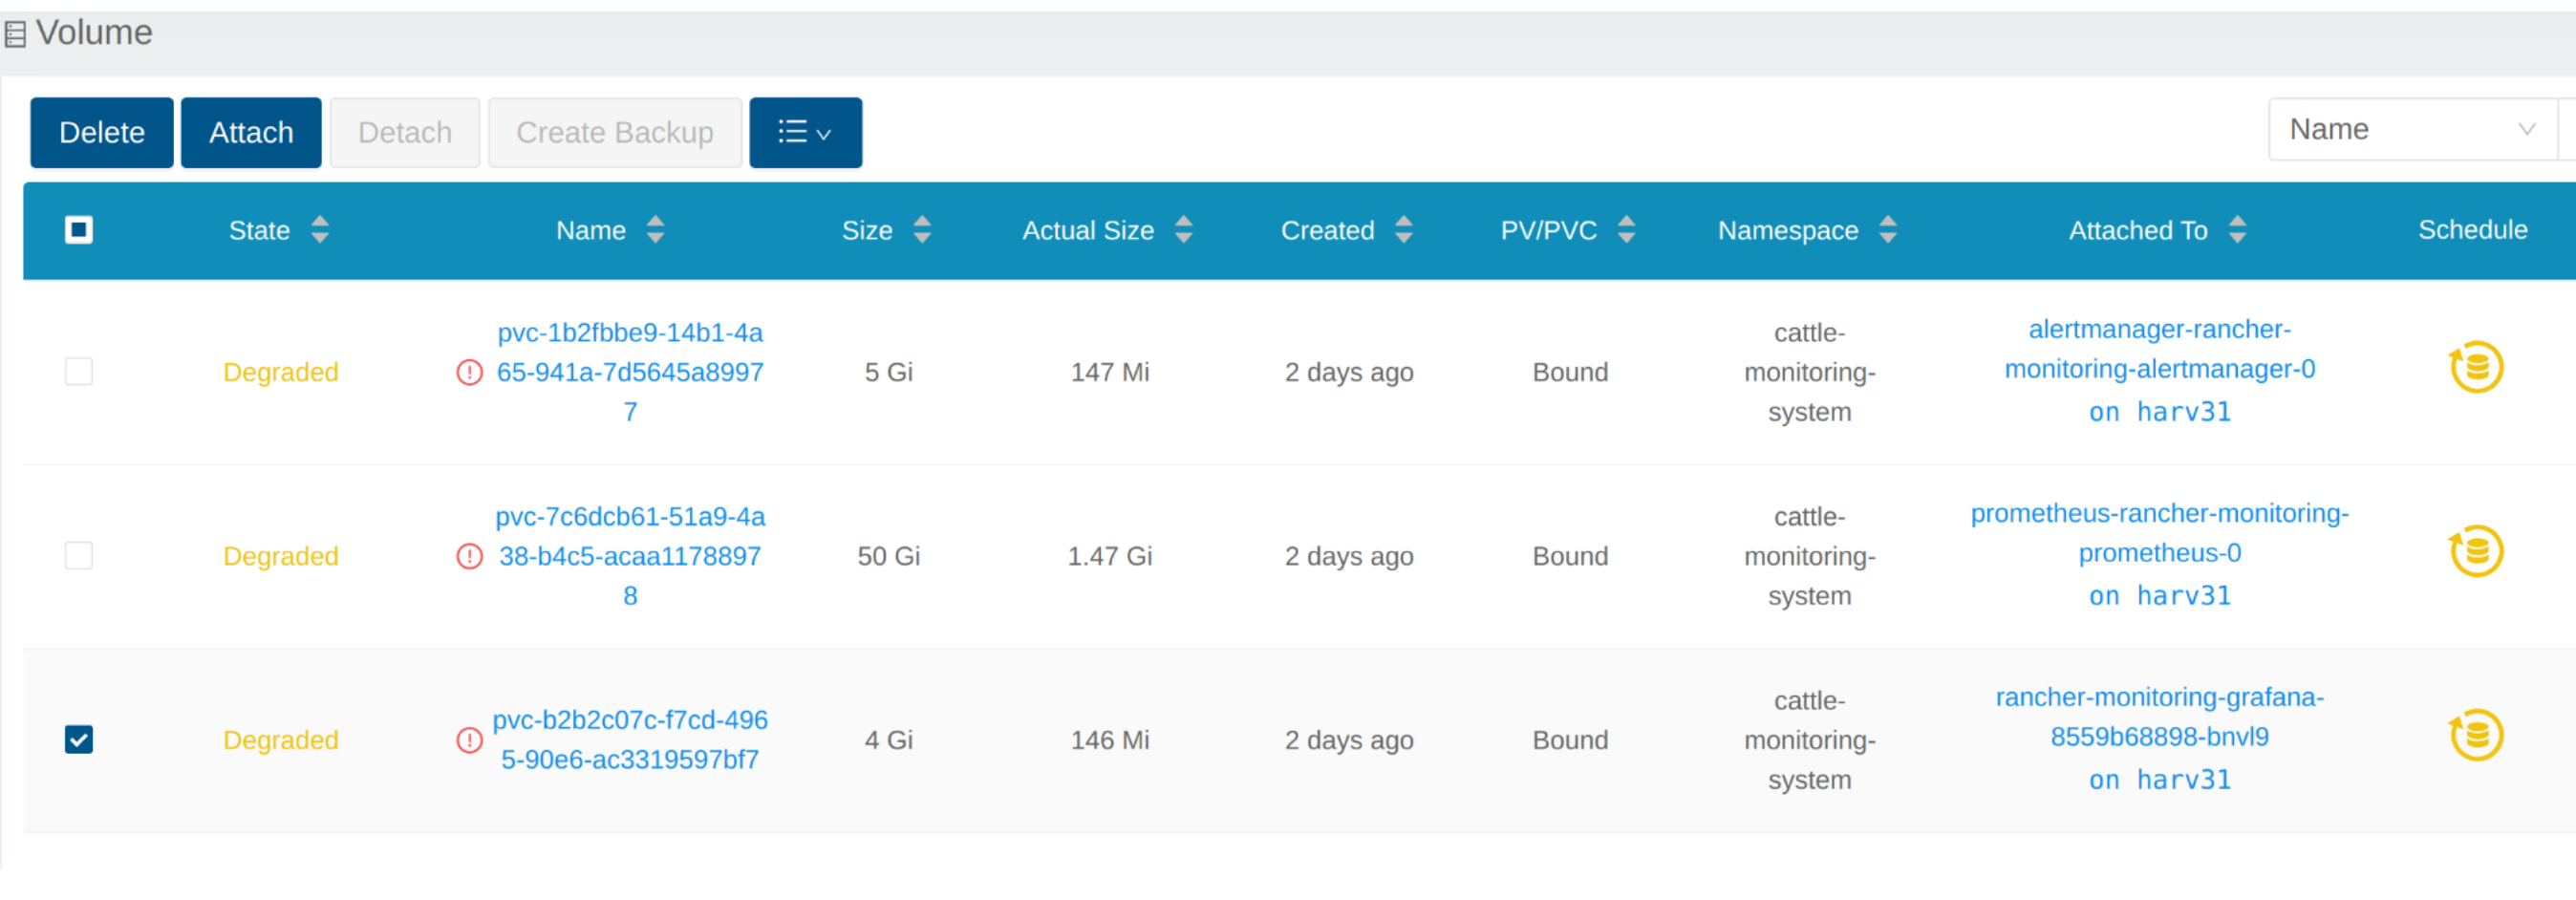
# kubectl get pvc -A
NAMESPACE                  NAME                                                                                             STATUS   VOLUME                                     CAPACITY   ACCESS MODES   STORAGECLASS         AGE
cattle-monitoring-system   alertmanager-rancher-monitoring-alertmanager-db-alertmanager-rancher-monitoring-alertmanager-0   Bound    pvc-1b2fbbe9-14b1-4a65-941a-7d5645a89977   5Gi        RWO            harvester-longhorn   43h
cattle-monitoring-system   prometheus-rancher-monitoring-prometheus-db-prometheus-rancher-monitoring-prometheus-0           Bound    pvc-7c6dcb61-51a9-4a38-b4c5-acaa11788978   50Gi       RWO            harvester-longhorn   43h
cattle-monitoring-system   rancher-monitoring-grafana                                                                       Bound    pvc-b2b2c07c-f7cd-4965-90e6-ac3319597bf7   2Gi        RWO            harvester-longhorn   43h

# kubectl get volume -A
NAMESPACE         NAME                                       STATE      ROBUSTNESS   SCHEDULED   SIZE          NODE     AGE
longhorn-system   pvc-1b2fbbe9-14b1-4a65-941a-7d5645a89977   attached   degraded                 5368709120    harv31   43h
longhorn-system   pvc-7c6dcb61-51a9-4a38-b4c5-acaa11788978   attached   degraded                 53687091200   harv31   43h
longhorn-system   pvc-b2b2c07c-f7cd-4965-90e6-ac3319597bf7   attached   degraded                 2147483648    harv31   43h
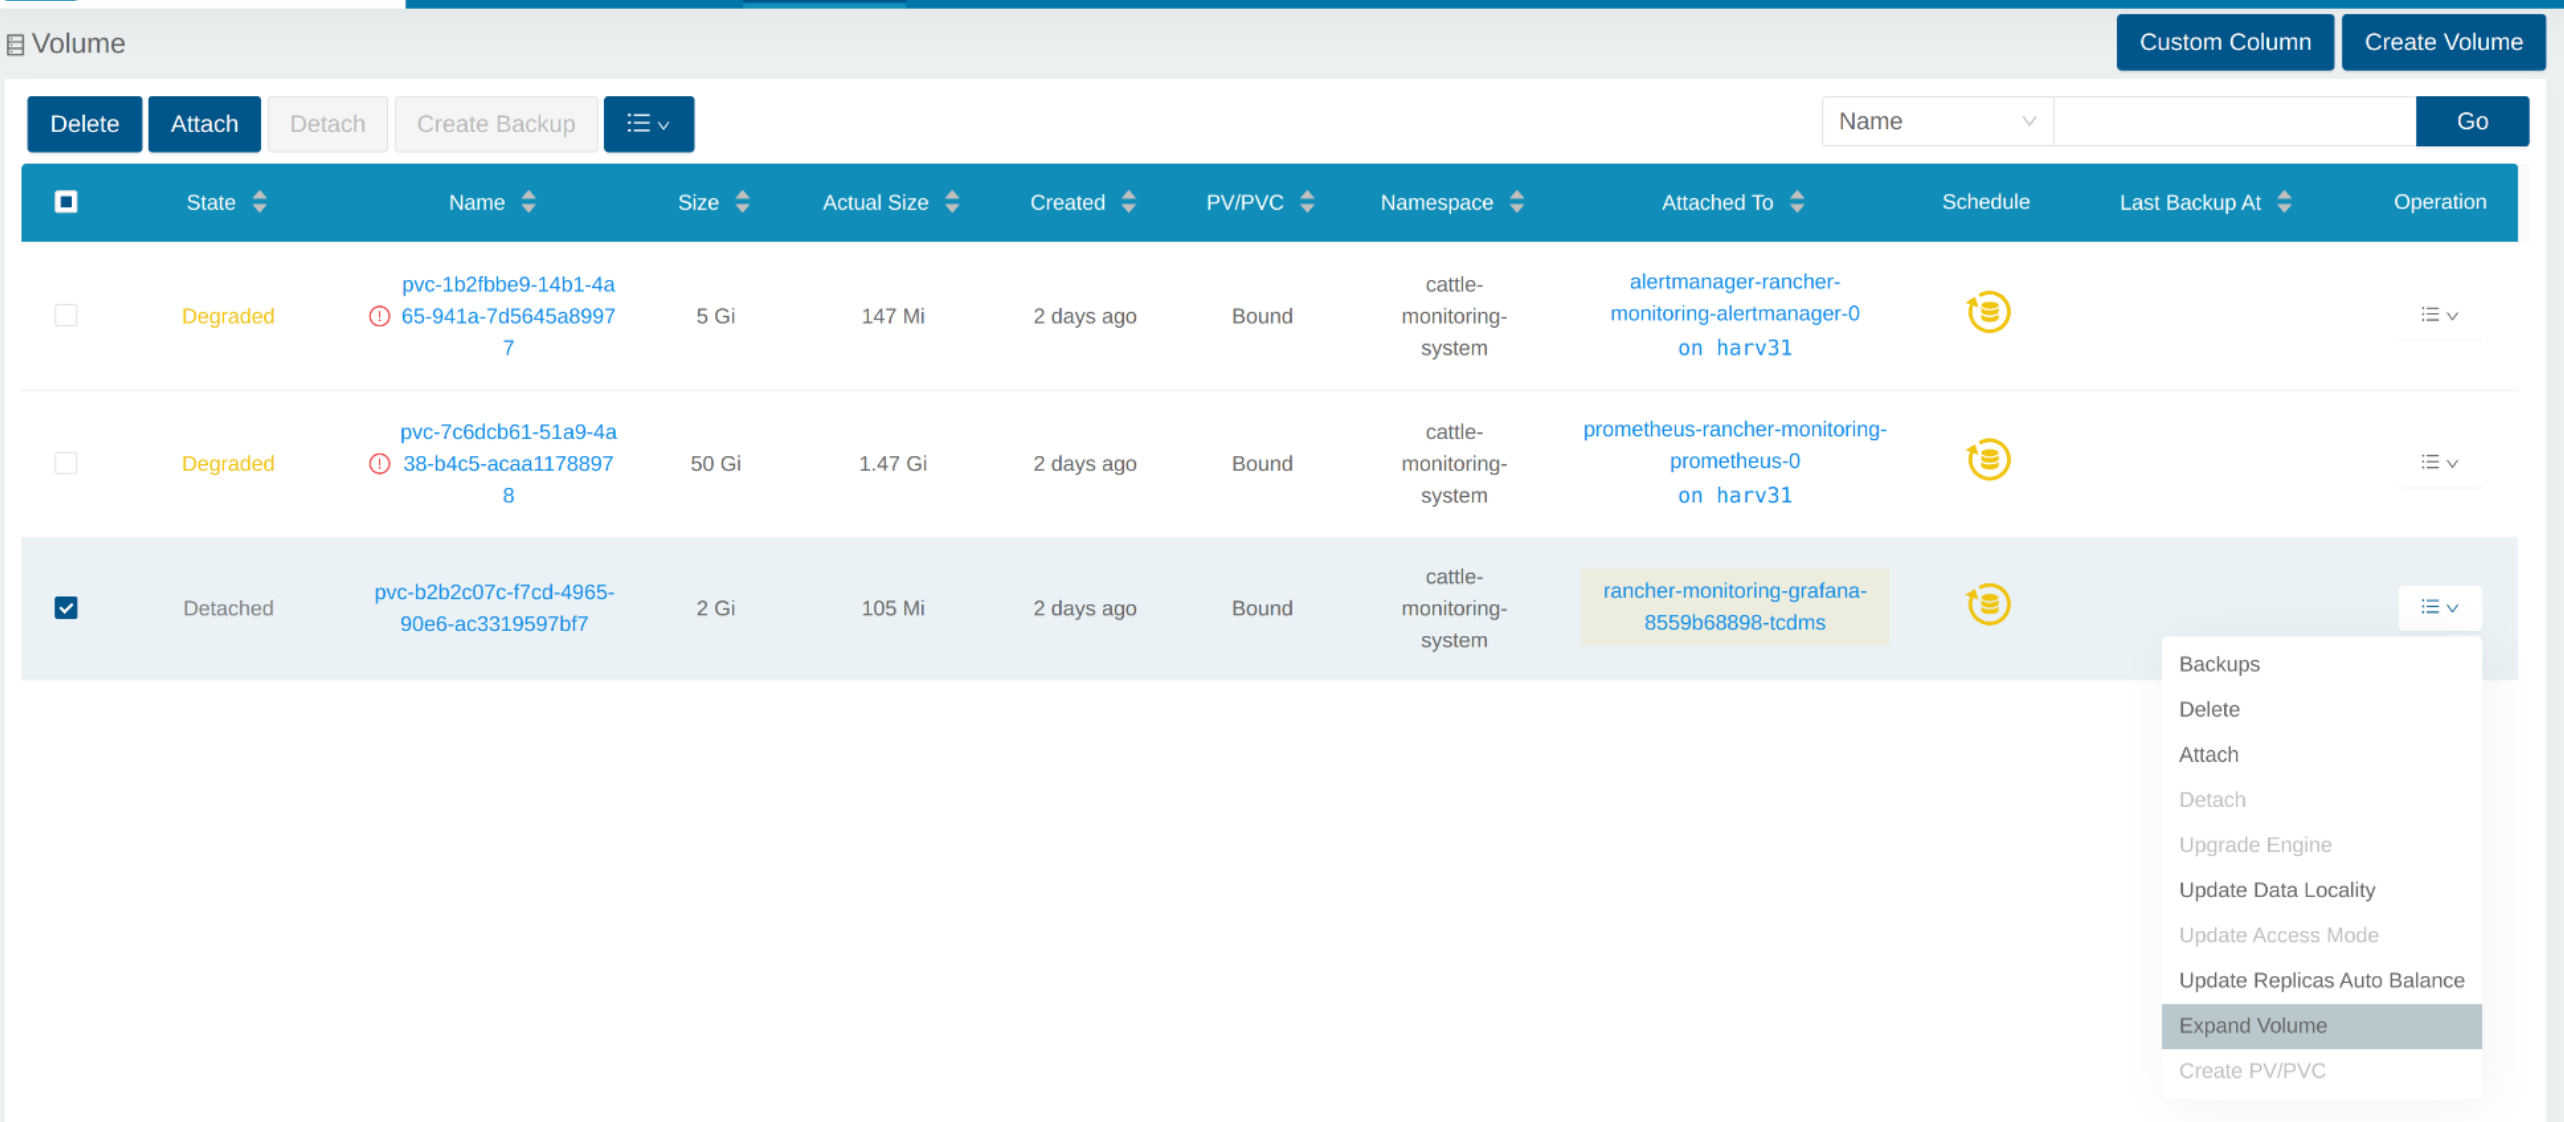
缩减部署规模
要分离`Volume`,您需要缩减使用`Volume`的`deployment`。
下面的示例是针对`rancher-monitoring-grafana`声明的PVC。
在命名空间`cattle-monitoring-system`中找到`deployment`。
# kubectl get deployment -n cattle-monitoring-system
NAME                                    READY   UP-TO-DATE   AVAILABLE   AGE
rancher-monitoring-grafana              1/1     1            1           43h  // target deployment
rancher-monitoring-kube-state-metrics   1/1     1            1           43h
rancher-monitoring-operator             1/1     1            1           43h
rancher-monitoring-prometheus-adapter   1/1     1            1           43h
将部署`rancher-monitoring-grafana`的规模缩减到0。
# kubectl scale --replicas=0 deployment/rancher-monitoring-grafana -n cattle-monitoring-system
检查部署和卷。
# kubectl get deployment -n cattle-monitoring-system
NAME                                    READY   UP-TO-DATE   AVAILABLE   AGE
rancher-monitoring-grafana              0/0     0            0           43h  // scaled down
rancher-monitoring-kube-state-metrics   1/1     1            1           43h
rancher-monitoring-operator             1/1     1            1           43h
rancher-monitoring-prometheus-adapter   1/1     1            1           43h

# kubectl get volume -A
NAMESPACE         NAME                                       STATE      ROBUSTNESS   SCHEDULED   SIZE          NODE     AGE
longhorn-system   pvc-1b2fbbe9-14b1-4a65-941a-7d5645a89977   attached   degraded                 5368709120    harv31   43h
longhorn-system   pvc-7c6dcb61-51a9-4a38-b4c5-acaa11788978   attached   degraded                 53687091200   harv31   43h
longhorn-system   pvc-b2b2c07c-f7cd-4965-90e6-ac3319597bf7   detached   unknown                  2147483648             43h  // volume is detached
扩展卷
在SUSE Storage的用户界面中,相关卷变为`Detached`。点击`Operation`列中的图标,然后选择`Expand Volume`。
输入一个新大小,SUSE Storage将把卷扩展到这个大小。
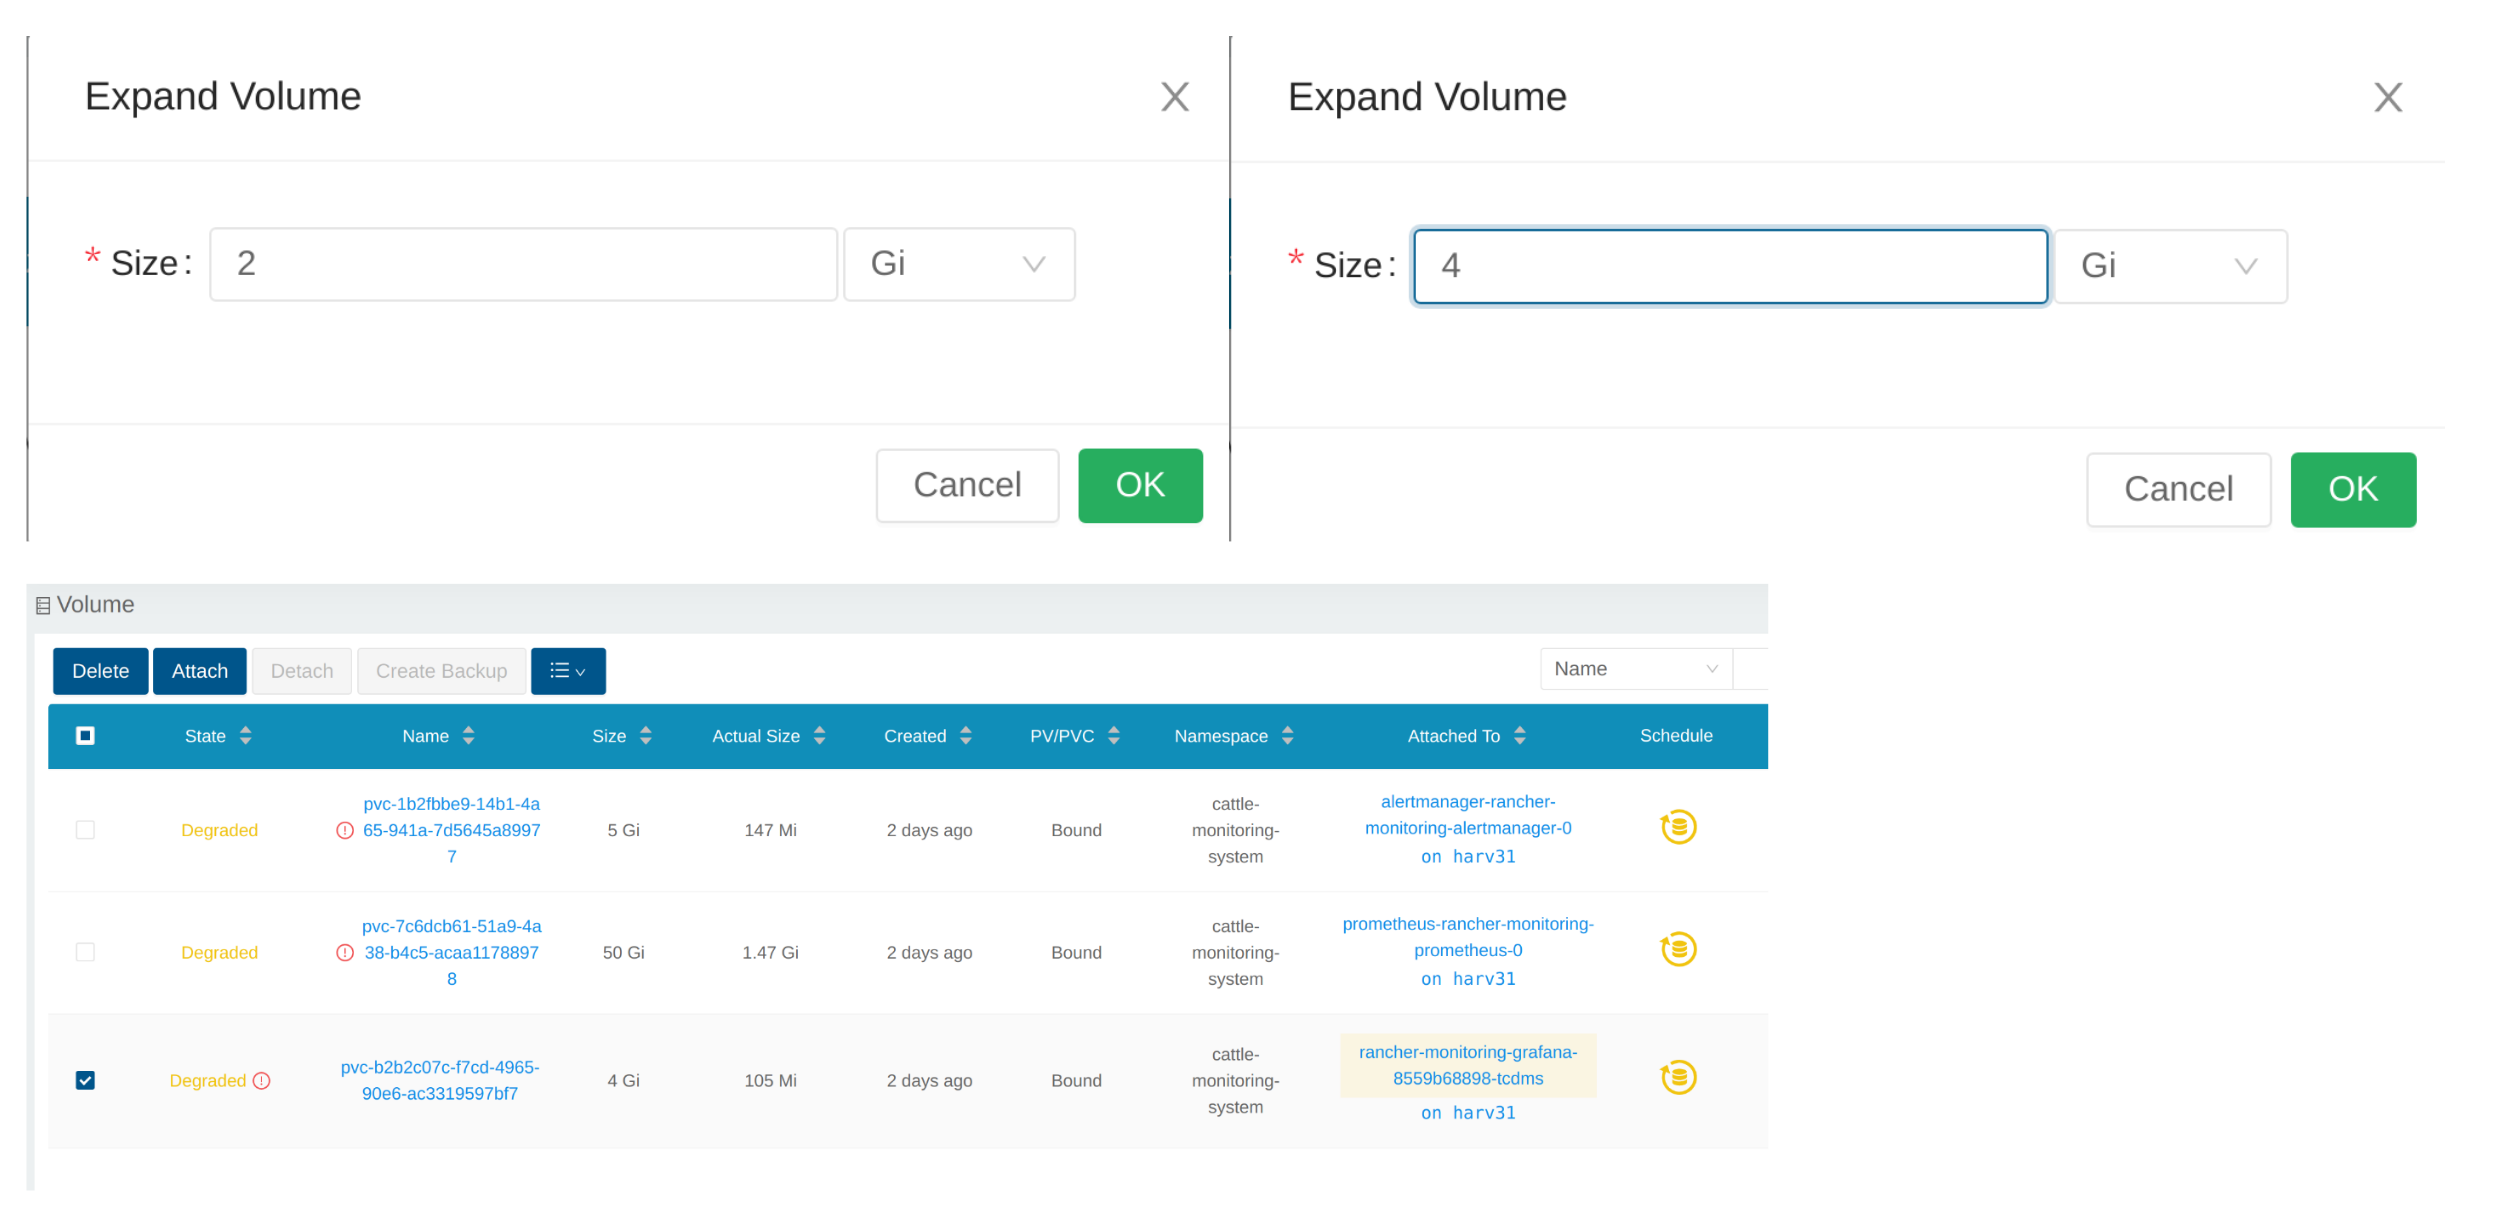
增加部署规模
在`Volume`扩展到目标大小后,您需要将上述部署的规模增加到其原始副本。对于上述`rancher-monitoring-grafana`的示例,原始副本为1。
# kubectl scale --replicas=1 deployment/rancher-monitoring-grafana -n cattle-monitoring-system
再次检查部署。
# kubectl get deployment -n cattle-monitoring-system
NAME                                    READY   UP-TO-DATE   AVAILABLE   AGE
rancher-monitoring-grafana              1/1     1            1           43h  // scaled up
rancher-monitoring-kube-state-metrics   1/1     1            1           43h
rancher-monitoring-operator             1/1     1            1           43h
rancher-monitoring-prometheus-adapter   1/1     1            1           43h
`Volume`已附加到新的POD。
到目前为止,`Volume`已扩展到新大小,POD正在顺利使用它。
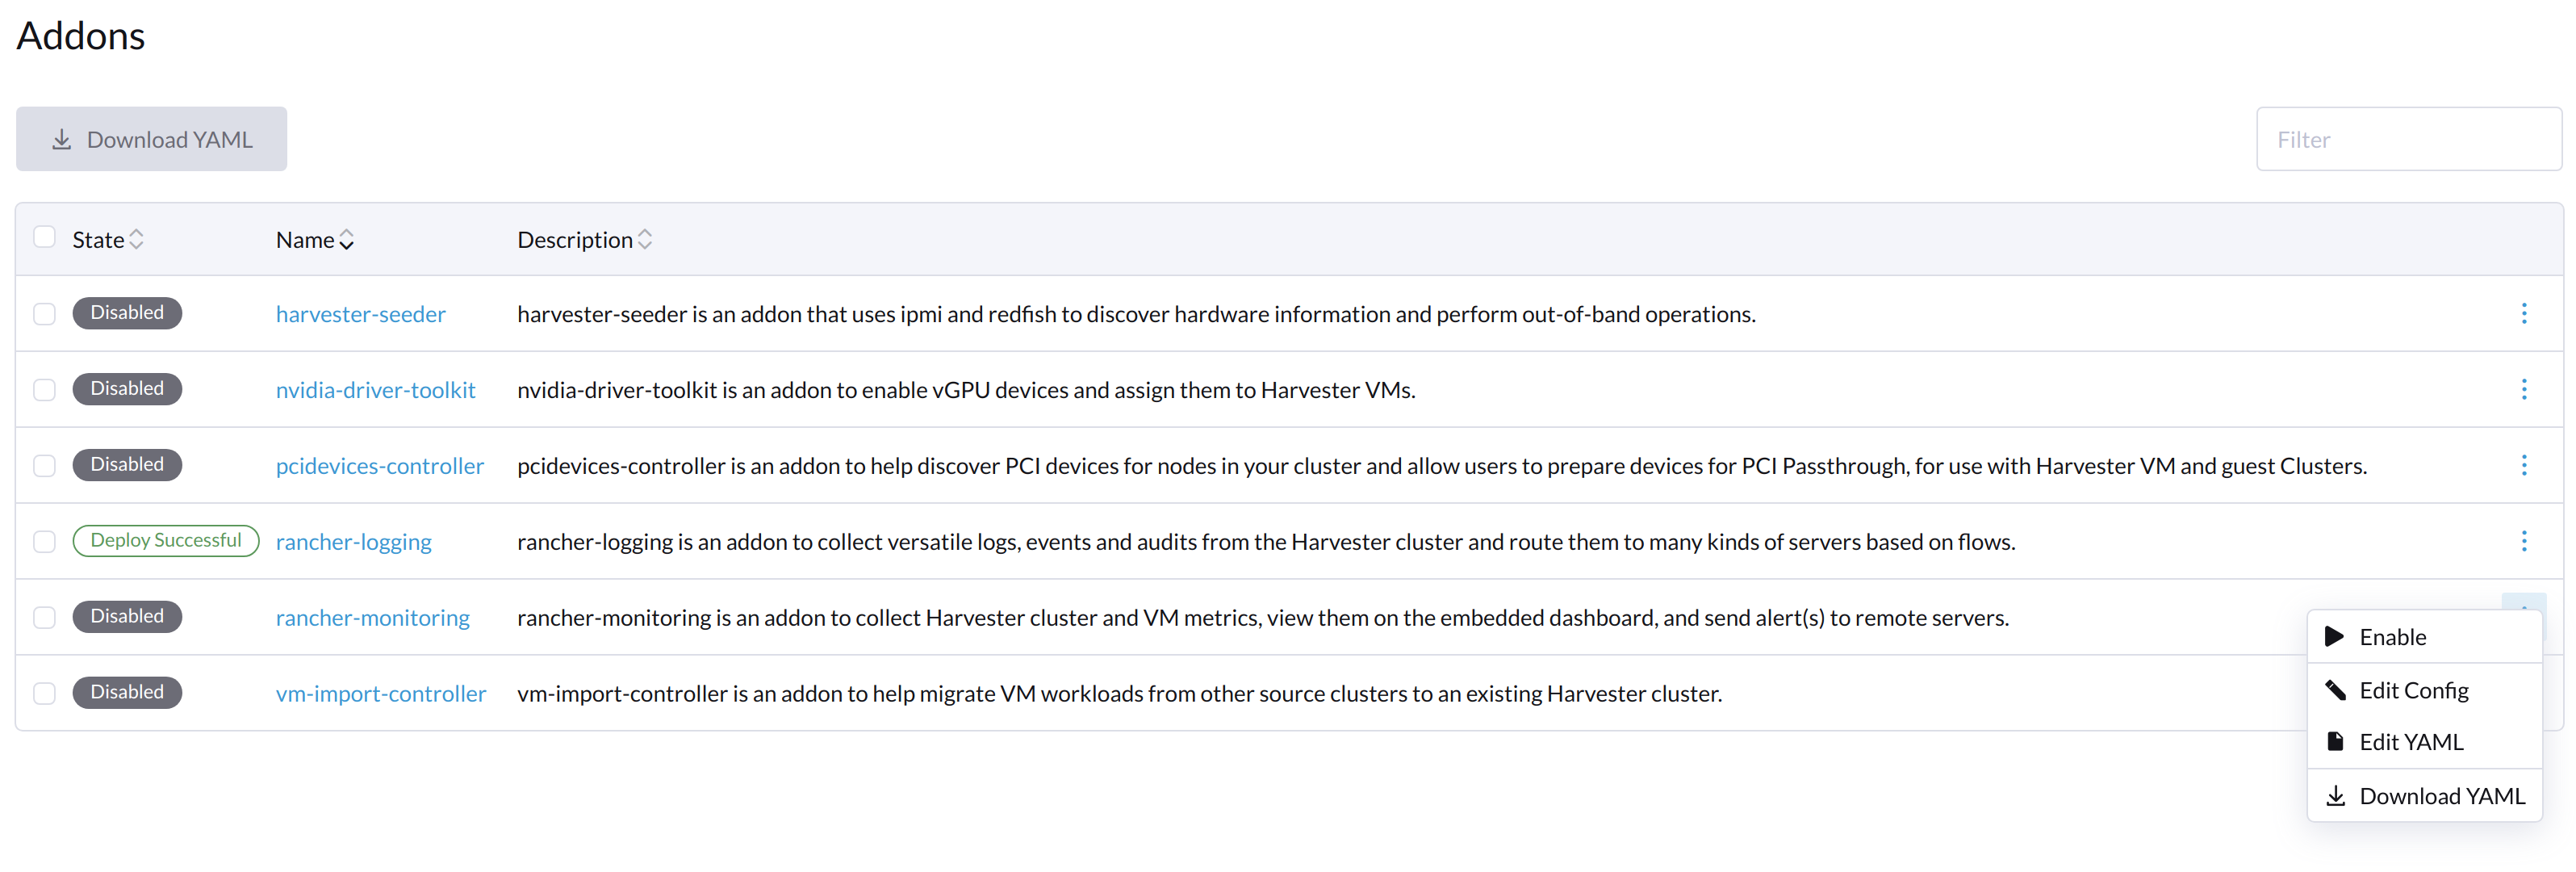
启用`rancher-monitoring`附加产品失败
当您在具有最低所需磁盘大小的集群上安装SUSE Virtualization v1.3.0或更高版本时,可能会遇到此问题。
重现步骤
-
安装SUSE Virtualization集群。
-
启用`rancher-monitoring`附加产品,您将观察到:
-
在`cattle-monitoring-system`命名空间中的POD `prometheus-rancher-monitoring-prometheus-0`由于附加的PVC失败而无法启动。
$ kubectl get pods -n cattle-monitoring-system NAME READY STATUS RESTARTS AGE alertmanager-rancher-monitoring-alertmanager-0 2/2 Running 0 3m22s helm-install-rancher-monitoring-4b5mx 0/1 Completed 0 3m41s prometheus-rancher-monitoring-prometheus-0 0/3 Init:0/1 0 3m21s // stuck in this status rancher-monitoring-grafana-d6f466988-hgpkb 4/4 Running 0 3m26s rancher-monitoring-kube-state-metrics-7659b76cc4-66sr7 1/1 Running 0 3m26s rancher-monitoring-operator-595476bc84-7hdxj 1/1 Running 0 3m25s rancher-monitoring-prometheus-adapter-55dc9ccd5d-pcrpk 1/1 Running 0 3m26s rancher-monitoring-prometheus-node-exporter-pbzv4 1/1 Running 0 3m26s $ kubectl describe pod -n cattle-monitoring-system prometheus-rancher-monitoring-prometheus-0 Name: prometheus-rancher-monitoring-prometheus-0 Namespace: cattle-monitoring-system Priority: 0 Service Account: rancher-monitoring-prometheus ... Events: Type Reason Age From Message ---- ------ ---- ---- ------- Warning FailedScheduling 3m48s (x3 over 4m15s) default-scheduler 0/1 nodes are available: pod has unbound immediate PersistentVolumeClaims. preemption: 0/1 nodes are available: 1 Preemption is not helpful for scheduling.. Normal Scheduled 3m44s default-scheduler Successfully assigned cattle-monitoring-system/prometheus-rancher-monitoring-prometheus-0 to harv41 Warning FailedMount 101s kubelet Unable to attach or mount volumes: unmounted volumes=[prometheus-rancher-monitoring-prometheus-db], unattached volumes=[prometheus-rancher-monitoring-prometheus-db], failed to process volumes=[]: timed out waiting for the condition Warning FailedAttachVolume 90s (x9 over 3m42s) attachdetach-controller AttachVolume.Attach failed for volume "pvc-bbe8760d-926c-484a-851c-b8ec29ae05c0" : rpc error: code = Aborted desc = volume pvc-bbe8760d-926c-484a-851c-b8ec29ae05c0 is not ready for workloads $ kubectl get pvc -A NAMESPACE NAME STATUS VOLUME CAPACITY ACCESS MODES STORAGECLASS AGE cattle-monitoring-system prometheus-rancher-monitoring-prometheus-db-prometheus-rancher-monitoring-prometheus-0 Bound pvc-bbe8760d-926c-484a-851c-b8ec29ae05c0 50Gi RWO harvester-longhorn 7m12s $ kubectl get volume -A NAMESPACE NAME DATA ENGINE STATE ROBUSTNESS SCHEDULED SIZE NODE AGE longhorn-system pvc-bbe8760d-926c-484a-851c-b8ec29ae05c0 v1 detached unknown 53687091200 6m55s -
Longhorn Manager 无法调度副本。
  $ kubectl logs -n longhorn-system longhorn-manager-bf65b | grep "pvc-bbe8760d-926c-484a-851c-b8ec29ae05c0"

  time="2024-02-19T10:12:56Z" level=error msg="There's no available disk for replica pvc-bbe8760d-926c-484a-851c-b8ec29ae05c0-r-dcb129fd, size 53687091200" func="schedule
  r.(*ReplicaScheduler).ScheduleReplica" file="replica_scheduler.go:95"
  time="2024-02-19T10:12:56Z" level=warning msg="Failed to schedule replica" func="controller.(*VolumeController).reconcileVolumeCondition" file="volume_controller.go:169
  4" accessMode=rwo controller=longhorn-volume frontend=blockdev migratable=false node=harv41 owner=harv41 replica=pvc-bbe8760d-926c-484a-851c-b8ec29ae05c0-r-dcb129fd sta
  te= volume=pvc-bbe8760d-926c-484a-851c-b8ec29ae05c0
  ...
-
解决方法
-
如果您已经启用了`rancher-monitoring`附加产品,请禁用它。
`cattle-monitoring-system`中的所有POD已被删除,但PVC被保留。有关更多信息,请参见[附加产品]。
 $ kubectl get pods -n cattle-monitoring-system
 No resources found in cattle-monitoring-system namespace.

 $ kubectl get pvc -n cattle-monitoring-system
 NAME                                                                                             STATUS   VOLUME                                     CAPACITY   ACCESS MODES   STORAGECLASS         AGE
 alertmanager-rancher-monitoring-alertmanager-db-alertmanager-rancher-monitoring-alertmanager-0   Bound    pvc-cea6316e-f74f-4771-870b-49edb5442819   5Gi        RWO            harvester-longhorn   14m
 prometheus-rancher-monitoring-prometheus-db-prometheus-rancher-monitoring-prometheus-0           Bound    pvc-bbe8760d-926c-484a-851c-b8ec29ae05c0   50Gi       RWO            harvester-longhorn   14m
-
删除名为`prometheus`的PVC,但保留名为`alertmanager`的PVC。
 $ kubectl delete pvc -n cattle-monitoring-system prometheus-rancher-monitoring-prometheus-db-prometheus-rancher-monitoring-prometheus-0
 persistentvolumeclaim "prometheus-rancher-monitoring-prometheus-db-prometheus-rancher-monitoring-prometheus-0" deleted

 $ kubectl get pvc -n cattle-monitoring-system
 NAME                                                                                             STATUS   VOLUME                                     CAPACITY   ACCESS MODES   STORAGECLASS         AGE
 alertmanager-rancher-monitoring-alertmanager-db-alertmanager-rancher-monitoring-alertmanager-0   Bound    pvc-cea6316e-f74f-4771-870b-49edb5442819   5Gi        RWO            harvester-longhorn   16m
-
在SUSE Virtualization UI的*附加产品*屏幕上,选择*⋮(菜单图标),然后选择*编辑YAML。
-
如下面所示,将 prometheusSpec 下的数字
50的两个出现更改为30,然后保存。`prometheus`功能将使用30GiB磁盘来存储数据。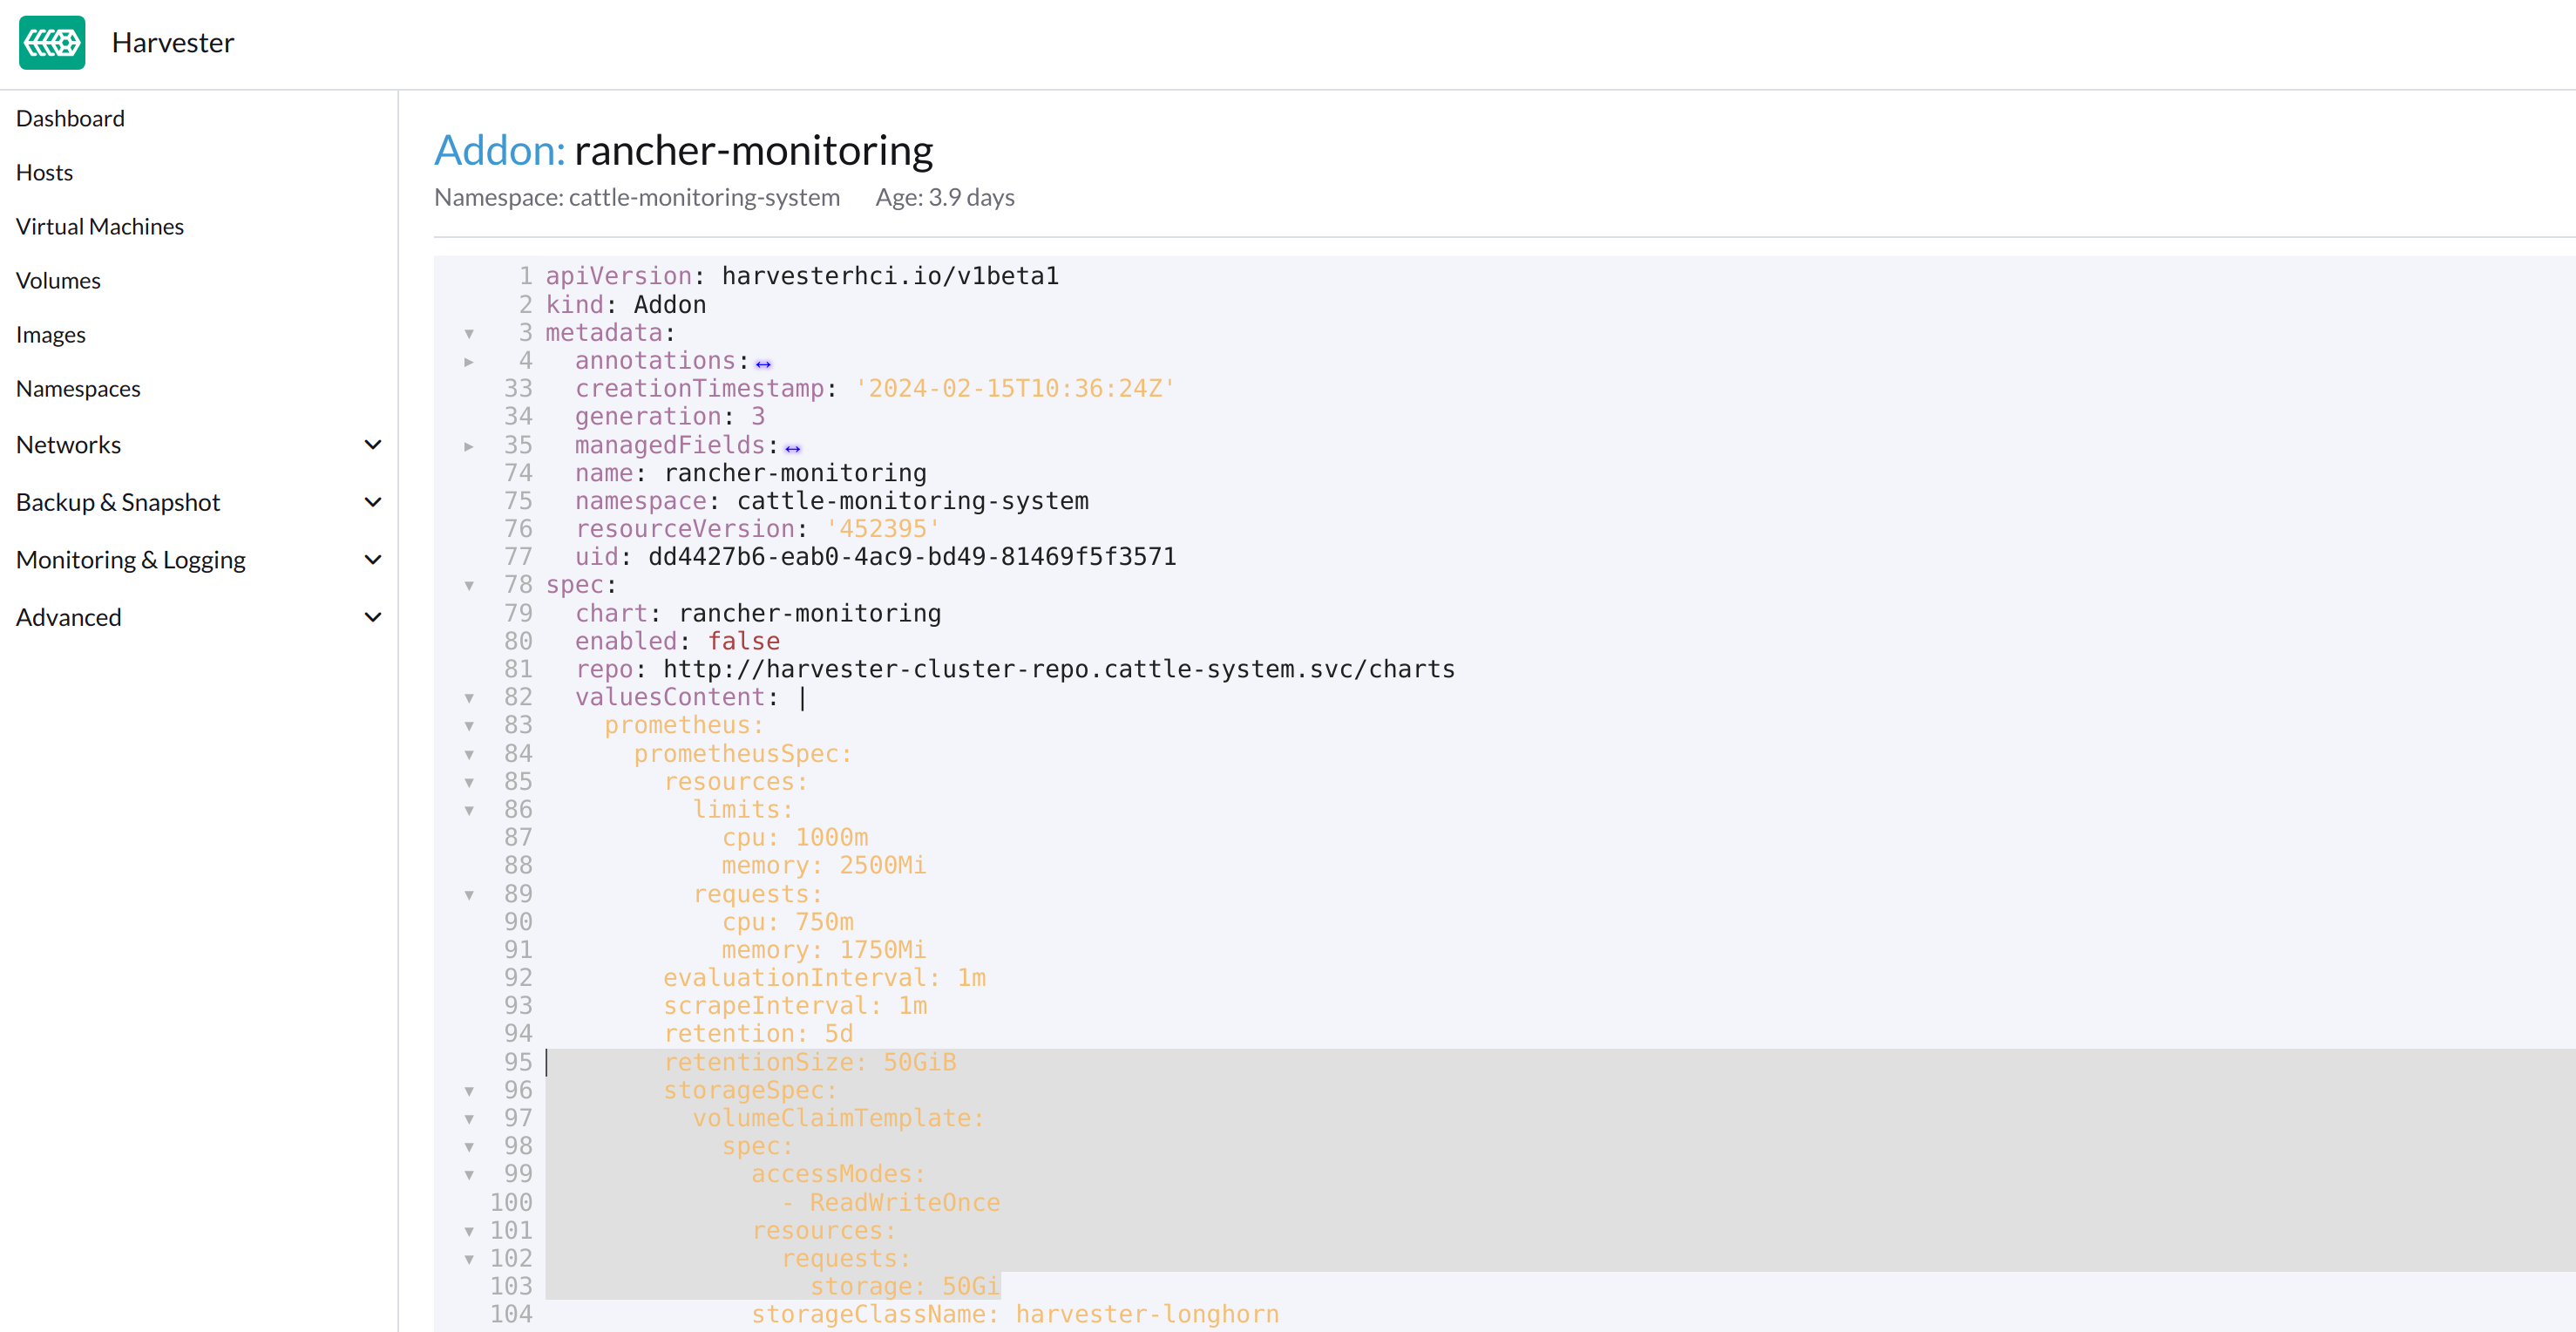
或者,您可以使用`kubectl`来编辑该对象。
kubectl edit addons.harvesterhci.io -n cattle-monitoring-system rancher-monitoringretentionSize: 50GiB // Change 50 to 30 storageSpec: volumeClaimTemplate: spec: accessModes: - ReadWriteOnce resources: requests: storage: 50Gi // Change 50 to 30 storageClassName: harvester-longhorn -
启用`rancher-monitoring`附加产品并等待几分钟。
-
所有POD已成功部署,`rancher-monitoring`功能可用。
 $ kubectl get pods -n cattle-monitoring-system
 NAME                                                     READY   STATUS      RESTARTS   AGE
 alertmanager-rancher-monitoring-alertmanager-0           2/2     Running     0          3m52s
 helm-install-rancher-monitoring-s55tq                    0/1     Completed   0          4m17s
 prometheus-rancher-monitoring-prometheus-0               3/3     Running     0          3m51s
 rancher-monitoring-grafana-d6f466988-hkv6f               4/4     Running     0          3m55s
 rancher-monitoring-kube-state-metrics-7659b76cc4-ght8x   1/1     Running     0          3m55s
 rancher-monitoring-operator-595476bc84-r96bp             1/1     Running     0          3m55s
 rancher-monitoring-prometheus-adapter-55dc9ccd5d-vtssc   1/1     Running     0          3m55s
 rancher-monitoring-prometheus-node-exporter-lgb88        1/1     Running     0          3m55s
rancher-monitoring-crd ManagedChart状态为`Modified`
问题描述
在某些情况下,rancher-monitoring-crd ManagedChart对象的状态更改为`Modified`(消息为`…rancher-monitoring-crd-manager missing…`)。
示例:
 $ kubectl get managedchart rancher-monitoring-crd -n fleet-local -o yaml
 apiVersion: management.cattle.io/v3
 kind: ManagedChart
 ...
 spec:
   chart: rancher-monitoring-crd
   defaultNamespace: cattle-monitoring-system
   paused: false
   releaseName: rancher-monitoring-crd
   repoName: harvester-charts
   targets:
   - clusterName: local
     clusterSelector:
       matchExpressions:
       - key: provisioning.cattle.io/unmanaged-system-agent
         operator: DoesNotExist
   version: 102.0.0+up40.1.2
 ...
 status:
   conditions:
   - lastUpdateTime: "2024-02-22T14:03:11Z"
     message: Modified(1) [Cluster fleet-local/local]; clusterrole.rbac.authorization.k8s.io
       rancher-monitoring-crd-manager missing; clusterrolebinding.rbac.authorization.k8s.io
       rancher-monitoring-crd-manager missing; configmap.v1 cattle-monitoring-system/rancher-monitoring-crd-manifest
       missing; serviceaccount.v1 cattle-monitoring-system/rancher-monitoring-crd-manager
       missing
     status: "False"
     type: Ready
   - lastUpdateTime: "2024-02-22T14:03:11Z"
     status: "True"
     type: Processed
   - lastUpdateTime: "2024-04-02T07:45:26Z"
     status: "True"
     type: Defined
   display:
     readyClusters: 0/1
     state: Modified
 ...
`ManagedChart`对象有一个名为`Bundle`的下游对象,具有类似的信息。
示例:
 $ kubectl get bundles -A
 NAMESPACE     NAME                                          BUNDLEDEPLOYMENTS-READY   STATUS
 fleet-local   fleet-agent-local                             1/1
 fleet-local   local-managed-system-agent                    1/1
 fleet-local   mcc-harvester                                 1/1
 fleet-local   mcc-harvester-crd                             1/1
 fleet-local   mcc-local-managed-system-upgrade-controller   1/1
 fleet-local   mcc-rancher-logging-crd                       1/1
fleet-local mcc-rancher-monitoring-crd 0/1 Modified(1) [Cluster fleet-local/local]; clusterrole.rbac.authorization.k8s.io rancher-monitoring-crd-manager missing; clusterrolebinding.rbac.authorization.k8s.io rancher-monitoring-crd-manager missing; configmap.v1 cattle-monitoring-system/rancher-monitoring-crd-manifest missing; serviceaccount.v1 cattle-monitoring-system/rancher-monitoring-crd-manager missing当问题存在且您开始升级时,SUSE Virtualization可能会返回以下错误消息:admission webhook "validator.harvesterhci.io" denied the request: managed chart rancher-monitoring-crd is not ready, please wait for it to be ready。
此外,当您搜索标记为`missing`的对象时,您会发现它们存在于集群中。
示例:
$ kubectl get clusterrole rancher-monitoring-crd-manager
apiVersion: rbac.authorization.k8s.io/v1
kind: ClusterRole
metadata:
  annotations:
    meta.helm.sh/release-name: rancher-monitoring-crd
    meta.helm.sh/release-namespace: cattle-monitoring-system
  creationTimestamp: "2023-01-09T11:04:33Z"
  labels:
    app: rancher-monitoring-crd-manager
    app.kubernetes.io/managed-by: Helm
  name: rancher-monitoring-crd-manager
  ...
rules:
- apiGroups:
  - apiextensions.k8s.io
  resources:
  - customresourcedefinitions
  verbs:
  - create
  - get
  - patch
  - delete

$ kubectl get clusterrolebinding rancher-monitoring-crd-manager
apiVersion: rbac.authorization.k8s.io/v1
kind: ClusterRoleBinding
metadata:
  annotations:
    meta.helm.sh/release-name: rancher-monitoring-crd
    meta.helm.sh/release-namespace: cattle-monitoring-system
  creationTimestamp: "2023-01-09T11:04:33Z"
  labels:
    app: rancher-monitoring-crd-manager
    app.kubernetes.io/managed-by: Helm
  name: rancher-monitoring-crd-manager
  ...
roleRef:
  apiGroup: rbac.authorization.k8s.io
  kind: ClusterRole
  name: rancher-monitoring-crd-manager
subjects:
- kind: ServiceAccount
  name: rancher-monitoring-crd-manager
  namespace: cattle-monitoring-system

$ kubectl get configmap -n cattle-monitoring-system rancher-monitoring-crd-manifest
apiVersion: v1
data:
  crd-manifest.tgz.b64: ...
kind: ConfigMap
metadata:
  annotations:
    meta.helm.sh/release-name: rancher-monitoring-crd
    meta.helm.sh/release-namespace: cattle-monitoring-system
  creationTimestamp: "2023-01-09T11:04:33Z"
  labels:
    app.kubernetes.io/managed-by: Helm
  name: rancher-monitoring-crd-manifest
  namespace: cattle-monitoring-system
  ...

$ kubectl get ServiceAccount -n cattle-monitoring-system rancher-monitoring-crd-manager
apiVersion: v1
kind: ServiceAccount
metadata:
  annotations:
    meta.helm.sh/release-name: rancher-monitoring-crd
    meta.helm.sh/release-namespace: cattle-monitoring-system
  creationTimestamp: "2023-01-09T11:04:33Z"
  labels:
    app: rancher-monitoring-crd-manager
    app.kubernetes.io/managed-by: Helm
  name: rancher-monitoring-crd-manager
  namespace: cattle-monitoring-system
  ...
根本原因
标记为 missing 的对象没有 ManagedChart 对象所需的相关注释和标签。
示例:
apiVersion: rbac.authorization.k8s.io/v1
kind: ClusterRole
metadata:
  annotations:
    meta.helm.sh/release-name: rancher-monitoring-crd
    meta.helm.sh/release-namespace: cattle-monitoring-system
    objectset.rio.cattle.io/id: default-mcc-rancher-monitoring-crd-cattle-fleet-local-system   # This required item is not in the above object.
  creationTimestamp: "2024-04-03T10:23:55Z"
  labels:
    app: rancher-monitoring-crd-manager
    app.kubernetes.io/managed-by: Helm
    objectset.rio.cattle.io/hash: 2da503261617e9ea2da822d2da7cdcfccad847a9    # This required item is not in the above object.
  name: rancher-monitoring-crd-manager
...
rules:
- apiGroups:
  - apiextensions.k8s.io
  resources:
  - customresourcedefinitions
  verbs:
  - create
  - get
  - patch
  - delete
  - update
解决方法
-
修补 ClusterRole 对象
rancher-monitoring-crd-manager以添加update操作。$ cat > patchrules.yaml << EOF rules: - apiGroups: - apiextensions.k8s.io resources: - customresourcedefinitions verbs: - create - get - patch - delete - update EOF $ kubectl patch ClusterRole rancher-monitoring-crd-manager --patch-file ./patchrules.yaml --type merge $ rm ./patchrules.yaml -
修补标记为
missing的对象以添加所需的注释和标签。$ cat > patchhash.yaml << EOF metadata: annotations: objectset.rio.cattle.io/id: default-mcc-rancher-monitoring-crd-cattle-fleet-local-system labels: objectset.rio.cattle.io/hash: 2da503261617e9ea2da822d2da7cdcfccad847a9 EOF $ kubectl patch ClusterRole rancher-monitoring-crd-manager --patch-file ./patchhash.yaml --type merge $ kubectl patch ClusterRoleBinding rancher-monitoring-crd-manager --patch-file ./patchhash.yaml --type merge $ kubectl patch ServiceAccount rancher-monitoring-crd-manager -n cattle-monitoring-system --patch-file ./patchhash.yaml --type merge $ kubectl patch ConfigMap rancher-monitoring-crd-manifest -n cattle-monitoring-system --patch-file ./patchhash.yaml --type merge $ rm ./patchhash.yaml -
检查
rancher-monitoring-crdManagedChart 对象。几秒钟后,
rancher-monitoring-crdManagedChart 对象的状态变为Ready。$ kubectl get managedchart -n fleet-local rancher-monitoring-crd -oyaml apiVersion: management.cattle.io/v3 kind: ManagedChart metadata: ... name: rancher-monitoring-crd namespace: fleet-local ... status: conditions: - lastUpdateTime: "2024-04-22T21:41:44Z" status: "True" type: Ready ...此外,下游对象不再显示错误指示器。
$ kubectl bundle -A NAMESPACE NAME BUNDLEDEPLOYMENTS-READY STATUS fleet-local fleet-agent-local 1/1 fleet-local local-managed-system-agent 1/1 fleet-local mcc-harvester 1/1 fleet-local mcc-harvester-crd 1/1 fleet-local mcc-local-managed-system-upgrade-controller 1/1 fleet-local mcc-rancher-logging-crd 1/1 fleet-local mcc-rancher-monitoring-crd 1/1 -
(可选)重试升级(如果之前因该问题未成功)。
一些 rancher-monitoring 附加产品 pod 被突然终止
问题描述
当启用 rancher-monitoring 附加产品时,与 Prometheus、Alertmanager 和 Grafana 相关的 pod 在创建后不久被终止。
示例:
$ kubectl -n cattle-monitoring-system get pods,svc,ep,deploy,pvc,sts,prometheus,alertmanager | grep -E 'stateful|deploy'

deployment.apps/rancher-monitoring-grafana              0/0     0            0           7h52m
deployment.apps/rancher-monitoring-kube-state-metrics   1/1     1            1           7h52m
deployment.apps/rancher-monitoring-operator             1/1     1            1           7h52m
deployment.apps/rancher-monitoring-prometheus-adapter   1/1     1            1           7h52m
statefulset.apps/alertmanager-rancher-monitoring-alertmanager   0/0     7h52m
statefulset.apps/prometheus-rancher-monitoring-prometheus       0/0     7h52m
prometheus pod 日志包含消息 level=warn msg="Received SIGTERM, exiting gracefully…"。
...
ts=2025-05-20T05:41:02.847Z caller=kubernetes.go:327 level=info component="discovery manager notify" discovery=kubernetes config=config-0 msg="Using pod service account via in-cluster config"
ts=2025-05-20T05:41:02.880Z caller=main.go:1261 level=info msg="Completed loading of configuration file" filename=/etc/prometheus/config_out/prometheus.env.yaml totalDuration=35.457401ms db_storage=998ns remote_storage=1.45µs web_handler=392ns query_engine=1.095µs scrape=34.384µs scrape_sd=515.81µs notify=10.226µs notify_sd=82.314µs rules=32.514863ms tracing=2.344µs
ts=2025-05-20T05:41:50.044Z caller=main.go:854 level=warn msg="Received SIGTERM, exiting gracefully..."
ts=2025-05-20T05:41:50.044Z caller=main.go:878 level=info msg="Stopping scrape discovery manager..."
ts=2025-05-20T05:41:50.044Z caller=main.go:892 level=info msg="Stopping notify discovery manager..."
...
prometheus CRD 对象包括 `storage-network.settings.harvesterhci.io/replica:"1" ` 注释。
- apiVersion: monitoring.coreos.com/v1
  kind: Prometheus
  metadata:
    annotations:
      meta.helm.sh/release-name: rancher-monitoring
      meta.helm.sh/release-namespace: cattle-monitoring-system
      storage-network.settings.harvesterhci.io/replica: "1"
    creationTimestamp: "2025-05-20T06:40:25Z"
Harvester pod 日志('harvester-system/harvester' 部署)表明尝试更改 storage-network 设置的操作被阻止。
...
2025-05-20T08:13:49.842448311Z time="2025-05-20T08:13:49Z" level=info msg="storage network change: {\"vlan\":955,\"clusterNetwork\":\"k8s-storage\",\"range\":\"198.18.2.0/24\"}"
2025-05-20T08:13:49.842476305Z time="2025-05-20T08:13:49Z" level=info msg="rancher monitoring not found. skip"
2025-05-20T08:13:49.842479072Z time="2025-05-20T08:13:49Z" level=info msg="current Grafana replicas: 0"
2025-05-20T08:13:49.842480501Z time="2025-05-20T08:13:49Z" level=info msg="VM import controller no found. skip"
2025-05-20T08:13:49.851381877Z time="2025-05-20T08:13:49Z" level=error msg="error syncing 'storage-network': handler harvester-storage-network-controller: Waiting for all volumes detached: pvc-6f66d234-f9c2-453e-8c17-383d9b489956,pvc-07c626f5-5135-4783-952d-cc20b1607cb5,pvc-1cfd6efe-c928-42e5-a834-8c27ed0e4897,pvc-5ce98d0a-5da1-4f30-af14-a8de29233380,pvc-1c9b7c9a-4943-4462-9082-217f9988cfc5,pvc-e9d92bfd-63c7-4ae3-ba00-1ce209f12caa,pvc-205ba31d-35fb-44f6-a3c4-c53001ec0dd6,pvc-6b5a7d11-7578-4397-9e13-ab475fe91463,pvc-669c69dd-93ad-4304-a340-484f7108362b,pvc-7668c486-b688-4524-b359-0cf9ec21cbc0,pvc-7d294996-821f-4434-ae4f-55a6de67f28c,pvc-216333c6-73f9-4e68-ac8b-53ab95a1f138,pvc-f72ca889-70c9-4dd9-bcec-a17ab65a1df4,pvc-01895fab-12f8-452a-9161-7d3c01e22726,pvc-330caa2d-5fdc-42f2-8c53-c5f80044760f,pvc-9506b7d0-c2d5-41f2-a08b-d7bc22dddb88,pvc-3e2b46d4-c471-44a9-9765-64babdb6ceed,pvc-25fe3372-1802-46d5-abf1-039099c567e2,pvc-b16fb262-cb38-4438-b074-84c7ad080a15,pvc-757c0f22-4ed6-4669-844d-cd7a87ceb26e,pvc-e0d99d8f-581f-4be6-baa3-d345308c9330,pvc-f5e1e19d-3dfb-4be1-9354-c092d7f03009,pvc-383ec26a-51f6-4f9d-8d8a-179651846d92,pvc-0d8f5737-c6e4-4f55-8d19-cf7a785552fc,pvc-5091892e-faf2-47b1-b987-bbde1ab2c13a,pvc-6f0c97ae-dfda-4799-bf26-e85feace5414,pvc-b0f717af-8a79-4c4e-b82e-90dedeae7697,pvc-ffe982d5-5ff1-40aa-a0db-cc10360d2d89,pvc-370757e2-4bce-41e7-b6f7-95aa8a5e8cf1,pvc-5a77d3e3-d555-476c-840f-7b9dadeb7478,pvc-43987c88-99b1-4889-9a47-5261717fe265,pvc-9f675704-9c52-46c2-96bf-2ff83d805383,pvc-d0b4e1d0-9bcd-4a8a-b52c-e1d8062a8099,pvc-a29be31f-531f-409a-bf5a-d267a54e2edb, requeuing"
...
根本原因
当您更改 storage-network 设置时,SUSE Virtualization 控制器会等待附加卷被分离后再应用更改。此外,控制器会自动终止与 Prometheus、Alertmanager 和 Grafana 相关的 pod,因为这些 pod 使用卷来存储数据。
此过程通常需要短时间完成,但在以下情况发生时可能会中断:
-
附加卷阻止 Harvester 控制器应用对设置的更改。
-
用户或`monitoring-operator`尝试启用`rancher-monitoring`附加产品。
-
Harvester控制器终止这些pod。
解决方法
-
禁用`rancher-monitoring`附加产品。
-
检查storage-network设置是否已启用或禁用。
-
检查Harvester pod日志中的错误指示。如果卷仍然附加,请停止相关的虚拟机,直到在`storage network change`消息后不再出现错误。
-
启用`rancher-monitoring`附加产品。
SUSE Virtualization UI在升级后停止报告虚拟机指标。
问题描述
在升级后,SUSE Virtualization UI停止报告虚拟机指标,而集群指标仍然可用。禁用并重新启用`rancher-monitoring`附加产品并不能解决该问题。
prometheus-kubevirt-rules ServiceMonitor对象在`cattle-monitoring-system`命名空间中缺失。您无法手动添加此对象,因为KubeVirt操作员会自动删除它。
$ kubectl get servicemonitor -A
NAMESPACE                  NAME                                 AGE
...
cattle-monitoring-system   prometheus-kubevirt-rules            24s  // is missing
...
根本原因
当KubeVirt新安装或升级时,它会生成一个新的ConfigMap对象以存储配置。如果在此过程中`rancher-monitoring-operator` ServiceAccount对象缺失/未同步自`cattle-monitoring-system`命名空间,则KubeVirt操作员内会发生竞争条件。因此,ServiceMonitor配置可能会被排除在生成的ConfigMap对象之外。
在升级过程中,KubeVirt可能会错误地确定监控状态。一旦生成ConfigMap对象,KubeVirt不会进行协调或重新生成,直到下次升级,除非执行手动触发。
解决方法
解决方法是确保`rancher-monitoring-operator` ServiceAccount对象存在,删除孤立的ConfigMap对象,并重启KubeVirt操作员。
-
检索ConfigMap对象的列表。
$ kubectl get configmap -n harvester-system  -l kubevirt.io/install-strategy
NAME                              DATA   AGE
kubevirt-install-strategy-zq86d   1      10m
该列表包括最新版本的 ConfigMap 以及任何存活的遗留对象。
-
检查最新的 ConfigMap 对象是否包含 ServiceMonitor 配置。
$ kubectl get configmap -n harvester-system kubevirt-install-strategy-zq86d -ojsonpath="{.data.manifests}" | base64 -d | gunzip | grep ServiceMoni -i当输出为空时,问题存在于您的环境中。
-
验证
monitorAccount和monitorNamespace字段是否存在。$ kubectl get kubevirt kubevirt -n harvester-system -oyaml | grep monitoring monitorAccount: rancher-monitoring-operator monitorNamespace: cattle-monitoring-system -
验证 ServiceAccount 对象是否存在。
该对象在安装过程中创建,必须保留。
$ kubectl get serviceaccount -n cattle-monitoring-system rancher-monitoring-operator Error from server (NotFound): serviceaccounts "rancher-monitoring-operator" not found -
如果 ServiceAccount 对象不存在,请手动创建它。否则,跳到下一步。
$ cat > rmo.yaml << 'EOF' apiVersion: v1 kind: ServiceAccount metadata: annotations: meta.helm.sh/release-name: rancher-monitoring meta.helm.sh/release-namespace: cattle-monitoring-system labels: app: rancher-monitoring-operator app.kubernetes.io/component: prometheus-operator app.kubernetes.io/instance: rancher-monitoring app.kubernetes.io/managed-by: Helm app.kubernetes.io/name: rancher-monitoring-prometheus-operator heritage: Helm release: rancher-monitoring name: rancher-monitoring-operator namespace: cattle-monitoring-system EOF $ kubectl create -f rmo.yaml $ kubectl get serviceaccount -n cattle-monitoring-system rancher-monitoring-operator NAME SECRETS AGE rancher-monitoring-operator 0 35s -
删除所有 ConfigMap 对象 (
kubevirt-install-strategy-*)。 -
发布
virt-operator部署。Kubevirt 重新创建 ConfigMap。
$ kubectl rollout restart deployment -n harvester-system virt-operator
deployment.apps/virt-operator restarted

$ kubectl get pods -n harvester-system
NAME                                                              READY   STATUS      RESTARTS   AGE
...
kubevirt-c2053a4889fe65e8d368b5c232901c84fda8debe-jobgddh65r7ws   0/1     Completed   0          6s  // the pod exists for a short time
...
virt-operator-796bf5fd9b-h56z9                                    1/1     Running     0          33s

$ kubectl get servicemonitor -A
NAMESPACE                  NAME                                 AGE
cattle-monitoring-system   prometheus-kubevirt-rules            24s  // newly created
...