Kubernetes上でのOpenTelemetryオペレーター入門
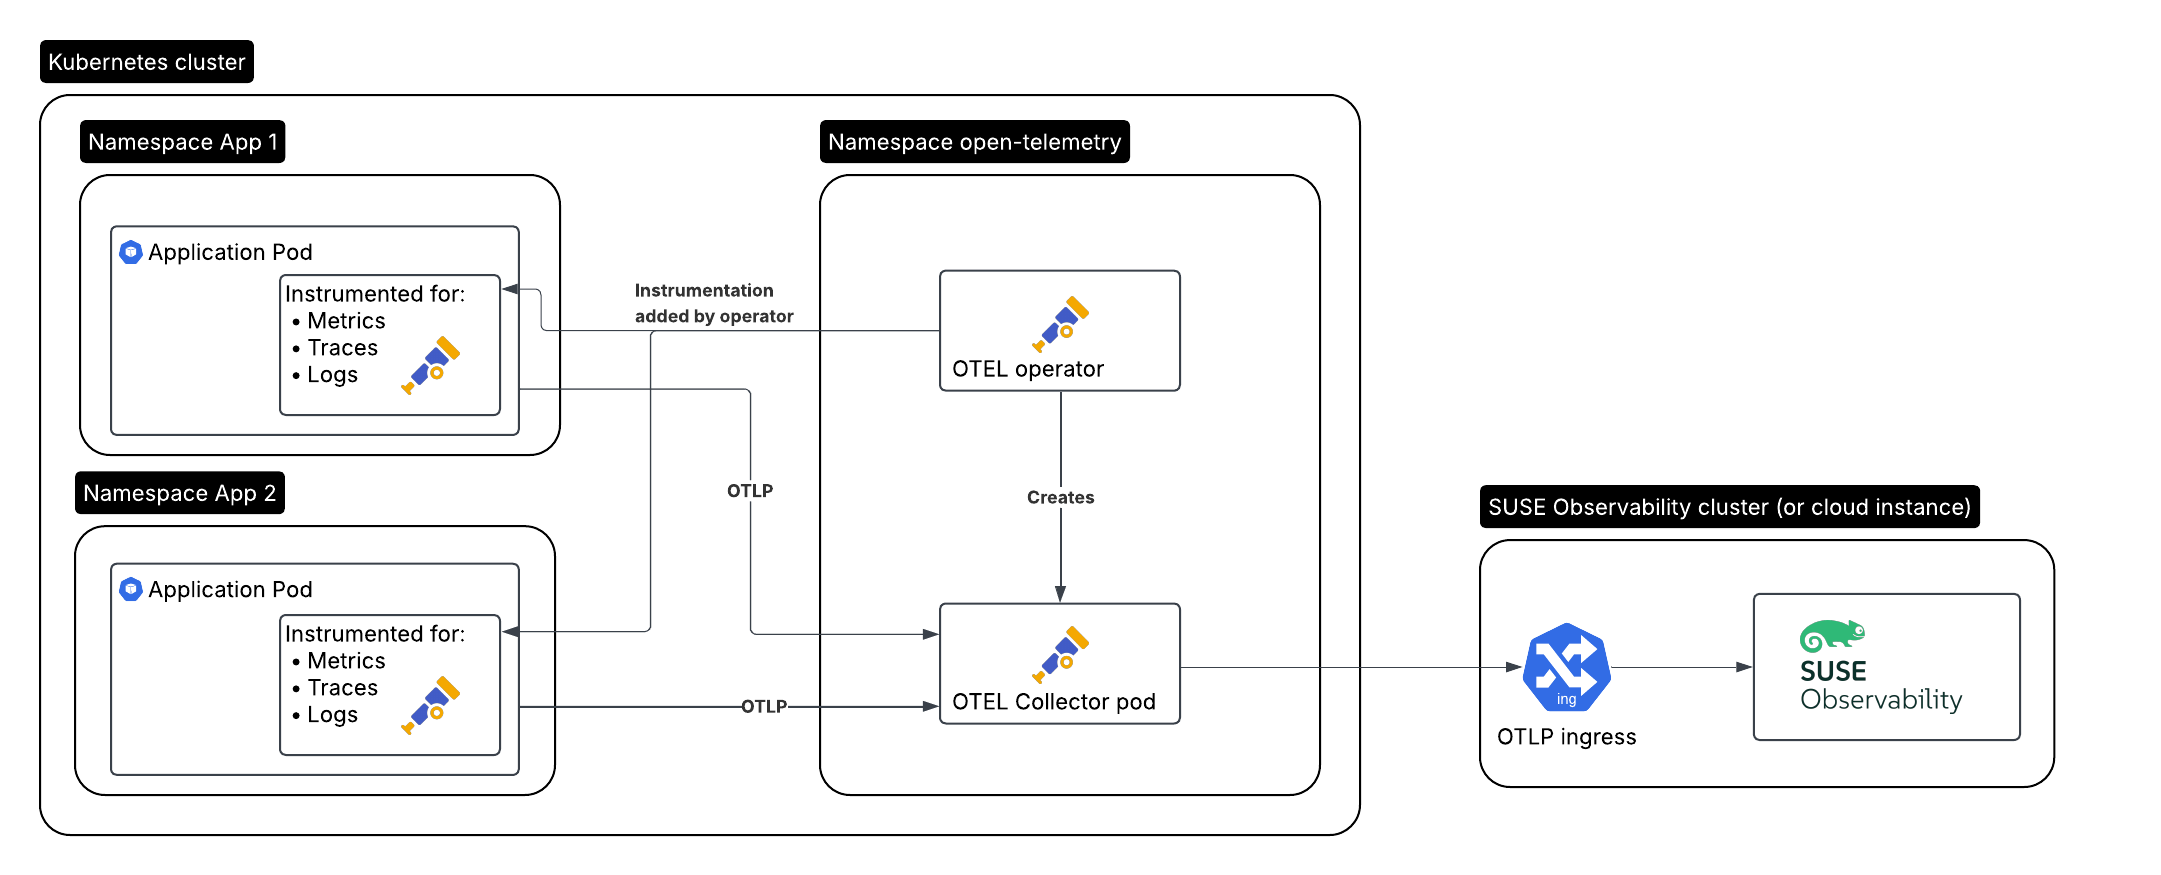
これから作成する、監視が必要なアプリケーションのセットアップはこちらです。
-
クラスターAで実行されている監視対象のアプリケーション/ワークロード、オペレーターによって自動計測される
-
クラスターAのOpenTelemetryオペレーター
-
オペレーターによって作成されたコレクター
-
クラスターBで実行されているSUSE Observability、またはSUSE Cloud Observability
オペレーターをインストールします
OpenTelemetryオペレーターは、通常のKubernetesセットアップに対していくつかの追加機能を提供します:
-
アプリケーションやDockerイメージを全く変更することなく、サポートされている言語(Java、.NET、Python、Golang、Node.js)のアプリケーションポッドを自動計測できます
-
Prometheusオペレーターの代わりに導入でき、サービスおよびポッドモニターに基づいてPrometheusエクスポータエンドポイントのスクレイピングを開始します
サービストークンを作成します。
サービストークンを作成するには、2つの方法があります:
-
SUSE Observability UI - 画面の左上をクリックしてメインメニューを開き、
StackPacks> `Open Telemetry`に移動します。 まだ行っていない場合は、`INSTALL`ボタンをクリックします。 `CREATE NEW SERVICE TOKEN`ボタンをクリックして、その値をクリップボードにコピーします。 -
SUSE Observability CLI - サービストークンの管理を参照してください。
サービストークンの値は、以下の指示で`<SERVICE_TOKEN>`と記載されている場所で使用する必要があります。
サービストークンのためのネームスペースとシークレットを作成します。
`open-telemetry`ネームスペースにインストールし、サービストークンを使用します:
kubectl create namespace open-telemetry
kubectl create secret generic open-telemetry-collector \
    --namespace open-telemetry \
    --from-literal=API_KEY='<SERVICE_TOKEN>'
オペレーターの設定とインストール
オペレーターはHelmチャートでインストールされるため、まずチャートリポジトリを設定します。
helm repo add open-telemetry https://open-telemetry.github.io/opentelemetry-helm-chartsオペレーターを設定するための`otel-operator.yaml`ファイルを作成しましょう:
# Add image pull secret for private registries
imagePullSecrets: []
manager:
  image:
    # Uses chart.appVersion for the tag
    repository: ghcr.io/open-telemetry/opentelemetry-operator/opentelemetry-operator
  collectorImage:
    # find the latest collector releases at https://github.com/open-telemetry/opentelemetry-collector-releases/releases
    repository: otel/opentelemetry-collector-k8s
    tag: 0.123.0
  targetAllocatorImage:
    repository: ""
    tag: ""
  # Only needed when overriding the image repository, make sure to always specify both the image and tag:
  autoInstrumentationImage:
    java:
      repository: ""
      tag: ""
    nodejs:
      repository: ""
      tag: ""
    python:
      repository: ""
      tag: ""
    dotnet:
      repository: ""
      tag: ""
    # The Go instrumentation support in the operator is disabled by default.
    # To enable it, use the operator.autoinstrumentation.go feature gate.
    go:
      repository: ""
      tag: ""

admissionWebhooks:
  # A production setup should use certManager to generate the certificate, without certmanager the certificate will be generated during the Helm install
  certManager:
    enabled: false
  # The operator has validation and mutation hooks that need a certificate, with this we generate that automatically
  autoGenerateCert:
    enabled: true
設定ファイルを使用してコレクターをインストールします。
helm upgrade --install opentelemetry-operator open-telemetry/opentelemetry-operator \
  --namespace open-telemetry \
  --values otel-operator.yaml
これはオペレーターのみをインストールします。コレクターのインストールを続け、自動計測を有効にします。
OpenTelemetryコレクター
オペレーターは、Kubernetesカスタムリソースの種類`OpenTelemetryCollector`を介して1つ以上のコレクターデプロイメントを管理します。Kubernetesの始め方ガイドで使用されているのと同じ設定を使用して1つを作成します。
これは、ガイドの前の方で作成されたシークレットを使用します。<otlp-suse-observability-endpoint:port>`をあなたのOTLPエンドポイントに置き換え(エンドポイントについてはOTLP APIを参照)、<your-cluster-name>`の代わりにKubernetesクラスターの名前を挿入してください:
apiVersion: opentelemetry.io/v1beta1
kind: OpenTelemetryCollector
metadata:
  name: otel-collector
spec:
  mode: deployment
  envFrom:
  - secretRef:
      name: open-telemetry-collector
  # optional service-account for pulling the collector image from a private registries
  # serviceAccount: otel-collector
  config:
    receivers:
      otlp:
        protocols:
          grpc:
            endpoint: 0.0.0.0:4317
          http:
            endpoint: 0.0.0.0:4318
      # Scrape the collectors own metrics
      prometheus:
        config:
          scrape_configs:
          - job_name: opentelemetry-collector
            scrape_interval: 30s
            static_configs:
            - targets:
              - ${env:MY_POD_IP}:8888
    extensions:
      health_check:
        endpoint: ${env:MY_POD_IP}:13133
      # Use the API key from the env for authentication
      bearertokenauth:
        scheme: SUSEObservability
        token: "${env:API_KEY}"
    exporters:
      debug: {}
      nop: {}
      otlp/suse-observability:
        auth:
          authenticator: bearertokenauth
        # Put in your own otlp endpoint, for example otlp-suse-observability.my.company.com:443
        endpoint: <otlp-suse-observability-endpoint:port>
        compression: snappy
    processors:
      memory_limiter:
        check_interval: 5s
        limit_percentage: 80
        spike_limit_percentage: 25
      batch: {}
      resource:
        attributes:
        - key: k8s.cluster.name
          action: upsert
          # Insert your own cluster name
          value: <your-cluster-name>
        - key: service.instance.id
          from_attribute: k8s.pod.uid
          action: insert
          # Use the k8s namespace also as the open telemetry namespace
        - key: service.namespace
          from_attribute: k8s.namespace.name
          action: insert
    connectors:
      # Generate metrics for spans
      spanmetrics:
        metrics_expiration: 5m
        namespace: otel_span
    service:
      extensions: [ health_check,  bearertokenauth ]
      pipelines:
        traces:
          receivers: [otlp]
          processors: [memory_limiter, resource, batch]
          exporters: [debug, spanmetrics, otlp/suse-observability]
        metrics:
          receivers: [otlp, spanmetrics, prometheus]
          processors: [memory_limiter, resource, batch]
          exporters: [debug, otlp/suse-observability]
        logs:
          receivers: [otlp]
          processors: []
          exporters: [nop]
      telemetry:
        metrics:
address: ${env:MY_POD_IP}:8888|
もしKubernetesスタックパックと一緒にSUSE Observabilityエージェントを使用する場合、*SUSE Observabilityエージェントをインストールする際に使用したのと同じクラスター名を使用してください*異なるクラスター名を使用すると、Kubernetes コンポーネントのトレースの視点が空になり、SUSE Observability とあなたのユーザーにとって情報を相関させることが非常に難しくなります。 |
この collector.yaml を `open-telemetry`ネームスペースに適用してコレクターをデプロイします。
kubectl apply --namespace open-telemetry -f collector.yaml自動計測
自動計測を設定する
異なる言語の自動計測を設定する方法をオペレーターに指示するために、Instrumentation 型の別のカスタムリソースを使用する必要があります。これは、計測されたアプリケーションのテレメトリエンドポイントとして、ちょうどデプロイされたコレクターを設定するために主に使用されます。
これは、1 か所で定義され、クラスター内のすべてのポッドで使用されることができますが、各ネームスペースに異なる Instrumentation を持つことも可能です。ここでは前者を行います。異なるネームスペースや異なる名前の otel コレクターを使用した場合、このファイルのエンドポイントをそれに応じて更新する必要があることに注意してください。
instrumentation.yaml を作成します。
apiVersion: opentelemetry.io/v1alpha1
kind: Instrumentation
metadata:
  name: otel-instrumentation
spec:
  exporter:
    # default endpoint for the instrumentation
    endpoint: http://otel-collector-collector.open-telemetry.svc.cluster.local:4317
  propagators:
    - tracecontext
    - baggage
  defaults:
    # To use the standard app.kubernetes.io/ labels for the service name, version and namespace:
    useLabelsForResourceAttributes: true
  python:
    env:
      # Python autoinstrumentation uses http/proto by default, so data must be sent to 4318 instead of 4317.
      - name: OTEL_EXPORTER_OTLP_ENDPOINT
        value: http://otel-collector-collector.open-telemetry.svc.cluster.local:4318
  dotnet:
    env:
      # Dotnet autoinstrumentation uses http/proto by default, so data must be sent to 4318 instead of 4317.
      - name: OTEL_EXPORTER_OTLP_ENDPOINT
        value: http://otel-collector-collector.open-telemetry.svc.cluster.local:4318
  go:
    env:
      # Go autoinstrumentation uses http/proto by default, so data must be sent to 4318 instead of 4317.
      - name: OTEL_EXPORTER_OTLP_ENDPOINT
        value: http://otel-collector-collector.open-telemetry.svc.cluster.local:4318
instrumentation.yaml を `open-telemetry`ネームスペースにも適用します。
kubectl apply --namespace open-telemetry -f instrumentation.yamlポッドの自動計測を有効にする
アプリケーションポッドを自動計測するようオペレーターに指示するために、ポッドにアノテーションを追加する必要があります。
-
Java:
instrumentation.opentelemetry.io/inject-java: open-telemetry/otel-instrumentation -
NodeJS:
instrumentation.opentelemetry.io/inject-nodejs: open-telemetry/otel-instrumentation -
Python:
instrumentation.opentelemetry.io/inject-python: open-telemetry/otel-instrumentation -
Go:
instrumentation.opentelemetry.io/inject-go: open-telemetry/otel-instrumentation
注釈の値は、私たちが作成した`Instrumentation`リソースのネームスペースと名前を指します。その他のオプションは次のとおりです:
-
"true" - ネームスペースから`Instrumentation`カスタムリソースを注入します。
-
"my-instrumentation" - 現在のネームスペースにおける`Instrumentation`カスタムリソースの名前です。
-
"my-other-namespace/my-instrumentation" - 別のネームスペースにおける`Instrumentation`カスタムリソースのネームスペースと名前です。
-
"false" - 注入しません
注釈のいずれかを持つポッドが作成されると、オペレーターはミューテーションフックを介してポッドを修正します:
-
自動計測ライブラリを提供するinitコンテナを追加します。
-
ポッドの最初のコンテナを修正して起動時に計測を読み込み、計測を構成するための環境変数を追加します。
どのコンテナを計測するかをカスタマイズする必要がある場合は、https://github.com/open-telemetry/opentelemetry-operator?tab=readme-ov-file#_multi_container_pods_with_multiple_instrumentations[オペレーターのドキュメント]を使用してください。
|
Go自動計測には、昇格された権限が必要です。これらの権限はオペレーターによって自動的に設定されます: |
結果を表示します。
SUSE Observabilityに移動し、Open Telemetry Stackpackがインストールされていることを確認してください(メインメニュー -> Stackpacks)。
しばらくしてポッドにトラフィックがある場合は、OpenTelemetryのサービスおよびサービスインスタンスの概要でサービス名の下にそれらを見つけることができるはずです。トレースは、トレースエクスプローラーおよびトレースの視点にサービスおよびサービスインスタンスのコンポーネントとして表示されます。スパンメトリクスおよび言語特有のメトリクス(利用可能な場合)は、コンポーネントのメトリクスの視点で利用可能になります。
Kubernetes スタックパックがインストールされている場合、計測されたポッドも トレースの視点 でトレースを利用できるようになります。
Rancher RBAC
Rancher RBACが機能するためには、テレメトリデータに以下のリソース属性が含まれている必要があります:
-
k8s.cluster.name- Kubernetesスタックパックで使用される*クラスター名* -
k8s.namespace.name- Rancher の プロジェクト によって管理される ネームスペース
Kubernetesオペレーターは、送信されるすべてのテレメトリーデータにこれらの属性をデフォルトで注入します。
次のステップ
アプリケーションのコンポーネント、例えばサービスやサービスインスタンスに新しいチャートを追加するには、ガイドに従ってください。メトリクスを使用して新しいモニターを作成し、アプリケーションが利用できない場合やパフォーマンスの問題が発生した場合に通知を受け取るために通知を設定することも可能です。
オペレーター、OpenTelemetryCollector、および`Instrumentation`カスタムリソースには、https://github.com/open-telemetry/opentelemetry-operator[オペレーターリポジトリのREADME]に文書化されたより多くのオプションがあります。例えば、https://github.com/open-telemetry/opentelemetry-operator?tab=readme-ov-file#_target_allocator[ターゲットアロケーター]を`OpenTelemetryCollector`リソースを介してオプションとしてインストールすることが可能で、コレクターのPrometheusレシーバーを構成するために使用できます。これは、Prometheusオペレーターを置き換えたい場合や、その`ServiceMonitor`および`PodMonitor`カスタムリソースを使用している場合に特に便利です。