开始使用 Open Telemetry
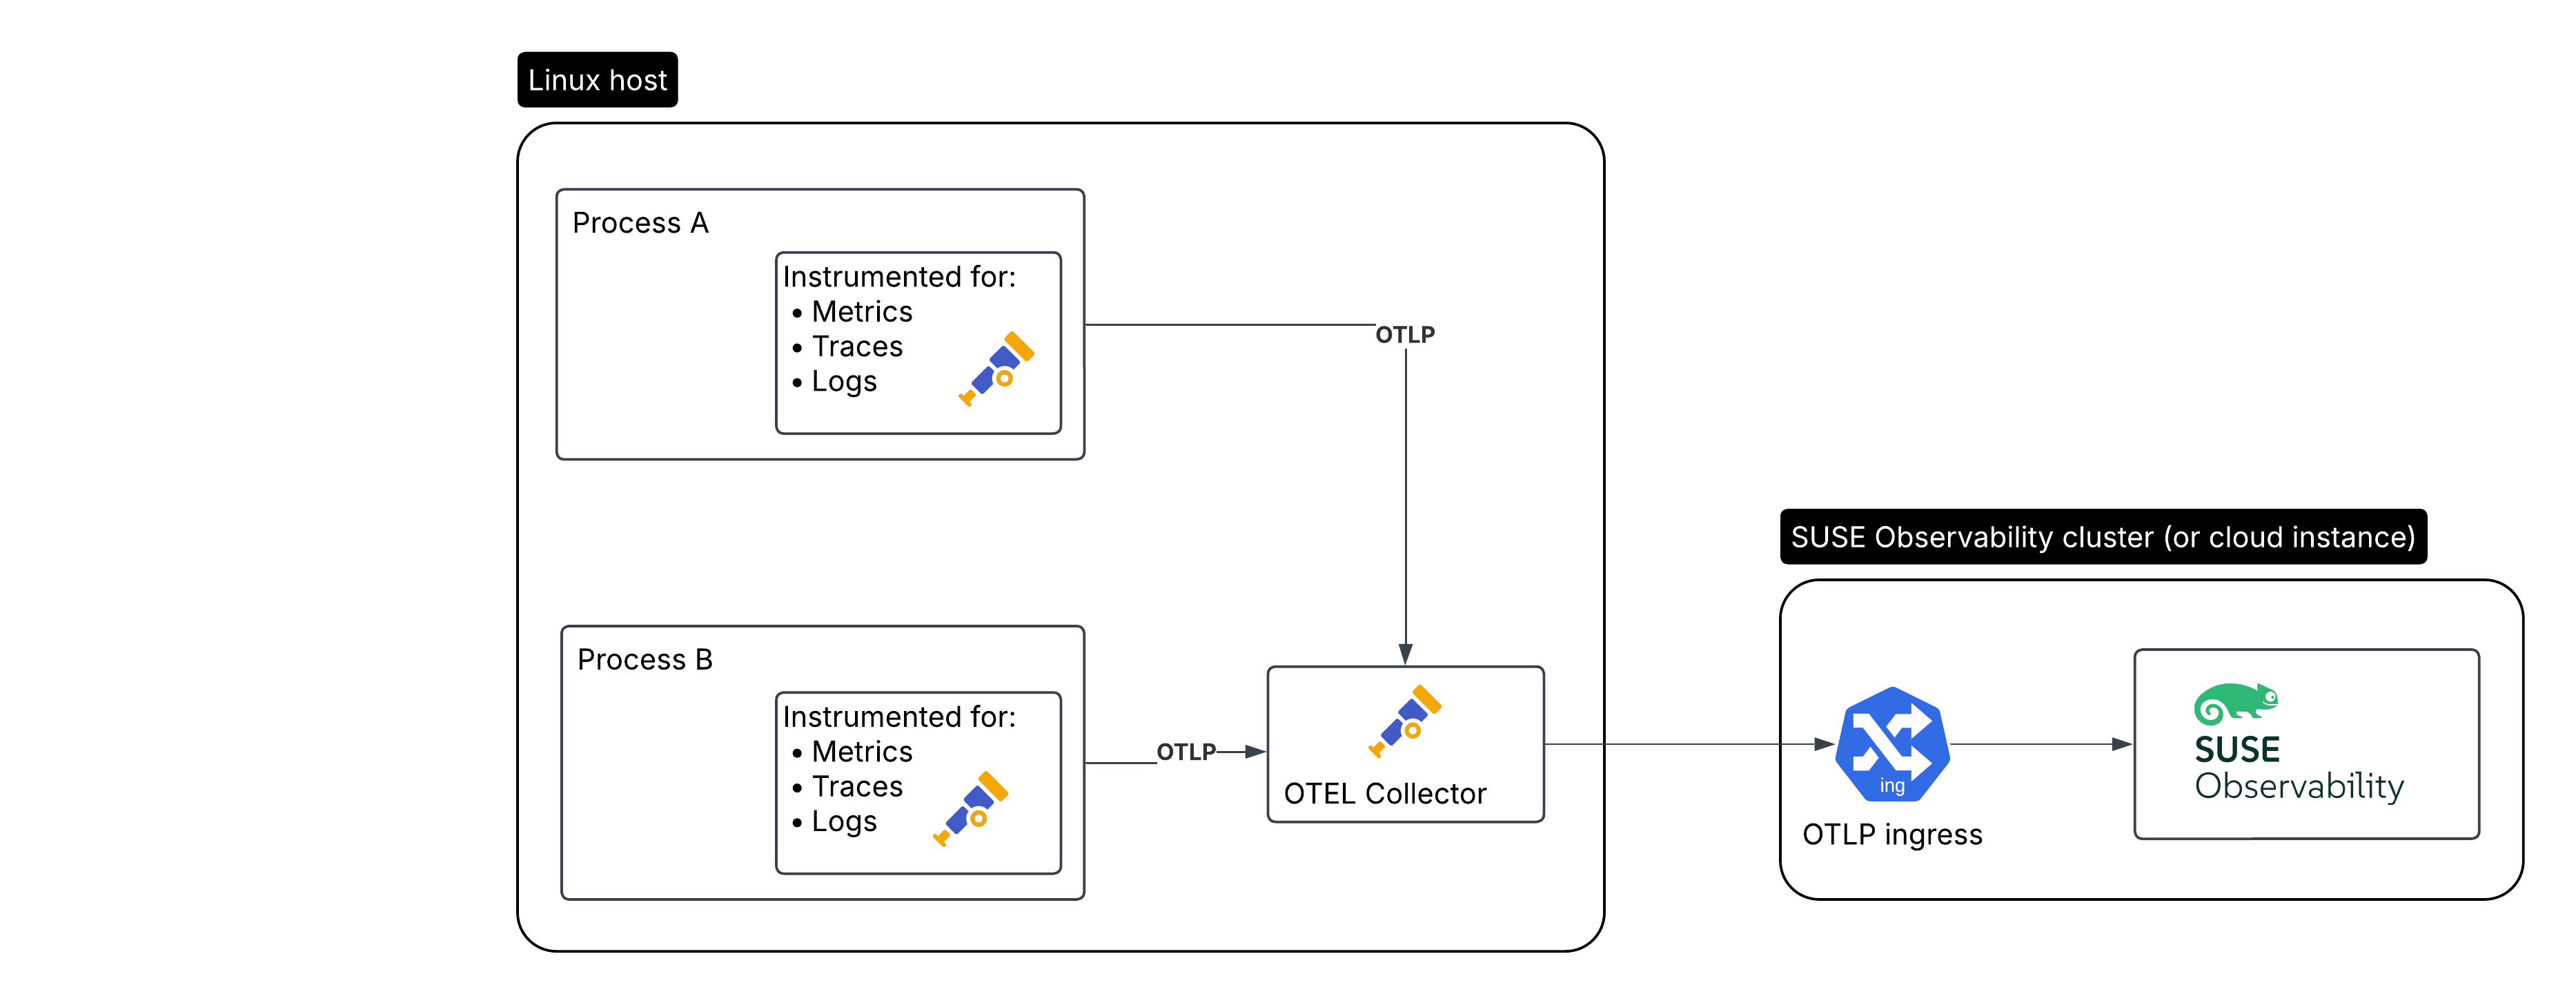
这是我们将要创建的设置,用于需要监控的应用程序:
-
在 Linux 主机上运行的被监控应用程序/工作负载
-
在同一 Linux 主机上运行的 Open Telemetry 收集器
-
SUSE Observability 或 SUSE Cloud Observability
安装 Open Telemetry 收集器
|
对于生产环境,强烈建议安装收集器,因为它可以快速卸载数据,并且收集器可以处理额外的操作,如重试、批处理、加密或甚至敏感数据过滤。 |
首先我们将安装收集器。我们将其配置为:
-
接收来自多个经过插桩的应用程序的数据
-
用主机属性丰富收集的数据
-
为跟踪生成指标
-
将数据转发到 SUSE Observability,包括使用 API 密钥进行身份验证
此外,当出现连接问题时,它还会重试发送数据。
创建服务令牌
有两种方法可以创建服务令牌:
-
SUSE Observability UI - 点击屏幕左上角打开主菜单,然后转到
StackPacks>Open Telemetry。 如果您之前没有这样做,请点击INSTALL按钮。 点击CREATE NEW SERVICE TOKEN按钮并将值复制到剪贴板。 -
SUSE Observability CLI - 请参见 管理服务令牌
服务令牌值必须在下面的说明中提到 <SERVICE_TOKEN> 的地方使用。
安装并配置收集器
收集器为大多数 Linux 版本和架构提供软件包(apk、deb 和 rpm),并使用 systemd 进行自动服务配置。要安装它,请找到 Github 上的最新版本 并更新示例中的 URL 以使用最新版本:
-
DEB AMD64
-
DEB ARM64
-
RPM AMD64
-
RPM ARM64
wget https://github.com/open-telemetry/opentelemetry-collector-releases/releases/download/v0.123.1/otelcol-contrib_0.123.1_linux_amd64.deb
sudo dpkg -i otelcol-contrib_0.123.1_linux_amd64.deb
wget https://github.com/open-telemetry/opentelemetry-collector-releases/releases/download/v0.123.1/otelcol-contrib_0.123.1_linux_arm64.deb
sudo dpkg -i otelcol-contrib_0.123.1_linux_arm64.debwget https://github.com/open-telemetry/opentelemetry-collector-releases/releases/download/v0.123.1/otelcol-contrib_0.123.1_linux_amd64.rpm
sudo rpm -iv1 otelcol-contrib_0.123.1_linux_amd64.rpmwget https://github.com/open-telemetry/opentelemetry-collector-releases/releases/download/v0.123.1/otelcol-contrib_0.123.1_linux_arm64.rpm
sudo rpm -iv1 otelcol-contrib_0.123.1_linux_arm64.rpm有关其他安装选项,请使用 Open Telemetry 指南。
安装后,通过编辑 /etc/otelcol-contrib/config.yaml 修改收集器配置。更改文件,使其看起来像这里的 config.yaml 示例,将 <otlp-suse-observability-endpoint:port> 替换为您的 OTLP 端点(请参阅 OTLP API 以获取您的端点),并为 <SERVICE_TOKEN> 插入您的服务词元:
receivers:
  otlp:
    protocols:
      # Only bind to localhost to keep the collector secure, see https://github.com/open-telemetry/opentelemetry-collector/blob/main/docs/security-best-practices.md#safeguards-against-denial-of-service-attacks
      grpc:
        endpoint: 127.0.0.1:4317
      http:
        endpoint: 127.0.0.1:4318
  # Collect own metrics
  prometheus:
    config:
      scrape_configs:
      - job_name: 'otel-collector'
        scrape_interval: 30s
        static_configs:
        - targets: ['0.0.0.0:8888']
extensions:
  health_check: {}
  pprof:
    endpoint: 0.0.0.0:1777
  zpages:
    endpoint: 0.0.0.0:55679
  # Use the API key from the env for authentication
  bearertokenauth:
    scheme: SUSEObservability
    token: "<SERVICE_TOKEN>"
exporters:
  nop: {}
  debug: {}
  otlp/suse-observability:
    compression: snappy
    auth:
      authenticator: bearertokenauth
    # Put in your own otlp endpoint, for example otlp-suse-observability.my.company.com:443
    endpoint: <otlp-suse-observability-endpoint:port>
processors:
  memory_limiter:
    check_interval: 5s
    limit_percentage: 80
    spike_limit_percentage: 25
  batch: {}
  # Optionally include resource information from the system running the collector
  resourcedetection/system:
    detectors: [env, system] # Replace system with gcp, ec2, azure when running in cloud environments
    system:
      hostname_sources: ["os"]
connectors:
  # Generate metrics for spans
  spanmetrics:
    metrics_expiration: 5m
    namespace: otel_span
service:
  extensions: [ bearertokenauth, health_check, pprof, zpages ]
  pipelines:
    traces:
      receivers: [otlp]
      processors: [memory_limiter, resourcedetection/system, batch]
      exporters: [debug, spanmetrics, otlp/suse-observability]
    metrics:
      receivers: [otlp, spanmetrics, prometheus]
      processors: [memory_limiter, batch, resourcedetection/system]
      exporters: [debug, otlp/suse-observability]
    logs:
      receivers: [otlp]
      processors: []
      exporters: [nop]
最后重启收集器:
sudo systemctl restart otelcol-contrib要查看收集器的日志,请使用:
sudo journalctl -u otelcol-contrib从您的应用程序收集遥测数据
收集遥测数据的常见方法是使用 Open Telemetry SDK 对您的应用程序进行插桩。我们为几种语言编写了一些快速入门指南,但还有更多:
SDK 不需要额外配置,它们默认通过 OTLP 或 OTLP over HTTP(取决于支持的协议)导出到 localhost。
对于其他语言,请遵循 opentelemetry.io 上的文档。