在 Kubernetes 上开始使用 OpenTelemetry Operator
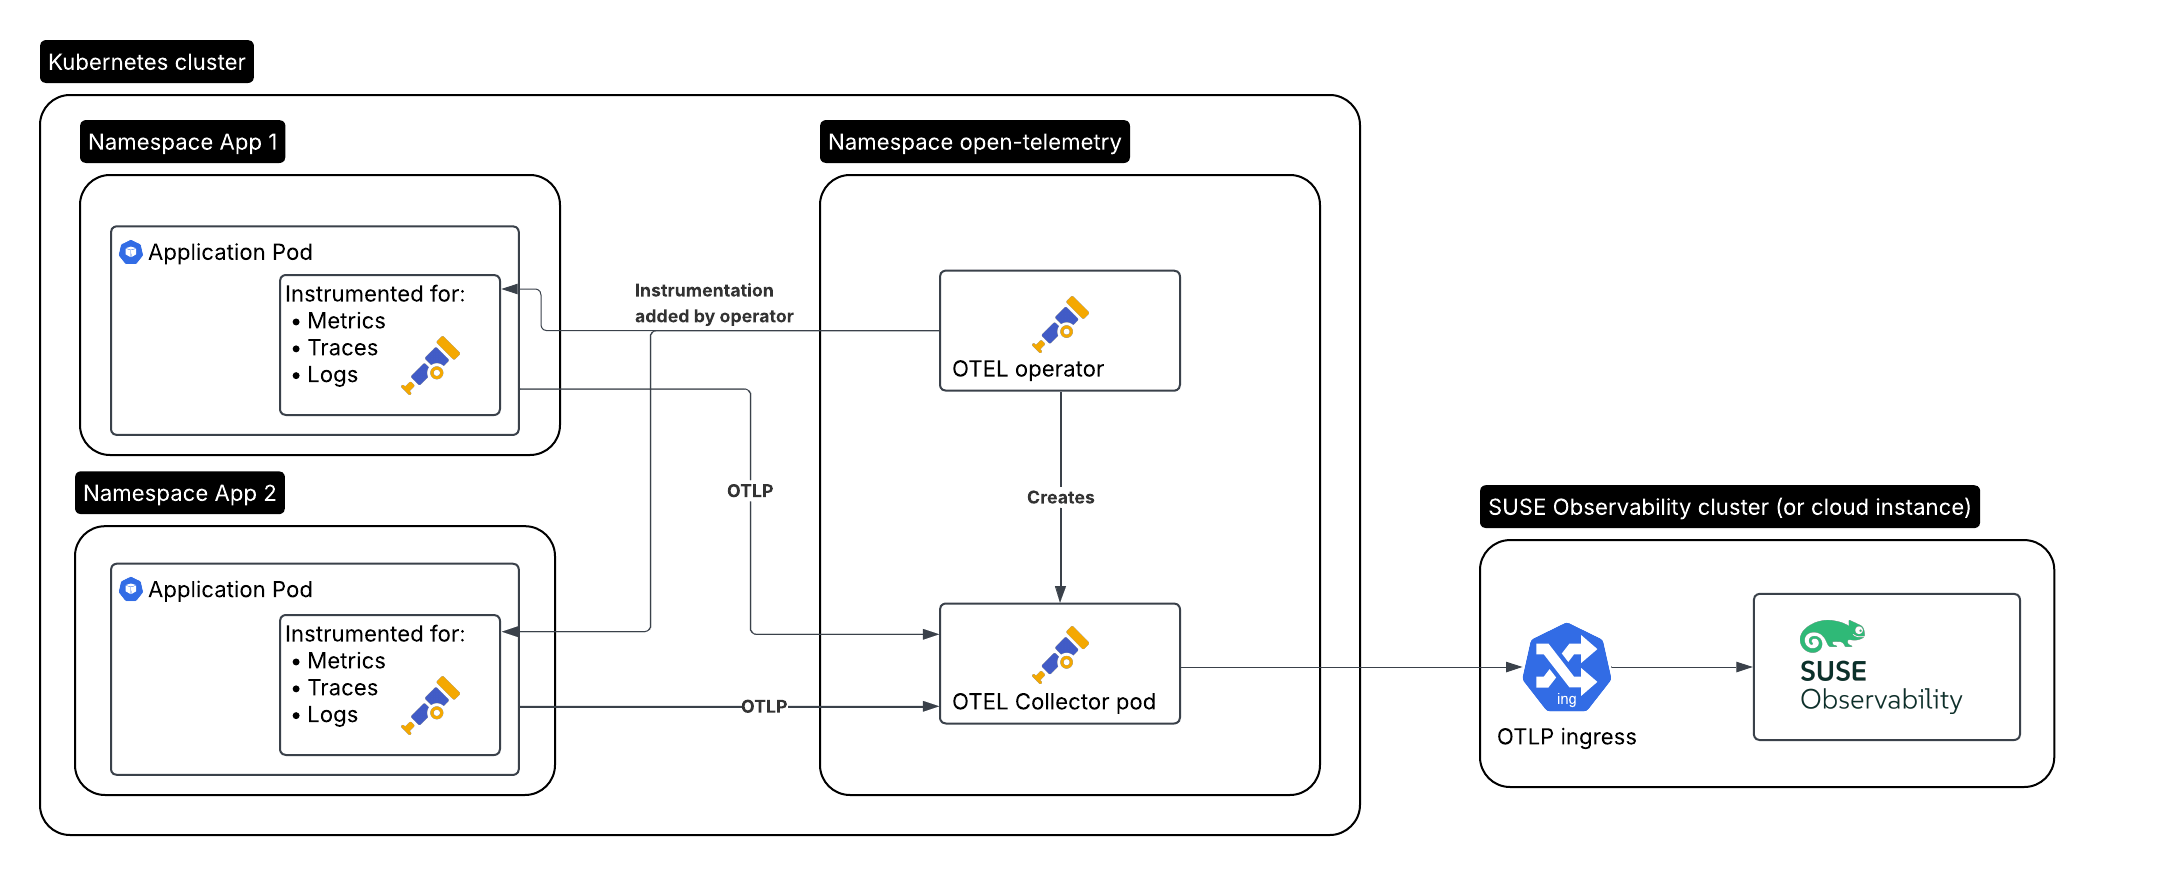
这是我们将要创建的设置,用于需要监控的应用程序:
-
在集群 A 中运行的被监控应用程序/工作负载,由 Operator 自动仪表化
-
集群 A 中的 OpenTelemetry Operator
-
由 Operator 创建的收集器
-
在集群 B 中运行的 SUSE Observability,或 SUSE Cloud Observability
安装 Operator
OpenTelemetry Operator 提供了一些比普通 Kubernetes 设置更多的额外功能:
-
它可以为支持的语言(Java、.NET、Python、Golang、Node.js)自动为您的应用程序 Pod 进行仪表化,无需修改应用程序或 Docker 镜像
-
它可以作为 Prometheus Operator 的替代品被引入,并开始根据服务和 Pod 监控抓取 Prometheus 导出器端点
创建服务令牌
有两种方法可以创建服务令牌:
-
SUSE Observability UI - 点击屏幕左上角打开主菜单,然后转到
StackPacks>Open Telemetry。 如果您之前没有这样做,请点击INSTALL按钮。 点击CREATE NEW SERVICE TOKEN按钮并将值复制到剪贴板。 -
SUSE Observability CLI - 请参见 管理服务令牌
服务令牌值必须在下面的说明中提到 <SERVICE_TOKEN> 的地方使用。
创建名称空间和服务令牌的密钥
我们将在 open-telemetry 名称空间中安装并使用服务词元:
kubectl create namespace open-telemetry
kubectl create secret generic open-telemetry-collector \
    --namespace open-telemetry \
    --from-literal=API_KEY='<SERVICE_TOKEN>'
配置并安装 Operator
Operator 通过 Helm 图表安装,因此首先配置图表储存库。
helm repo add open-telemetry https://open-telemetry.github.io/opentelemetry-helm-charts让我们创建一个 otel-operator.yaml 文件来配置 Operator:
# Add image pull secret for private registries
imagePullSecrets: []
manager:
  image:
    # Uses chart.appVersion for the tag
    repository: ghcr.io/open-telemetry/opentelemetry-operator/opentelemetry-operator
  collectorImage:
    # find the latest collector releases at https://github.com/open-telemetry/opentelemetry-collector-releases/releases
    repository: otel/opentelemetry-collector-k8s
    tag: 0.123.0
  targetAllocatorImage:
    repository: ""
    tag: ""
  # Only needed when overriding the image repository, make sure to always specify both the image and tag:
  autoInstrumentationImage:
    java:
      repository: ""
      tag: ""
    nodejs:
      repository: ""
      tag: ""
    python:
      repository: ""
      tag: ""
    dotnet:
      repository: ""
      tag: ""
    # The Go instrumentation support in the operator is disabled by default.
    # To enable it, use the operator.autoinstrumentation.go feature gate.
    go:
      repository: ""
      tag: ""

admissionWebhooks:
  # A production setup should use certManager to generate the certificate, without certmanager the certificate will be generated during the Helm install
  certManager:
    enabled: false
  # The operator has validation and mutation hooks that need a certificate, with this we generate that automatically
  autoGenerateCert:
    enabled: true
现在安装收集器,使用配置文件:
helm upgrade --install opentelemetry-operator open-telemetry/opentelemetry-operator \
  --namespace open-telemetry \
  --values otel-operator.yaml
这仅安装 Operator。继续安装收集器并启用自动仪表化。
Open Telemetry 收集器
Operator 通过一种类型为 OpenTelemetryCollector 的 Kubernetes 自定义资源管理一个或多个收集器部署。我们将使用与 Kubernetes 入门指南 中相同的配置创建一个。
它使用在指南中之前创建的密钥。确保将 <otlp-suse-observability-endpoint:port> 替换为您的 OTLP 端点(请参见 OTLP API 获取您的端点),并将您的 Kubernetes 集群名称插入 <your-cluster-name> 位置:
apiVersion: opentelemetry.io/v1beta1
kind: OpenTelemetryCollector
metadata:
  name: otel-collector
spec:
  mode: deployment
  envFrom:
  - secretRef:
      name: open-telemetry-collector
  # optional service-account for pulling the collector image from a private registries
  # serviceAccount: otel-collector
  config:
    receivers:
      otlp:
        protocols:
          grpc:
            endpoint: 0.0.0.0:4317
          http:
            endpoint: 0.0.0.0:4318
      # Scrape the collectors own metrics
      prometheus:
        config:
          scrape_configs:
          - job_name: opentelemetry-collector
            scrape_interval: 30s
            static_configs:
            - targets:
              - ${env:MY_POD_IP}:8888
    extensions:
      health_check:
        endpoint: ${env:MY_POD_IP}:13133
      # Use the API key from the env for authentication
      bearertokenauth:
        scheme: SUSEObservability
        token: "${env:API_KEY}"
    exporters:
      debug: {}
      nop: {}
      otlp/suse-observability:
        auth:
          authenticator: bearertokenauth
        # Put in your own otlp endpoint, for example otlp-suse-observability.my.company.com:443
        endpoint: <otlp-suse-observability-endpoint:port>
        compression: snappy
    processors:
      memory_limiter:
        check_interval: 5s
        limit_percentage: 80
        spike_limit_percentage: 25
      batch: {}
      resource:
        attributes:
        - key: k8s.cluster.name
          action: upsert
          # Insert your own cluster name
          value: <your-cluster-name>
        - key: service.instance.id
          from_attribute: k8s.pod.uid
          action: insert
          # Use the k8s namespace also as the open telemetry namespace
        - key: service.namespace
          from_attribute: k8s.namespace.name
          action: insert
    connectors:
      # Generate metrics for spans
      spanmetrics:
        metrics_expiration: 5m
        namespace: otel_span
    service:
      extensions: [ health_check,  bearertokenauth ]
      pipelines:
        traces:
          receivers: [otlp]
          processors: [memory_limiter, resource, batch]
          exporters: [debug, spanmetrics, otlp/suse-observability]
        metrics:
          receivers: [otlp, spanmetrics, prometheus]
          processors: [memory_limiter, resource, batch]
          exporters: [debug, otlp/suse-observability]
        logs:
          receivers: [otlp]
          processors: []
          exporters: [nop]
      telemetry:
        metrics:
address: ${env:MY_POD_IP}:8888|
使用与安装 SUSE Observability agent 相同的集群名称,如果您还在 Kubernetes stackpack 中使用 SUSE Observability agent。使用不同的集群名称将导致 Kubernetes 组件的跟踪视图为空,并且总体上会使 SUSE Observability 和您的用户之间的信息关联变得更加困难。 |
现在在 open-telemetry 名称空间中应用此 collector.yaml 以部署收集器:
kubectl apply --namespace open-telemetry -f collector.yaml自动仪表化
配置自动仪表化
现在我们需要告诉 Operator 如何使用另一种自定义资源(类型为 Instrumentation)为不同语言配置自动仪表化。它主要用于配置刚刚部署的收集器,作为被仪表化应用程序的遥测端点。
它可以在一个地方定义,并被集群中的所有 Pod 使用,但在每个名称空间中也可以有不同的 Instrumentation。我们在这里将采用前者。请注意,如果您使用了不同的名称空间或不同名称的 otel 收集器,则此文件中的端点需要相应更新。
创建一个 instrumentation.yaml:
apiVersion: opentelemetry.io/v1alpha1
kind: Instrumentation
metadata:
  name: otel-instrumentation
spec:
  exporter:
    # default endpoint for the instrumentation
    endpoint: http://otel-collector-collector.open-telemetry.svc.cluster.local:4317
  propagators:
    - tracecontext
    - baggage
  defaults:
    # To use the standard app.kubernetes.io/ labels for the service name, version and namespace:
    useLabelsForResourceAttributes: true
  python:
    env:
      # Python autoinstrumentation uses http/proto by default, so data must be sent to 4318 instead of 4317.
      - name: OTEL_EXPORTER_OTLP_ENDPOINT
        value: http://otel-collector-collector.open-telemetry.svc.cluster.local:4318
  dotnet:
    env:
      # Dotnet autoinstrumentation uses http/proto by default, so data must be sent to 4318 instead of 4317.
      - name: OTEL_EXPORTER_OTLP_ENDPOINT
        value: http://otel-collector-collector.open-telemetry.svc.cluster.local:4318
  go:
    env:
      # Go autoinstrumentation uses http/proto by default, so data must be sent to 4318 instead of 4317.
      - name: OTEL_EXPORTER_OTLP_ENDPOINT
        value: http://otel-collector-collector.open-telemetry.svc.cluster.local:4318
现在在 open-telemetry 名称空间中也应用 instrumentation.yaml:
kubectl apply --namespace open-telemetry -f instrumentation.yaml为 Pod 启用自动仪表化
为了指示 Operator 自动仪表化您的应用程序 Pod,我们需要向 Pod 添加一个注释:
-
Java:
instrumentation.opentelemetry.io/inject-java: open-telemetry/otel-instrumentation -
NodeJS:
instrumentation.opentelemetry.io/inject-nodejs: open-telemetry/otel-instrumentation -
Python:
instrumentation.opentelemetry.io/inject-python: open-telemetry/otel-instrumentation -
Go:
instrumentation.opentelemetry.io/inject-go: open-telemetry/otel-instrumentation
请注意,注释的值指的是我们创建的 Instrumentation 资源的名称空间和名称。其他选项是:
-
"true" - 从命名空间注入和
Instrumentation自定义资源。 -
"my-instrumentation" - 当前名称空间中
Instrumentation自定义资源的名称。 -
"my-other-namespace/my-instrumentation" - 另一个名称空间中
Instrumentation自定义资源的名称空间和名称。 -
"false" - 不进行注入
当带有其中一个注解的 Pod 被创建时,Operator 通过变更钩子修改该 Pod:
-
它添加了一个初始化容器,提供自动仪表化库
-
它修改 Pod 的第一个容器,以在启动时加载仪表化,并添加环境变量以配置仪表化
如果您需要自定义哪些容器应该被仪表化,请使用 Operator 文档。
|
Go 自动仪表化需要提升的权限。这些权限由 Operator 自动设置: |
Rancher RBAC
为了使 Rancher RBAC 工作,遥测数据需要具有以下资源属性:
-
k8s.cluster.name- Kubernetes stackpack 使用的 集群 名称 -
k8s.namespace.name- Rancher 项目 管理的 名称空间
Kubernetes Operator 将默认将这些属性注入到发送的任何遥测数据中。
后续步骤
Operator、OpenTelemetryCollector 和 Instrumentation 自定义资源有更多选项,已在 Operator 储存库的自述文件 中记录。例如,可以通过 OpenTelemetryCollector 资源安装可选的 目标分配器,它可用于配置收集器的 Prometheus 接收器。当您想要替换 Prometheus Operator 并使用其 ServiceMonitor 和 PodMonitor 自定义资源时,这尤其有用。